

Introduction
Benefiting from the significant dividends unleashed by the reform and opening up, China’s agriculture and industry have given full play to their own endowment advantages and made great progress in the historical opportunities. This event has made important contributions to China’s rapid economic growth. The resulting environmental pollution and health problems have also brought severe challenges to the high-quality development of China’s economy. In 2015, the number of people who died from harmful substances, such as air, water, and soil, in the world reached approximately 9 million, of which China ranked second in the number of deaths caused by environmental pollution [1]. The Yale University Center for Environmental Law and Policy found in the 2018 Global Environmental Performance Index Report that in 2018, China ranked 120th among 180 countries and regions in the world in terms of environmental quality. In the field of air quality, China ranks 117th in terms of PM2.5 comprehensive evaluation and other aspects. According to the national carbon emission data disclosed by the Emissions Database for Global Atmosphere Research (EFGAR), from 1970 to 2019, the total carbon emissions of China and the world showed a parallel upward trend. China’s total carbon emissions accounted for about 30% of global carbon emissions. Although China’s per capita GDP carbon emissions have experienced a significant decline, it is still higher than the world average. Environmental problems, such as global warming, smog pollution, and water pollution, have seriously threatened people’s need for a better life. China’s party and government attach great importance to the improvement of environmental quality, and the construction of ecological civilization has an increasing status in the socialist system with Chinese characteristics and the national governance system.
In China, due to the severity and complexity of the current environmental pollution, the health problems caused by it have become prominent [2]. Studies showed that 70%-90% of human diseases are the result of a combination of genetic and environmental factors, such as cancer, cardiovascular diseases, and respiratory diseases. Taking cancer as an example, lung cancer was still the cancer with the highest mortality rate in China in 2015, while atmospheric PM2.5 pollution accounted for 23.9% of lung cancer deaths in China, much higher than the global average (16.5%) [3]. China is one of the countries most seriously affected by air pollution, with 1.1 million deaths caused by atmospheric PM2.5 pollution each year, an increase of 17.5% compared to 1990 [4]. Air pollution is the 4th health risk factor in China (the top 3 are high blood pressure, smoking, and high-sodium diet) [5]. Health is the foundation of people’s happiness and social development, and it is the common pursuit of people across the country for a better life. In October 2016, the “Healthy China 2030” Planning Outline issued by the Central Committee of the Communist Party of China and the State Council proposed to achieve the goals of “continuous improvement of people’s health” and “effective control of major health risk factors” by 2030. In July 2019, the “Healthy China Action (2019-2030)” issued by the Central Committee of the Communist Party of China and the State Council pointed out that “a good environment is the guarantee of health.” In June 2020, the Law of the People’s Republic of China on Basic Medical Care and Health Promotion was formally implemented. In October 2022, the 20th Party Congress made another special deployment for a healthy China.
The “14th Five-Year Plan” period is a period in which opportunities and challenges coexist in China’s environmental health work. How to balance the pros and cons of environmental quality, public health needs and economic development has become a new contradiction in China’s development. Data Envelopment Analysis (DEA) is a widely used linear programming technique that evaluates the relative efficiency of a decision making unit (DMU) based on the concept of pareto optimal solution. Based on this, we constructed a parallel two-stage EBM-DEA model, namely: the first stage is agricultural and industrial production efficiency (APE and IPE), and the second stage is health efficiency (HE), which is used to evaluate health production efficiency (HPE), stage efficiency (APE, IPE, and HE), and index efficiency of 30 provinces in China from 2016 to 2020. And answered the following four questions, (1) What is the relationship between environmental pollution caused by industrial and agricultural production and residents’ health? (2) What are the regional differences in agricultural production, industrial production, and health in China? (3) What are the differences between provinces and regions in pollution emissions and health indicators due to agricultural and industrial production?
(4) How can we maximize the level of health output under the constraints of limited resources to promote a new leap in health equity? What positive measures should provinces take?
This study offers three contributions. (1) Based on the characteristics of socio-economic production, the agricultural and industrial sectors are innovatively considered in a parallel DEA model, that is the parallel APE and IPE in the first stage. Re-measurement of China’s HPE in the new context. These considerations cover industrial and agricultural production and are closer to reality than previous literature. (2) This study considers the links among economic growth, resource consumption, environmental pollution, and public health in agricultural and industrial production. For the first time, this study combines APE, IPE, and HE. This combination is jointly incorporated into the parallel two-stage DEA model, and HPE is decomposed into the first-stage industrial and agricultural production efficiency and the second-stage HE. However, most of the research methods used in this field are limited to regression analysis. (3) A two-stage epsilon-based measure (EBM) model considering undesired output and a parallel data envelopment analysis (DEA) model are combined to construct a parallel two-stage EBM-DEA model. It not only fuses radial and non-radial distance functions to make the efficiency value more accurate, but also makes the model closer to the actual situation of industrial and agricultural production. Through the decomposition of the total efficiency, the efficiency differences between the stages can be clearly seen, which can better provide a scientific basis for building a healthy China and promoting the high-quality development of the industrial and agricultural economy.
The remaining section of this paper is organized as follows. Section 2 reviews the existing research and proposes the innovative nature of this study. Section 3 introduces the research methods and data sources of this study. Section 4 conducts empirical analysis and discussion. Section 5 summarizes the full text, puts forward relevant policy suggestions and identifies possible limitations of the paper.
Literature Review
Economic Growth, Environmental Pollution, and Public Health
The economy and the environment are interactive [6]. The traditional economic growth model is based on the excessive utilization of natural resources and the development of environmental capacity. Hence, a large amount of pollution will be generated under this economic growth model, resulting in the deterioration of environmental quality [7]. Moreover, the accelerated consumption of resources and the deterioration of the environment will hinder economic growth [8]. Research on the relationship between economic development and environmental quality has become a hot topic in the field of economics and environment. Such research is also an inevitable requirement to achieve sustainable development [9, 10]. Many scholars discussed the relationship between economic growth and environmental pollution, and the most typical is the Environmental Kuznets Curve (EKC) [11, 12]. As a non-economic factor that can affect public health, environmental pollution will significantly affect the health status of local residents [13, 14].
Environmental pollution includes water, air, soil, industrial solid waste, and other pollution. These environmental pollution factors will bring great harm to human health [15]. Previous studies in academia tended to examine the relationship between environmental pollution and public health. Among them, scholars in the fields of environmental science, resource utilization, and medical hygiene mostly evaluated the impact of environmental pollutants on human health from a quantitative perspective [16]. We will explore the two aspects of the loss and the impact mechanism of environmental pollution on human health in economic development. Thus, what public health problems will environmental pollution cause? Given the differences in research directions and priorities, scholars have different answers to this question, mainly focusing on the following aspects: environmental pollution will not only increase the risk of cancer, respiratory system diseases, digestive system diseases, and cardiovascular and cerebrovascular diseases and, even worse, can lead to premature death [17, 18].
However, studies on the interrelationship among economic growth, environmental pollution, and public health are relatively few, including the impact of the health effects of environmental pollution on social activities [19]. The environmental pollution caused by economic growth and energy consumption has created a great threat to the basic life and survival of residents [20]. From the perspective of the economic–energy– environment–health correlation logic, first, the industrial revolution has promoted the rapid development of the social economy. Moreover, energy has increasingly become an important driving force for global economic and social progress, but excessive energy consumption has also exacerbated the pollution of pollutant emissions, causing deterioration of environmental quality and threatening public health [21]. Second, environmental pollution aggravates the disease burden [22], which will directly affect economic development. The negative impact is that it will reduce human capital, resulting in healthy poverty, and thereby hindering the operation of the social economy. Then, the positive impact is that it will directly generate a healthy demand market and drive economic development [23]. Third, the damage to health caused by environmental pollution will also indirectly affect economic development. To treat diseases, health expenditure should be increased. This case will not only increase the burden on the medical economy but also accelerate the development of the health industry, thereby indirectly affecting the economy [24].
Application of the DEA Model in Production and Health Efficiency
Agriculture and industry are important production sectors in the development of China’s national economy. Agriculture is the primary industry of the national economy, and this industry is the leading industry of the national economy. Agricultural and industrial production involve complex economic activities and cannot simply be evaluated based on the level of output value. The input and output of various elements in industrial production should be comprehensively considered to comprehensively measure and evaluate their production efficiency [25]. The improvement of agricultural productivity can increase the output of the entire agricultural sector and accelerate the development of the agricultural sector [26]. Industrial production efficiency can reflect the quality of industrial development and has always attracted the attention of all sectors of society [27]. The most common quantification methods are DEA and stochastic frontier analysis (SFA) [28, 29]. Between them, the DEA model can avoid the subjective factors in the weight setting, so it has been widely used. The selection of input indicators in agricultural productivity mainly focuses on variables, such as capital, land, labor, fertilizer, and mechanical power [30]. Then, the selection of output indicators is mainly agricultural output value [31]. With the rapid development of the agricultural economy, a series of problems, such as ecological deterioration, environmental pollution, and resource waste, have appeared [32]. Therefore, some scholars considered pollutant emissions as undesired outputs when discussing the indicators of agricultural production efficiency, such as agricultural carbon emissions, agricultural wastewater emissions [33, 34], SBM model, and EBM model [35, 36].
Most of the early studies of industrial production efficiency focused on the measurement of single industrial production efficiency. On the basis of careful consideration of labor and capital input, the industrial economic output was selected to measure its production efficiency [37], without considering energy constraints and the production process of each production process, that is, pollution emissions [38]. Therefore, more and more scholars have begun to incorporate constraints, such as resources and environment, into the analysis framework of industrial production efficiency [39]. For example, when considering output indicators, variables such as CO2, SO2, and other industrial waste gas emissions and industrial wastewater emissions are considered an undesired output.
Most of the literature focuses on health productivity in one phase only [40]. For example, Shi et al. (2022) used a traditional DEA model to analyze the efficiency of health expenditure in 30 provinces in China from 1999–2018. Part of the literature paid attention to the relationship among economy, environment, and health and constructed a production-health two-stage DEA model. Feng et al. (2019) used a two-stage dynamic network DEA model to explore the effect of energy consumption on child and adult mortality, TB incidence, survival, and health expenditure in 28 EU countries and 53 non-EU countries during the 2010-2014 efficiency of environmental pollution effects. Liu et al. (2020) applied an improved two-stage dynamic network model considering undesired outputs for a joint analysis of energy consumption, economic growth, and air pollution in 31 high- and upper-middle-income cities in China from 2013 to 2016 and medical data. In addition, they calculated the overall efficiency, production efficiency, and health efficiency. However, the existing research assumes that the production stage is a whole.
Discussion of Literature
The above research has important implications for the development of this study, but some shortcomings and problems need to be solved, First, when using empirical methods to explore the relationship among economic development, environmental pollution, and public health and measure their efficiency, existing research focused more on the industrial production sector. Research in this field is often neglected in the agricultural sector. As two important components of the national economic system, agriculture and industry provide strong support for the healthy and sustainable development of the country’s economy and society. Both are also the main sources of resource consumption and environmental pollution. However, few scholars put agricultural production and industrial production into the same theoretical analysis framework to conduct research. Therefore, the two departments should be considered simultaneously when calculating the production efficiency. Second, the current research on agricultural production efficiency mainly focuses on the one-stage DEA model based on the input–output perspective. Few scholars have extended it to a two-stage model. The use of multi-stage DEA models in industrial production efficiency research is relatively abundant. However, most of the second or third-stage settings focus on environmental efficiency or environmental governance efficiency. Environmental pollution caused by agricultural and industrial production, such as water pollution and air pollution, will significantly affect the health status of local residents [44]. Thus, the indicators related to residents’ health with a one-stage model of agricultural and industrial production efficiency should be combined.
In view of this, this study will expand on the following two aspects: First, in the application of the method, a parallel two-stage EBM-DEA model considering undesired output is proposed by combining the EBM model considering the undesired output and the parallel DEA model. For the first time, the agricultural sector and the industrial sector are considered in a parallel system to reflect the economic, energy, and environmental linkages in the agro-industrial production efficiency stage. This decomposition of the entire production efficiency stage can better help decision-makers find the weaknesses of each subsystem. Thus, more effective recommendations can be made to improve the performance of that subsystem. Second, on the theoretical framework, a new two-stage theoretical analysis framework of APE, IPE and HE is constructed. Moreover, relevant indicators such as economic growth, resource consumption, pollution discharge, and public health are integrated into the same model for comprehensive evaluation. A tentative work on theoretical expansion in fields such as economics and health is conducted. Therefore, using a parallel two-stage EBM-DEA model to evaluate China’s HPE has become a new research topic.
Methodology
Research Methods
The traditional DEA model can be mainly divided into two types: radial and non-radial. The radial model is represented by CCR and BCC, and the non-radial model is represented by SBM. As CCR and BCC models ignore the non-radial relaxation problem, Tone (2001) proposed a relaxation-based measure (SBM) in 2001, but this measure ignores radial features of the same scale. Therefore, Tone and Tsutsui (2010) proposed an EBM model to address the efficiency overestimation and underestimation problems associated with radial and non-radial models, which is a hybrid model containing two types of distance functions: radial and SBM. Scholars such as Tavana et al. (2013) used the EBM model to explore China’s industrial efficiency. The advantage of the EBM model is that it not only considers the radial ratio between the target and actual values of production inputs but also reflects the differentiated non-radial slack variables among various inputs, making the efficiency evaluation more accurate. However, this model cannot solve the problem of multi-stage analysis in the DEA model.
The traditional DEA model regards the internal production process of a system as a “black box” when measuring efficiency, which may underestimate the inefficiency of the system and cause the configuration to be unreasonable to open the “box” and introduce the Internet DEA method [48]. The network DEA can be divided into three categories: The first category is to connect the DEA method. DEA uses two or more internal programs to be associated with intermediate measures to evaluate DMU. The second category is the parallel structure DEA method, which is also the focus of this study. In parallel structures, all stages work in parallel to each other. The third category is the hybrid structure DEA method to study a system with parallel and series units. Kao et al. (2008) developed a parallel DEA model to measure the efficiency of the system composed of parallel production units. Subsequently, Lu et al. (2022), Yang et al. (2023) and others have introduced parallel models into DEA models. Furthermore, Kao (2009) divided the entire production process into different sub-processes, connecting each stage by connecting variables, thereby calculating the efficiency values at different stages. However, the parallel model of Kao does not maximize efficiency, and the network DEA model has better solved multiple stages of problems, but it cannot solve the defects of radial and non-radial models, nor does it consider the function of the child unit.
To explore the efficiency values at different stages in the production process simultaneously, solve the defects of radial and non-radial models at the same time, and better analyze the actual situation, we will put Tone and Tsutsui (2010) in the two stages of EBM-DEA and Kao et al. (2008) and Kao (2009) the parallel DEA model of proposed a two-stage EBM model in parallel to evaluate the HPE of 30 provinces and cities in China.
The specific model explanation is as follows:
The EBM model is named by the use of parameters, so we must first describe and determine the parameters. The parameter is used in the model to calculate the value of the African radial part in the calculation efficiency value. Its value range is [0,1]. When the parameter is obtained, it is equivalent to the radial model. Tone and Tsutsui (2010) used the SBM model to calculate the projection value of each input indicator. For example, the projection value of the two invested projection values of X1 and X2 is P1 and P2, and P1 and P2’s correlations are expressed under specific production technology (Production Foreign) In the proportion of the two inputs and through the analysis of the quantitative relationship, the alternative between each investment can be obtained: when the quantity shows a highly linear positive correlation, the replacement is poor. The production needs to be relatively fixed proportional proportions. In progress, at this time, the measurement of production efficiency is biased toward radial measurement, and the ε parameters should be taken with a small value. On the contrary, when the quantity shows a highly linear negative correlation, the ε parameter should be larger. From the above projection value, the projection value associated with the index matrix of the input index can be established, where S is a function that calculates the association index between the P1 and P2.
Next, Tone and Tsutsui (2010) used the discrete exponential function to calculate the discrete index between every two indicators D(a,b):
(1)
The correlation index is then calculated using the discrete index: S(a,b) = 1 − 2D(a,b).
Finally, the ε parameter is calculated by the correlation index matrix:
where ρ is the largest eigenroot of the correlation index matrix.
After the ε parameter is determined, it can be substituted into the EBM formula to calculate the efficiency value. Suppose that there are n DMUs (decision-making units) labeled DMUj (j = 1, ..., n), each with k divisions (k = 1, ..., K). Each DMU uses m inputs Xi (i = 1, ..., m) to produce r outputs Yr (r = 1, ..., r)). In this case, the expression formula of the overall efficiency of the production process is as follows:
(2)
Subject to:
Stage 1.1: APE
(3)
Stage 1.2: IPE
(4)
Stage 2: HE
(5)
The formula for calculating the efficiency value of each stage is as follows:
In the above formula, first, Xijk∈R + (i = 1, ..., mk;j = 1, ..., n;k = 1, ..., K) refers to input i at time period t for DUMj division k;Xijk: In APE, primary industry employees, agricultural water use, and total sown area of crops are inputs of stage 1.1. In IPE, urban employees, energy consumption, and investment in fixed assets are inputs of stage 1.2.
Yrjk∈R + (r = 1, ..., rk;j = 1, ..., n;k = 1, ..., K) refers to output r for DUMj division. Yrjk: CO2 emissions and agricultural wastewater are outputs of stage 1.1. Industrial wastewater emissions, industrial waste gas emissions, and industrial solid waste emissions are outputs of stages 1.2. The birth rate, the mortality rate and tuberculosis incidence are outputs of stage 2.
Zj(kh)l∈R + (j = 1, ..., n;l = 1, ..., L hk) are links from DUMj division k to division h, with Lhk being the number of k to h links. Zj(kh)l: Local financial expenditure on medical and health, CO2 emissions, agricultural wastewater, industrial wastewater emissions, industrial waste gas emissions, and industrial solid waste emissions are selected as the link indicators in stages 1.1, 1.2, and 2.
Data Source
Based on the parallel two-stage EBM-DEA model cited in the previous section, we designed the theoretical analytical framework of the class as follows (Fig. 1) and chose the following input-output indicators to reevaluate the HPE of China’s provinces and regions:
Stage 1.1, APE: The primary industry employees, agricultural water use, and the total sown area of crops are used as inputs. The added value of agriculture, forestry, animal husbandry, and fishery is used as the expected output, and CO2 emissions and agricultural wastewater are regarded as the undesired outputs.
Stage 1.2, IPE: The number of urban employees at the end of the year, energy consumption, and investment in fixed assets are used as inputs. Then, the industrial added value is used as the expected output, and industrial wastewater emissions, industrial waste gas emissions, and industrial solid waste emissions are used as undesired outputs.
Stage 2, HE: The pollutant output from the APE and IPE stage is continuously input into the second stage. Moreover, the local financial expenditure on medical and health care is increased as the input variable of the second stage. The birth rate is used as the expected output, and the mortality rate and tuberculosis incidence a second-stage undesired outputs.
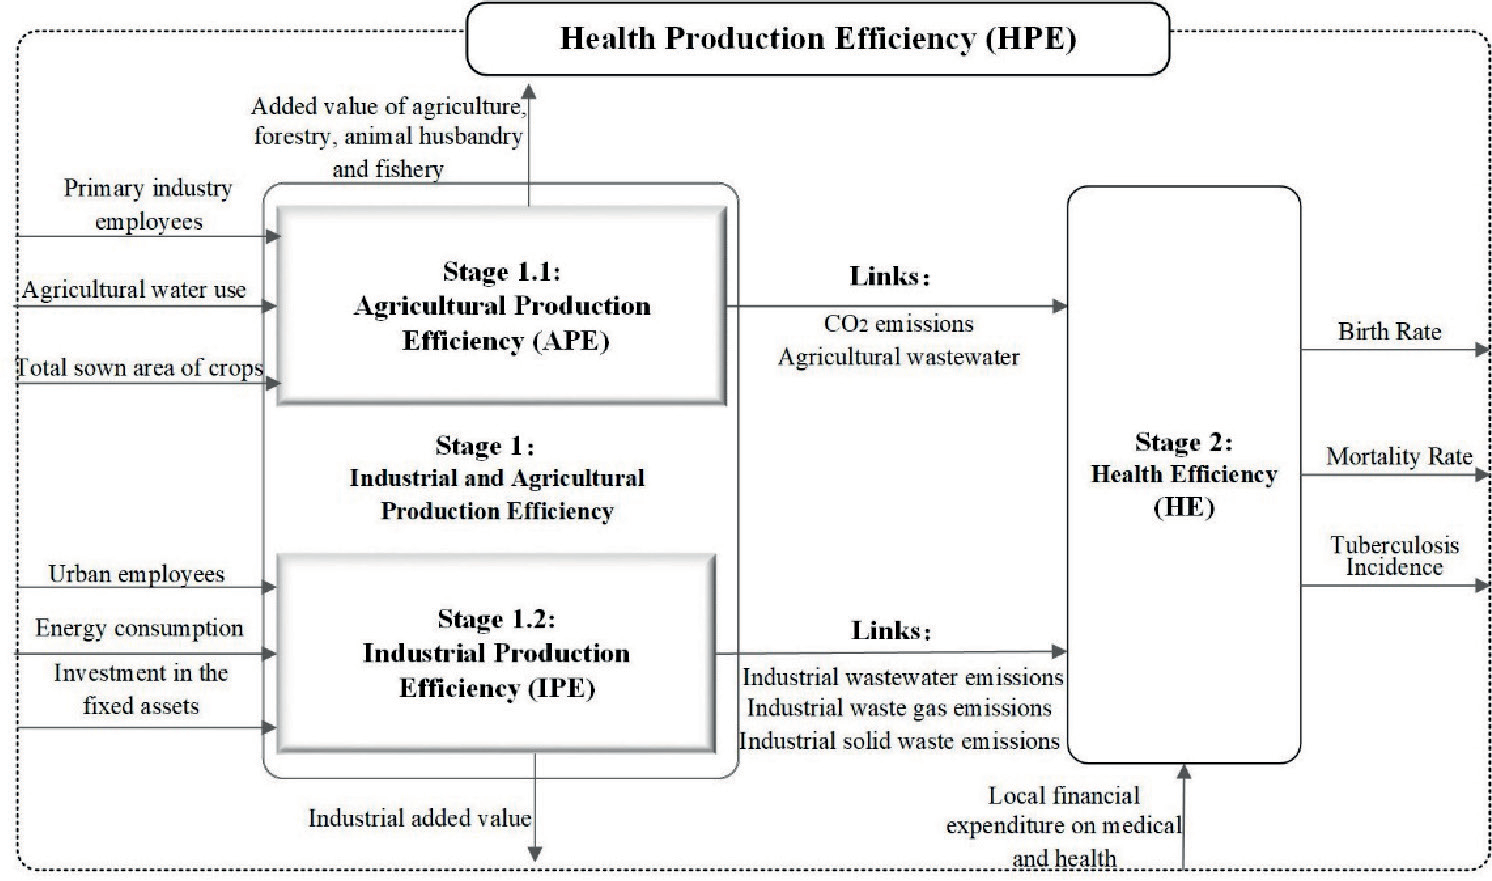
Compared with the existing research, this study is more innovative in the selection of indicators. First, previous studies only tended to examine the impact of air pollution, such as CO2 and PM2.5, on human health and economic production in the first stage. They seldom considered other indicators of environmental pollution. To examine the relationship between different pollutants and residents’ health more comprehensively and systematically, this study additionally selects wastewater, exhaust gas emissions, and solid waste generation as output indicators in the production stage. Second, existing studies often used mortality to measure the health of residents. In most cases, environmental pollution affects public health but does not directly cause death. The mortality rate underestimates the actual impact of environmental pollution. Therefore, this study originally planned to collect data on the incidence of respiratory diseases, digestive diseases, or tumors that are more directly affected by environmental pollution. However, after consulting with professionals from the provincial statistical bureaus and health commissions, the study found that such data are nonpublic. Therefore, when the research data are seriously insufficient, we consider referring to other materials. Combined with the “2030 Agenda for Sustainable Development” jointly adopted by the United Nations Sustainable Development Summit in September 2015, maternal mortality, neonatal mortality, tuberculosis incidence, and others are used as the main indicators of national or regional population health, and data availability, including birth, mortality, and tuberculosis incidence as output indicators during the HE phase.
This article uses panel data from 30 provinces in China from 2016 to 2020. The relevant indicator data are mainly from the “China Statistical Yearbook,” “China Environmental Statistical Yearbook,” “China Energy Statistical Yearbook,” “China Health Statistical Yearbook,” “China Agricultural Yearbook,” “National Environmental Statistical Bulletin,” “China Industrial Statistical Yearbook,” the “Statistical Bulletin of Health Development,” and “Statistical Bulletin of National Economic and Social Development” of all provinces and regions. Table 1 shows the descriptive statistics of the variables. Notably, as can be seen from the standard deviation column in Table 1, provinces are highly heterogeneous in terms of scale and economic characteristics.
We use 30 provinces in China (Hong Kong, Taiwan, Macau, and Tibet are not considered in this article due to incomplete data). The 30 provinces are divided into three major regions based on administration and geographical location: eastern, central, and western. See Table 2 for details.
Results
Overall Efficiency Analysis
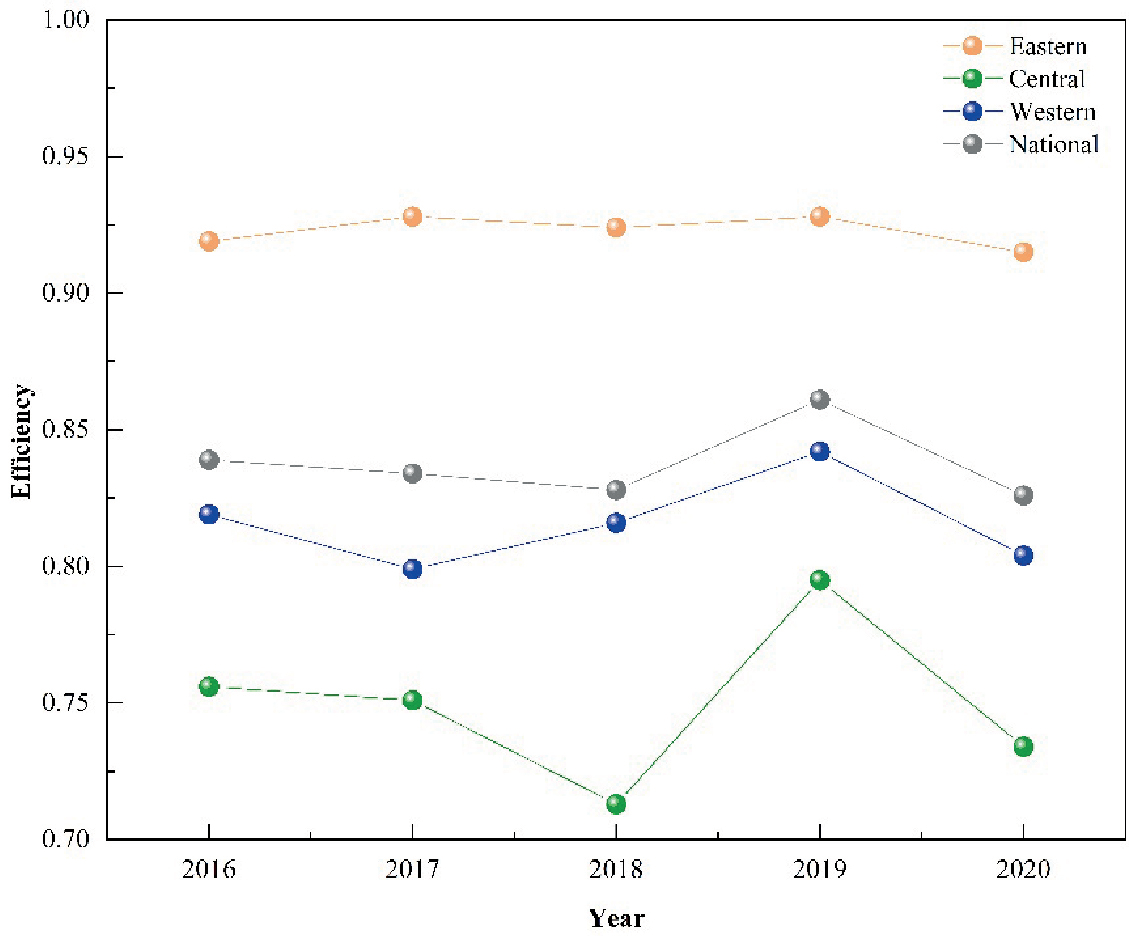
The overall efficiency of this paper is HPE. Table 3 shows the overall efficiency value of health production and its ranking in China’s 30 provinces from 2016 to 2020. The average HPE of Beijing, Fujian, Zhejiang, and Ningxia is 1, which is on the frontier of efficiency. This result indicates that these four provinces have reached the optimal level of resource utilization, pollution reduction, and healthy production, which is the learning and catch-up of other provinces. This case is closely related to local economic development, geographical location, and policy content. Among the provinces that have not reached the frontier of efficiency, Jilin has the lowest average HPE of 0.577. As a province with large resources in China, Jilin has a large reserve, development, and utilization of resources. Balance and other issues eventually lead to the lowest HPE value in the country. Moreover, we found that 80% of the top 10 provinces in HPE are located in the eastern region, and 50% of the bottom 10 provinces are located in the central region. The regional distribution of HPE values in each province is evident.
Table 1.
Descriptive statistics of variables.
During the study period, the HPE value of most provinces showed an upward trend, among which Gansu had the most evident increase. The ranking in 2020 increased by 11 places compared with 2016, and the total efficiency value increased by 0.308. This case shows that Gansu has good output in the stages of IPE and APE and HE in 2020. On the contrary, HPE of Jiangsu, Shandong, Shanghai, Qinghai, Sichuan, Guizhou, Henan, Shanxi, Xinjiang, and Jilin showed an overall downward trend from 2016 to 2020. Among them, Xinjiang has the most evident downward trend, ranking from 18th to 30th, and the total efficiency value has dropped by 0.362. One of the important reasons is the economic competition behavior of local governments. To stand out in the government GDP competition, the type of investment often attracts some pollution, affecting the health of residents, coupled with the frequent occurrence of natural disasters, such as that in Xinjiang in 2017–2018. Thus, the HPE is affected. In general, except for Beijing, Fujian, Ningxia, and Zhejiang, which have reached the efficiency frontier, HPE values of the remaining 26 provinces are between 0.6 and 0.9. There is room for improvement to varying degrees.
Fig. 2 shows a trend chart of HPE values across the country and the eastern, central, and western regions from 2016 to 2020. The comprehensive efficiency value presents the pattern of east > west > central. The HPE value of the eastern region has exceeded 0.9 in the past five years, which is higher than the national average. In addition, the central and western regions are between 0.7 and 0.85, which is below the national average. The reason is that the economies of the provinces in eastern China are relatively developed, and more funds are used to develop low-energy-consumption industries and health care. These industries rely on their strong economic and technological advantages to drive the overall efficiency of the region. The provinces in the central region have achieved rapid regional development through their abundant natural resources and strong industrial base. However, as the industrial structure in the central region is not well managed, economic growth has brought about an increase in energy-intensive industries and pollutant emissions, which has lowered overall efficiency. With the smooth progress of the western development strategy and the overall victory in the battle against poverty, the gap between the western and eastern regions in economic development, infrastructure, health services, and other fields has become smaller and smaller and has surpassed the central region, which has made great strides in growth.
Table 2.
Regional classification in China.
Table 3.
2016-2020 HPE and ranking of 30 provincial regions in China.
Efficiency Analysis of the Parallel Stage
Efficiency Comparison of Each Stage
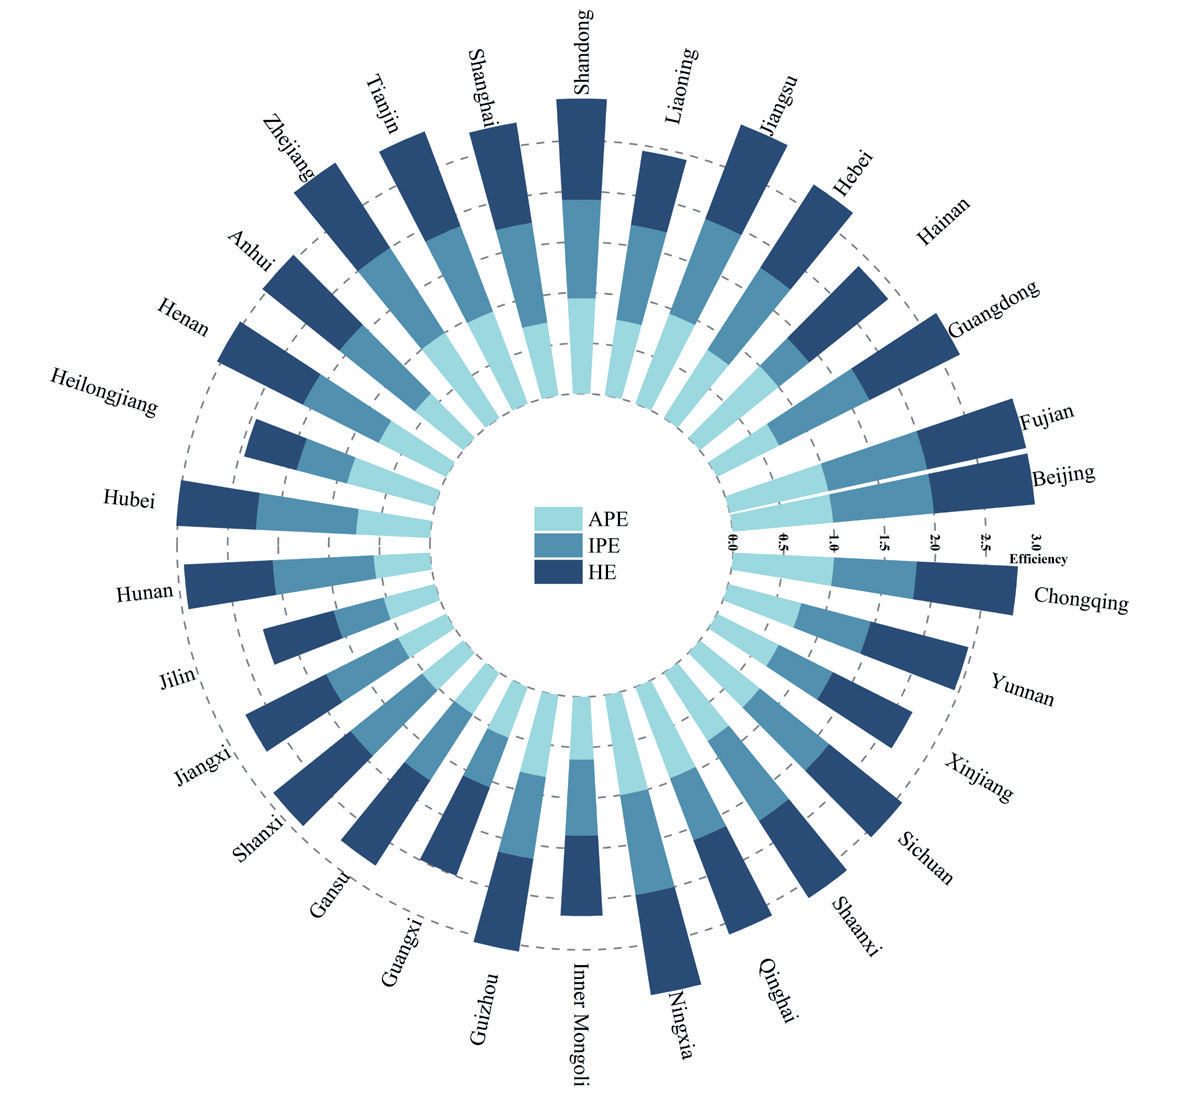
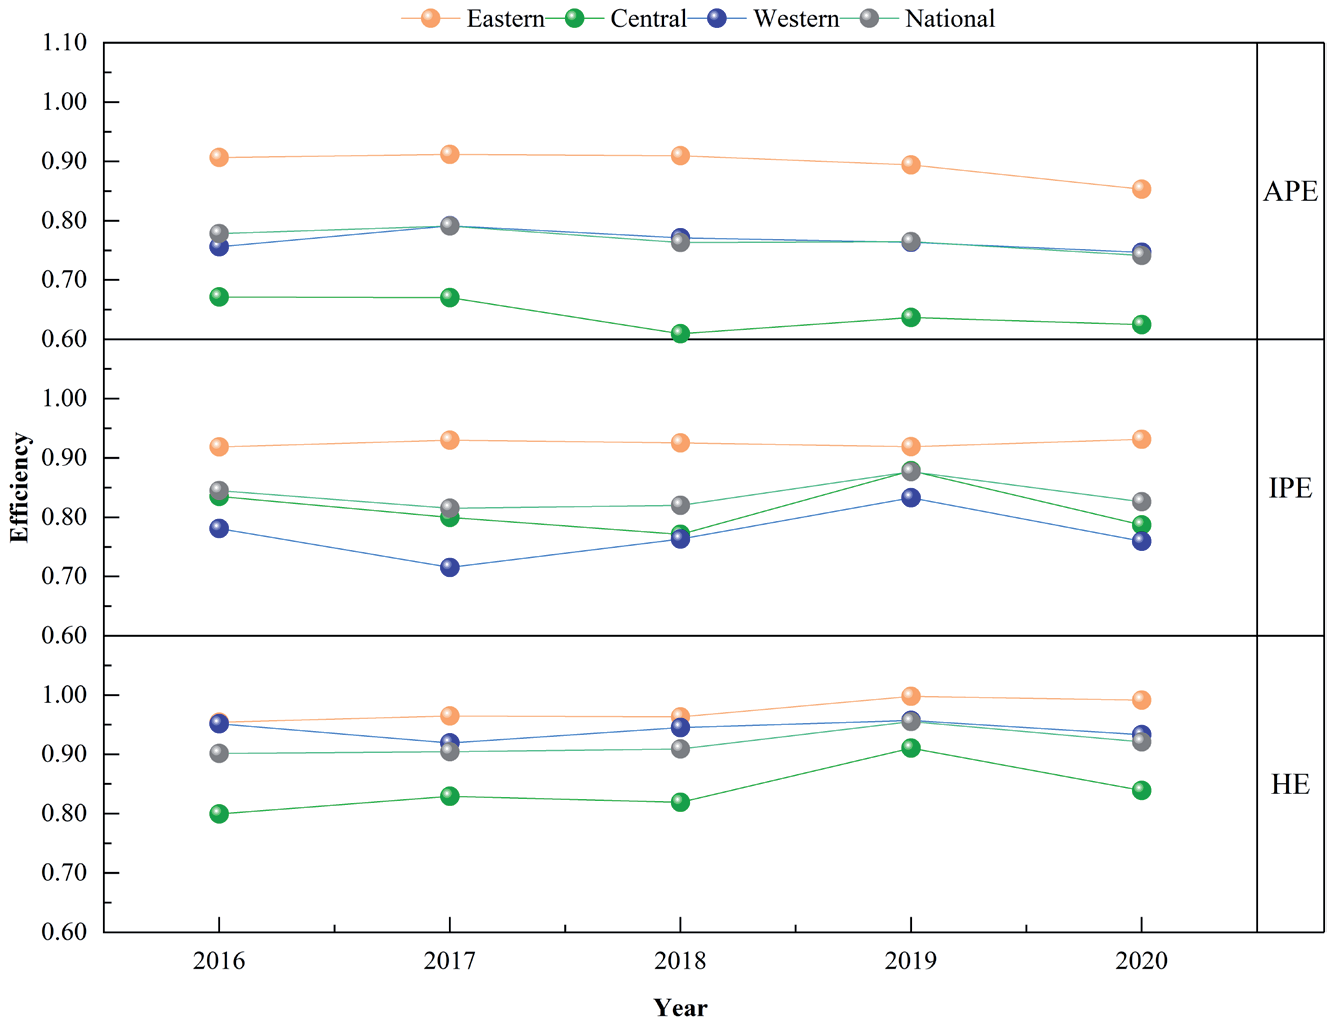
Fig. 3 presents a comparison of APE, IPE, and HE values for each province in China. Only Beijing, Fujian, Zhejiang, and Ningxia achieved efficiency values of 1 in the three stages. In general, the efficiency value of the health stage is generally better than the efficiency value of the agricultural production and industrial production stages. The HE value of Liaoning is lower than the efficiency value of the other two stages, which lowers the HPE, indicating that the province should pay more attention to it. Residential health field. The IPE values of Hainan, Heilongjiang, Jilin, Guangxi, Qinghai, Xinjiang, Yunnan, and Chongqing are all lower than the APE and HE. Therefore, local governments in these eight provinces should put more resources into how to improve IPE. The stage differences in the remaining 17 provinces are that the value of APE is lower than the value of industrial production and HE. These provinces should pay more attention to the improvement of APE. Fig. 4 shows a comparison of the eastern, central, western and national efficiency averages for the three phases. Both APE values and HE show an Eastern>Western>Central pattern. The IPE shows an Eastern>Central>Western pattern.
Efficiency Analysis of Stage 1.1: APE
Fig. 5 shows the trend of efficiency values in the agricultural production stage of provinces from 2016 to 2020. In the eastern region, except for Beijing, Fujian, Hainan, and Zhejiang, which have reached the efficiency frontier in five years, Jiangsu and Tianjin also have an efficiency value of 1 for four years, and they are very close to the efficiency frontier in stage 1.1. The APE of the remaining provinces showed a downward trend, ranging from 0.6 to 0.9. Among them, Shanghai had the largest decline, and Guangdong had the lowest efficiency value. In the central region, only Henan and Heilongjiang reached the frontier in 2016 and 2019, respectively, and Henan fluctuated the most. The efficiency value dropped from 1 in 2016 to 0.656 in 2020, a drop of 34.4%. Jiangxi, Shanxi, and Jilin have lower agricultural productivity values. In the western region, only Ningxia and Chongqing had an efficiency value of 1 in five years. Except for Guizhou, Xinjiang, and Shaanxi, which showed a downward trend as a whole, Xinjiang had the largest decline, reaching 60.8%. The rest of the provinces showed an overall upward trend. Gansu and Guangxi have lower efficiency values.
Fig. 4.
Comparison of eastern, central, western and national efficiency averages for the three phases.
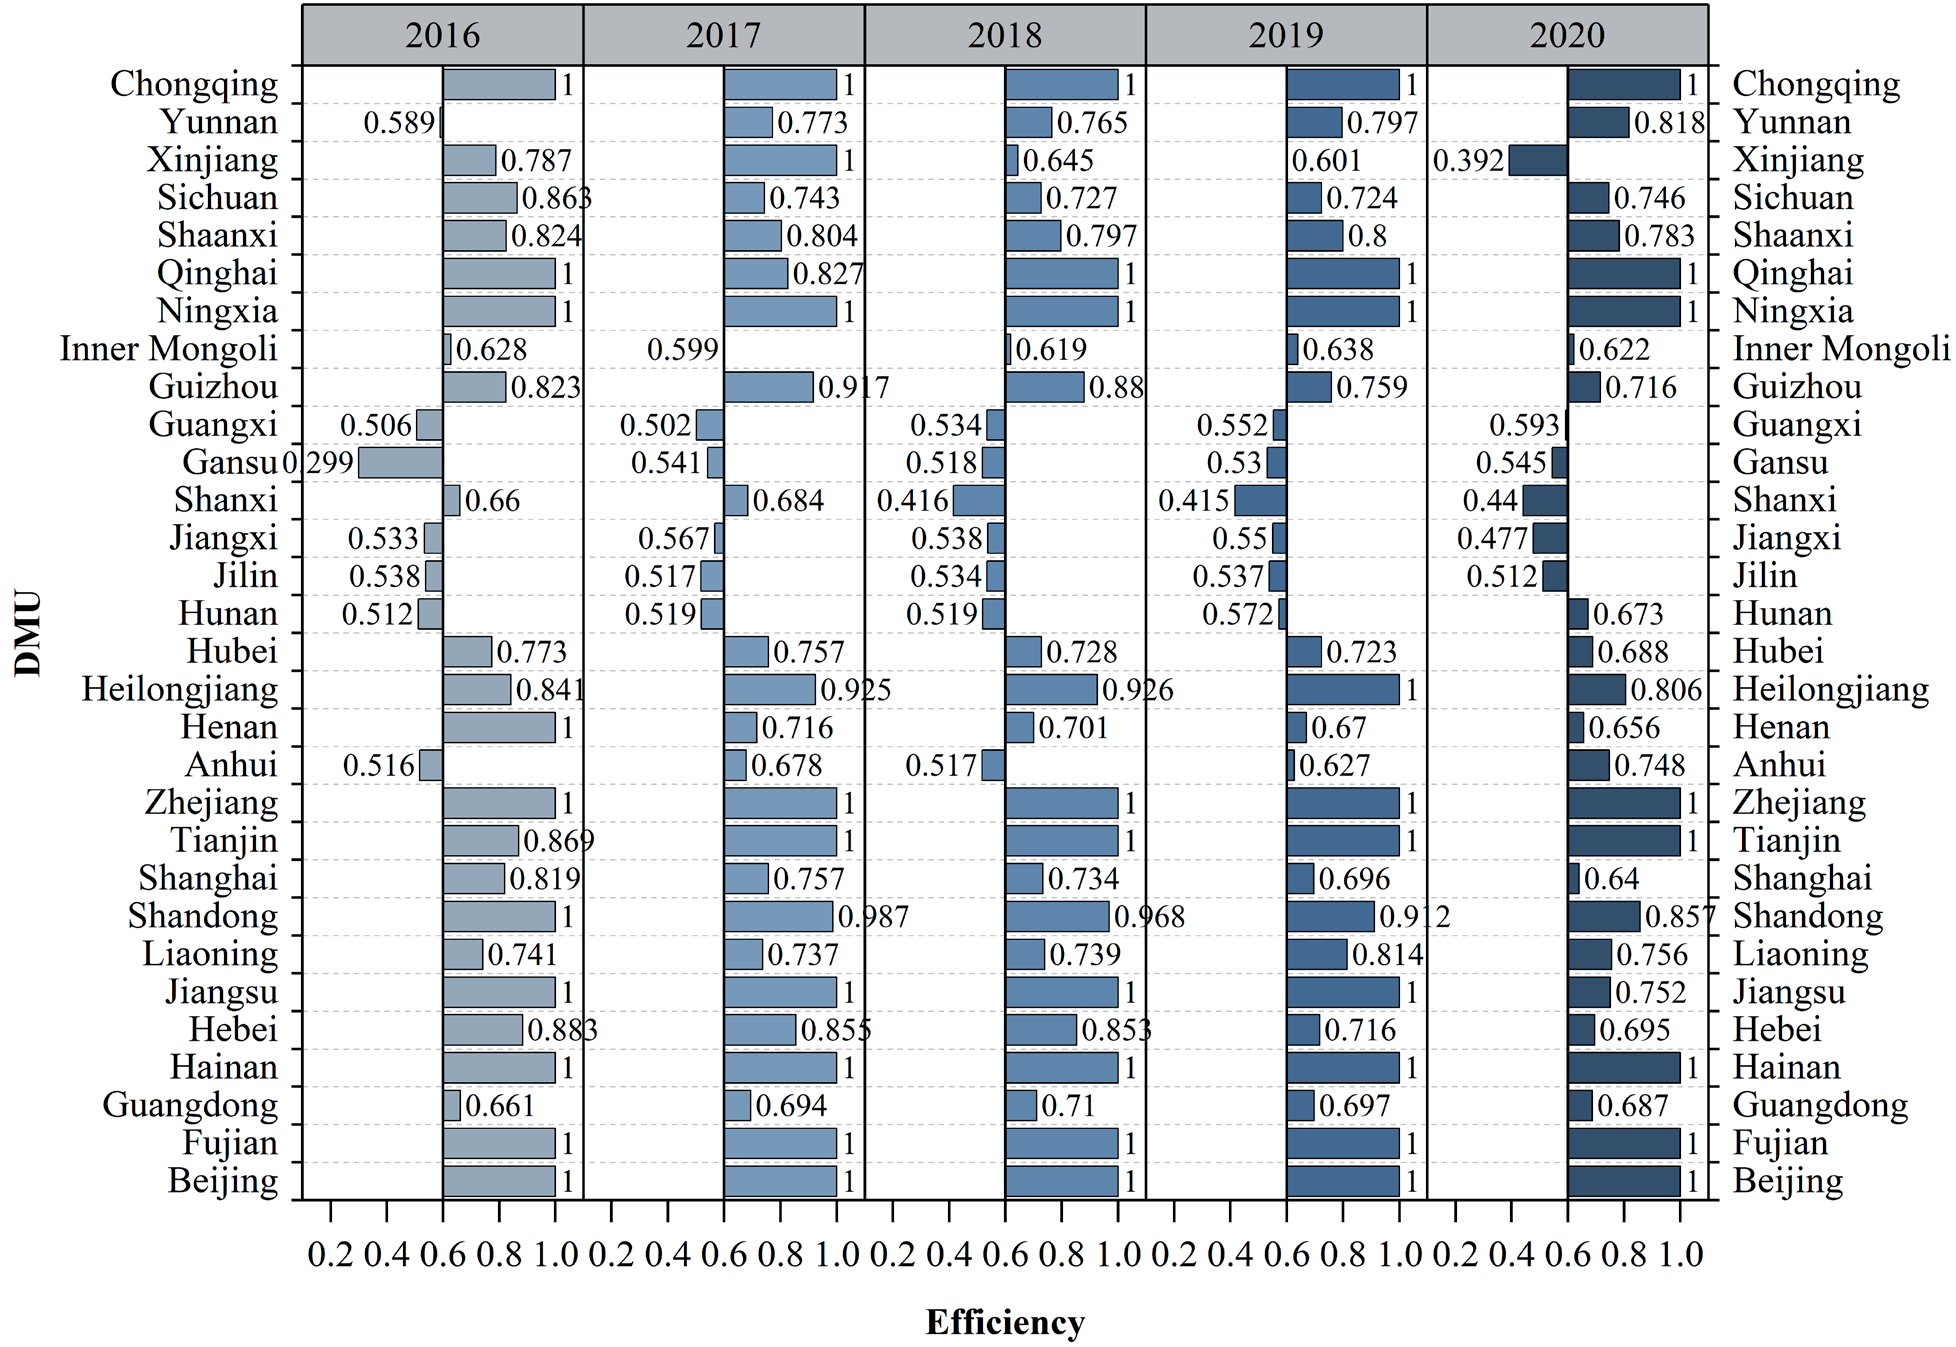
There is a big gap in the value of APE in different regions and provinces, which is closely related to the agricultural human capital, crop sown area, water resources endowment, and other high-quality development. Provinces with good APE, such as Jiangsu and Zhejiang, which have good natural and basic labor conditions for agricultural production, are important grain-producing areas. The agricultural modernization process is relatively high, and the resources in the agricultural production process can be fully utilized. As for the provinces with low or declining APE, in some cases, we found through the verification data, such as Shanxi and Guangdong, that these two provinces have relatively large primary industry working populations, large planting areas, and agricultural water use. On the contrary, the decline in efficiency reflects a slowdown in the value added to agriculture, forestry, animal husbandry, and fishery and an increase in agricultural wastewater discharge. In other cases, Gansu, Guizhou, and Yunnan are either characterized by a dry climate or are geographically located in plateaus and hilly mountains, where resources are scarce. As an industry type most closely related to natural conditions, agriculture is directly affected by local natural environment conditions and agriculture and the impact of production history activities.
Efficiency Analysis of Stage 1.2: IPE
Fig. 6 shows the trend of efficiency values in the industrial production stage of provinces from 2016 to 2020. In the eastern region, the industrial production efficiencies of Beijing, Fujian, Guangdong, Jiangsu, Shanghai, and Zhejiang have all reached the frontier of efficiency in the past five years. The values are between 0.75 and 1. In the central region, only Hunan’s industrial production has reached the frontier of efficiency in the past five years, and Heilongjiang has the largest fluctuation, with a linear increase of 62.8% from 2018 to 2019, and a linear decline of 64.3% from 2019 to 2020, related to health policy. Jilin has been in a downward trend for five years, and the efficiency value has dropped from 0.718 in 2016 to 0.426 in 2020. The IPE values of the remaining provinces showed an overall upward trend. In the western region, only Ningxia’s IPE reached 1 in five years, and the other 10 provinces fluctuated to varying degrees. Among them, Gansu had the lowest efficiency value in 2016, only 0.405. Guangxi had the lowest overall level at 0.523. Xinjiang has the largest downward trend, reaching 42.1%. Gansu has the largest increase, reaching 59.5%.
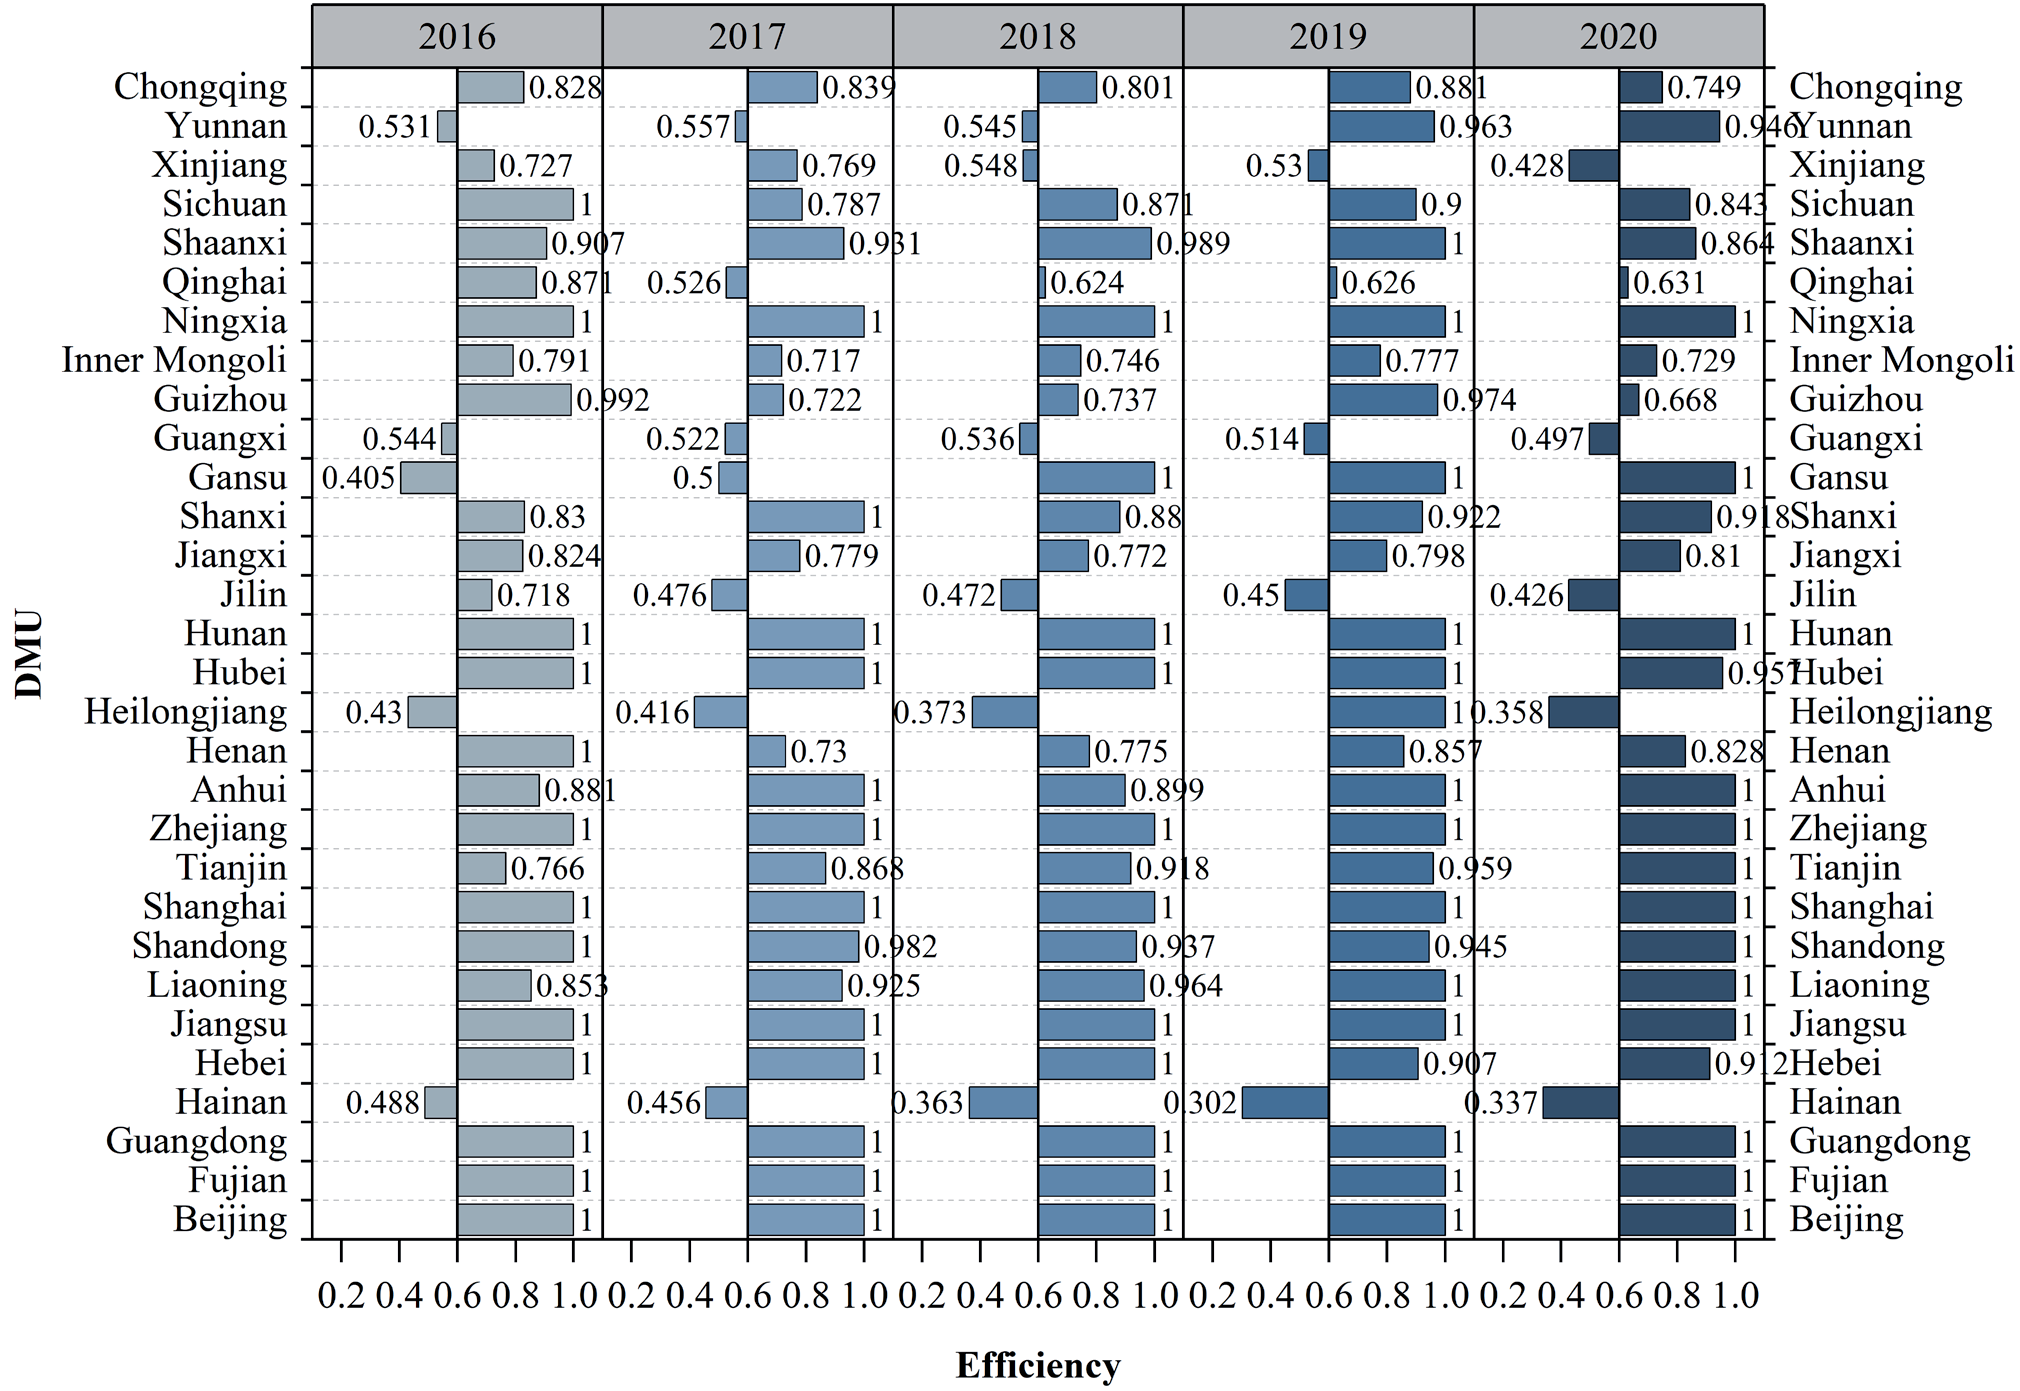
The provinces with relatively effective IPE are mainly concentrated in the eastern region, and the relatively ineffective provinces are mainly concentrated in the central and western regions. The eastern region is a relatively developed region of China’s economic development. The urban industrial economy is developing rapidly, and it is more efficient in terms of human capital, energy consumption, and environmental management and utilization. The provinces in the western region are significantly affected by the policies supported by the national western development strategy. In addition, the gap between IPE and the eastern and central regions has gradually narrowed. For provinces with low IPE in the western region, such as Guizhou, Qinghai, and Sichuan, their industrial infrastructure is relatively weak, the industrial human capital is relatively scarce, and the technological level is more extensive. Therefore, the IPE is relatively low. In addition, great differences are found in economic foundation, natural resources, energy consumption, financial investment, and environmental regulations among provinces across the country. Therefore, Hainan, for example, is located in the eastern region with relatively rich resources, but its IPE is very low. The main reason is that as a province dominated by the tertiary industry, Hainan has a prosperous service industry. Therefore, resources such as manpower and energy invested in the industrial production stage are relatively few.
Combination Analysis of APE and IPE
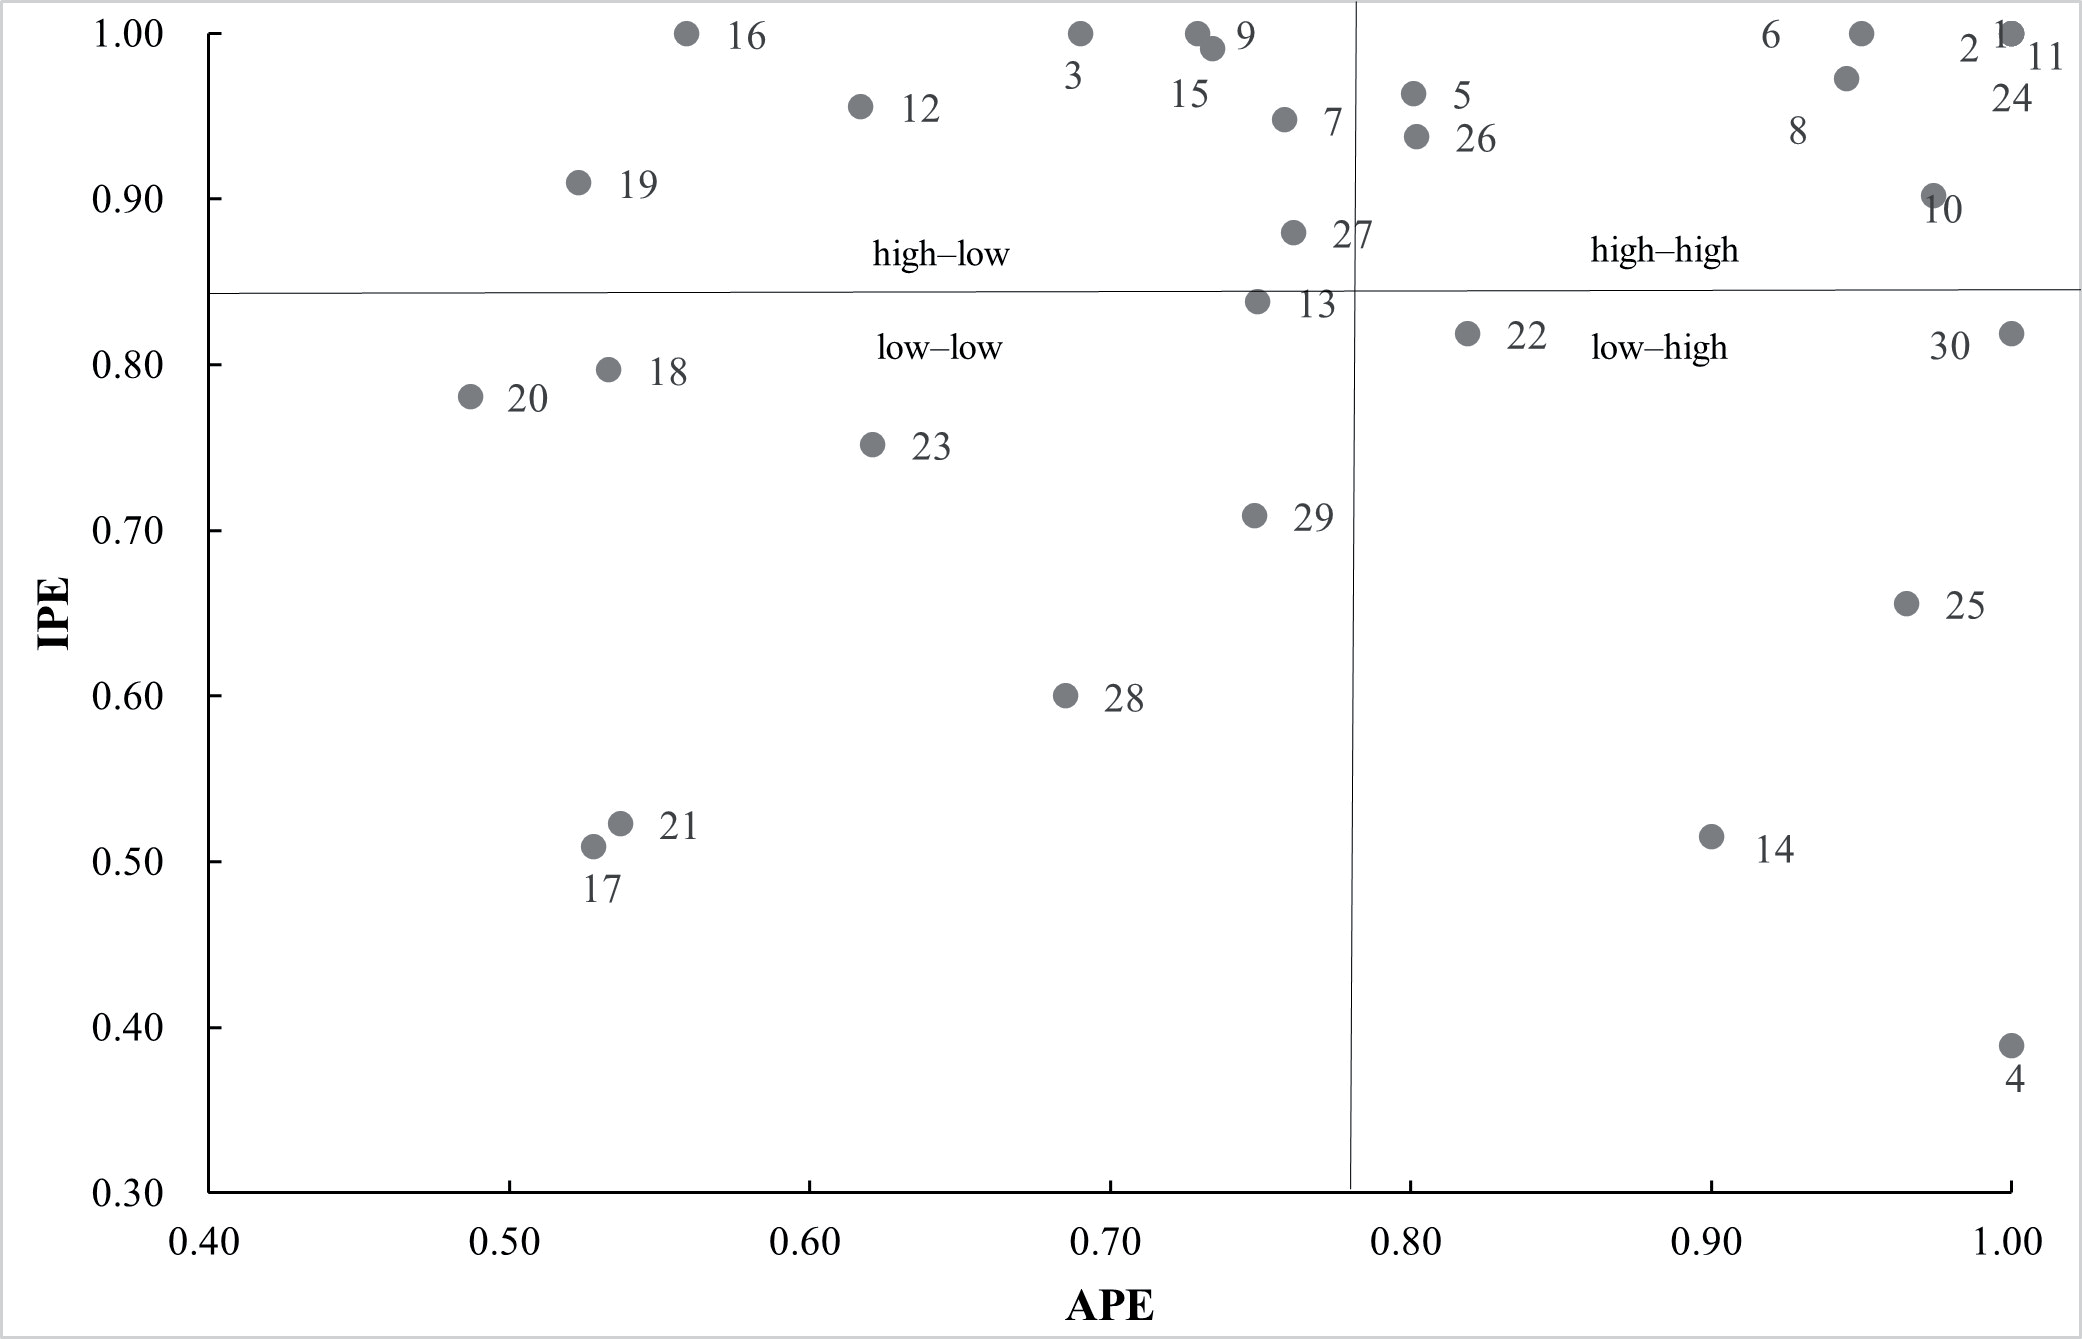
Taking the average value of agricultural and industrial production efficiencies as the critical point, the 30 provinces in China are divided into “high” and “low” and combined into four types (low–low, low–high, high– high, and high–low), as shown Fig. 7. Although the APE and IPE values in “high–high” regions, such as Tianjin and Shaanxi, are higher than the national average, a gap still exists between them and Beijing, Zhejiang, Fujian and Ningxia, which have reached the frontier of efficiency. The “low–low” provinces are all located in the central and western regions. The closer the province is to the lower left corner of Fig. 6, the more severe the “low–low” state is, such as Jilin and Guangxi. This case is in contrast to the province closer to the upper right corner. For the “low–low” type of province, we should aim at the “high–high” type of province, continuously improve the utilization efficiency of resources, and pay attention to the protection of the environment while developing the industrial and agricultural economy and consuming energy. In the “high-low” provinces (Hunan, Anhui, Guangdong, etc.), more attention should be paid to the rational and efficient use of agricultural resources. Provinces in the “low-high” category (Hainan, Chongqing, Guizhou, etc.) should pay more attention to the sustainable development of industrial production.
Efficiency Analysis of Stage 2: HE
Table 4 shows the distribution of HE in 30 provinces in China from 2016 to 2020. From the perspective of the HE value considering pollutant input and capital investment, evident differences are found between regions. Moreover, there is a large room for improvement. In the eastern region, except for Hebei and Liaoning, all other provinces have reached the efficiency frontier in the past five years. Liaoning has the lowest HE value, ranging from 0.4 to 0.6 in 2016– 2018. Among the central regions, only Anhui has reached the efficiency frontier for four years. With the exception of Hubei, the efficiency values of most of the provinces showed a downward trend in the past five years. Heilongjiang has the worst performance in HE. Except for 2019, the efficiency value for the rest of the years is between 0.4 and 0.45. In the western region, Ningxia and Chongqing achieved a healthy production efficiency value of 1 in five years. Gansu and Yunnan also achieved an efficiency value of 1 in 2017-2020. Most of the provincial efficiency values showed a fluctuating downward trend, among which Xinjiang had the largest decline, reaching 81.2%.
The reason for this regional difference may be that, for a long time, China’s medical and health resources have been more concentrated in the eastern region. In addition, the investment in medical and health resources in the central and western regions is relatively insufficient. Emissions are greater than those in the eastern region. Most of the provinces at the frontier of efficiency are located in the eastern region. The common characteristics of their healthy production systems are high birth rates, low mortality rates and low tuberculosis incidence, including capital investment and pollutants in the healthy stage. Emissions are quite reasonable, resulting in a HE value of 1. The healthy production model and industrial green development in such areas are quite mature, and the residents’ health level is good, which is an ideal state of the health system.
Provinces with lower or declining efficiency values (Heilongjiang, Jiangxi, Xinjiang, and others) are more concentrated in the central and western regions. Taking Heilongjiang as an example, its agricultural and industrial pollutant emissions are at the middle and upper levels in the country. However, its input in financial medical and health expenditures and the output of birth rates are at the bottom of the country, and its mortality, tuberculosis incidence, and food sources are at the bottom. The high incidence of STDs ultimately leads to low HE values. However, Hainan, which has less investment than Heilongjiang, has reached the forefront of production. Therefore, Heilongjiang should pay attention to reversing the extensive concept of healthy production; strengthen its attention to environmental governance, pollution discharge, public health, and other issues; improve industrial or agricultural economic benefits according to its own actual conditions; and enhance the quality and allocation efficiency of health and medical resources, thereby reducing mortality and morbidity and raising the birth rate. This path is relatively reasonable. The situation in Liaoning, Inner Mongolia, and Jilin is similar to that in Heilongjiang.
Fig. 7.
Distribution of average efficiency of agricultural and industry stage. Note: The provinces represented by the numbers in the figure are as follows, 1 Beijing; 2 Fujian; 3 Guangdong; 4 Hainan; 5 Hebei; 6 Jiangsu; 7 Liaoning; 8 Shandong; 9 Shanghai; 10 Tianjin; 11 Zhejiang; 12 Anhui; 13 Henan; 14 Heilongjiang; 15 Hubei; 16 Hunan; 17 Jilin; 18 Jiangxi; 19 Shanxi; 20 Gansu; 21 Guangxi; 22 Guizhou; 23 Inner Mongolia; 24 Ningxia; 25 Qinghai; 26 Shaanxi; 27 Sichuan; 28 Xinjiang; 29 Yunnan; 30 Chongqing
Indicator Efficiency Analysis of Environmental Pollution and Health
Table 5 shows the efficiency values of key indicators. As an additional input variable in HE, local financial, medical, and health expenditures have an efficiency value of 1 in 13 provinces. Notably, the efficiency value of this indicator in Guizhou, Hubei, Jiangxi and Guangxi is below 0.8, indicating that these provinces are in the healthcare industry. There is room for improvement in the efficiency of capital utilization. Agricultural wastewater emissions and industrial waste gas emissions are used as intermediate variables, which are undesired outputs of the first stage and inputs of the second stage. The efficiency value of agricultural wastewater discharge is higher than that of other input indicators, and only nine provinces have not reached the efficiency frontier. The index efficiency of industrial waste gas emissions and the efficiency of energy consumption index show similar regional differences. Provinces with higher efficiency values are more concentrated in Beijing, Guangdong, and other provinces in the eastern region. Moreover, provinces with lower efficiency values are mostly in the middle. In the western region, Inner Mongolia has the lowest index efficiency of industrial waste gas emissions and energy consumption. For the incidence of tuberculosis, most provinces have high-efficiency scores. Only Xinjiang and Guizhou have efficiency values below 0.9. These two provinces also have low pollutant discharge efficiency.
Results and Discussion
Conclusions and Policy Suggestions
Conclusions
(1) On the whole, there is room for improvement in the HPE in various provinces in China, with evident regional differences. During the study period, HPE values of most provinces in China showed a trend of continuous growth or fluctuating upward trend, indicating that HPE of China’s industry and agriculture tends to improve. This case is because, since the Fifth Plenary Session of the 18th CPC Central Committee, the Party and the government have attached great importance to issues such as industrial development, environmental governance, and residents’ health. Only Beijing, Fujian, Zhejiang, and Ningxia were at the forefront of efficiency during the study period, and more than 60% of the provinces had a comprehensive efficiency value below 0.8. The provinces with lower HPE are more located in the central and western regions, and the average efficiency of the eastern region is better than that of the central and western regions. This case may be caused by the differences in geographical features (Beijing, Zhejiang, Shanghai, Fujian, and others), economic development (Gansu, Heilongjiang, Guangxi, Qinghai, and others), and resource endowments (Ningxia, Shanxi, and others).
Table 4.
HE of 30 Provinces in China from 2016 to 2020.
(2) From the geographical division perspective, comprehensive efficiency, APE, and HE have similar geographical characteristics, showing a stepped distribution in the east > west > central, whereas the IPE is a trend distribution in the east > central > west. The task of improving IPE in the western region is relatively arduous, whereas the central region is faced with the dual tasks of improving industrial and APE and HE. The focus and difficulty of HPE lie in the central and western regions. The provinces with higher efficiency values at each stage are more concentrated in the eastern region, whereas the lower provinces are mostly located in the central and western regions.
(3) In terms of stages, the APE and IPE values in the parallel stage are generally lower than the HE values in the second stage. Moreover, there is much room for improvement in APE and IPE. The utilization efficiency of health input in various provinces is relatively high, but the reflection of APE and IPE is not optimistic. The focus should be on improving APE and HE. In view of the long-term differences in the development of agriculture, industry, and health in various provinces, the input–output efficiency at each stage is significantly different. In different stages, except for the provinces that have been on the frontier, other provinces have certain room for improvement. In addition, in the combination of industrial and APE values, provinces in the “low–low” type should target the “high–high” type provinces to gradually improve the efficiency of resource utilization.
(4) The efficiency of pollutant discharge shows that China’s environmental control policies have achieved good results. However, environmental problems in some provinces are still serious. Provinces with low energy consumption efficiency also have low-efficiency values for industrial exhaust emissions. Combined with China’s current energy utilization status, the emission of industrial pollutants is greatly affected by energy utilization, and 60% of the provincial energy consumption efficiency values are less than 1, indicating that China’s current technical level of pollutant emission control needs to be further improved. During the study period, more than 50% of the provincial and local financial medical and health expenditure efficiency indicators did not reach the efficiency frontier. Areas with higher efficiency values of pollutant discharge indicators also have higher TB incidence efficiency values.
Table 5.
The average value of key indicators efficiency.
Policy Suggestions
(1) Coordinate and promote a regionally coordinated, high-quality development. On the one hand, to get rid of the blocking points that restrict the reasonable flow of resource elements and promote relative balance in development, each region should fully grasp its own regional conditions and specifically consider economic development, population density, industrial layout, energy endowment, environmental bearing, water source, health level, and other factors. On the basis of absorbing the development experience of regions at the forefront of efficiency, each region should formulate differentiated development strategies, maximize their own comparative advantages, narrow regional gaps, and promote coordinated and sustainable development among regions. On the other hand, to promote the smooth flow of resource elements, each province should break down administrative barriers, establish a comprehensive coordination agency, provide a new platform for regional cooperation on different themes, promote healthy interaction between regions, and continuously promote relative balance and stability in development. Regional coordination promotes the formation of a regional economic layout with complementary advantages and high-quality development.
(2) Collaborate to promote ecological environment protection and economic development. Significant changes have taken place in the development stage, development environment, and development conditions of China’s economy. In the new era, industrial and agricultural production must achieve sustainable and healthy economic development on the basis of significantly improved quality and efficiency and promote balanced development of ecological construction and economic development. On the one hand, each province should adhere to the “win– win” road of industrial and agricultural development and ecological and environmental protection. On the basis of natural resource conditions and the environmental carrying capacity of each province, while improving the comprehensive benefits of industry and agriculture, each province should deeply fight the battle of pollution prevention and control strengthen agricultural water conservation and efficiency, and industrial water-saving and emission reduction. Each province must strictly control pollutant discharge and realize green and low-carbon production methods. On the other hand, each province should adhere to innovation-driven development; accelerate the innovation, R&D, and application of advanced industrial and agricultural production technologies; update production and pollution facilities; promote clean, low-carbon, safe, and efficient use of energy; comprehensively create new advantages for development; and promote high-quality development of the industrial and agricultural economy.
(3) Take multiple measures to improve the health of residents. First, every province should speed up the expansion of high-quality medical resources and a balanced regional distribution, rationally allocate medical and industrial and agricultural production resources, improve resource utilization efficiency, increase local financial, medical, and health expenditures, develop green industries to reduce pollutant emissions and promote long-term optimization of health investment. Second, according to the DEA effectiveness principle, provinces with low HE should learn from the advanced experience of the frontier provinces, provide residents with a full range of life-cycle health services according to local conditions, improve health equity, and widely form green production and life. Third, we should innovate the medical-prevention coordination mechanism, attach importance to reforming the disease prevention and control system, and strengthen functions, such as monitoring and early warning, risk assessment, epidemiological investigation, inspection and testing, and emergency response. Finally, to improve the quality and efficiency of medical care, every province must strengthen the construction of medical and health teams and respond to the construction of a healthy China.
Limitations and Future Research Directions
This paper attempts to explore the linkages between agricultural and industrial economic development, environmental pollution, resource utilization and population health in China through a novel DEA approach. The research in this paper makes a useful addition to the established literature. However, there are still some limitations that can be added and extended in the future. Specifically, some indicators that are more closely related to residents’ health, such as respiratory diseases and digestive diseases, are not easily accessible. They can only be collated with reference to previous research results. In the future, we may be able to obtain more accurate data by conducting extensive research. In addition, in future studies, we can extend the time period of the study and combine machine learning methods to make predictions in order to comprehensively analyze the dynamic changes of HPE in China before and after the 14th Five-Year Plan. Finally, future research can also combine traditional econometric methods to deeply explore the external factors affecting HPE.

