

Introduction
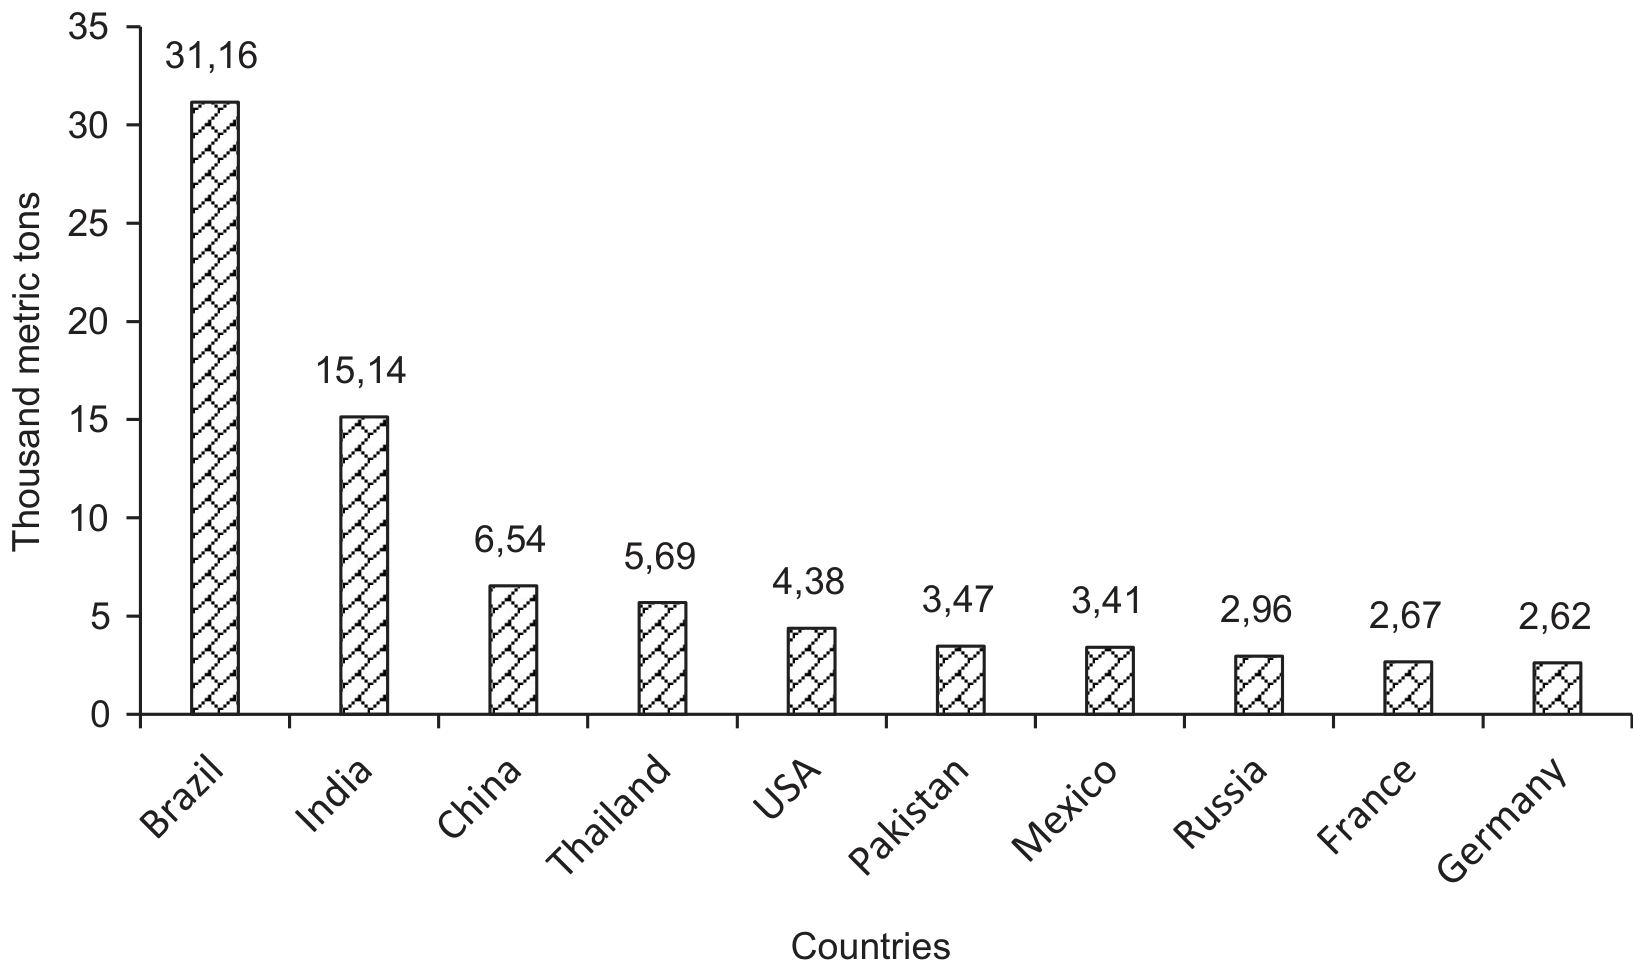
In Brazil’s 2019/2020 season alone, it’s estimated that approximately 646 million tons of sugarcane were harvested, potentially yielding up to 4 million tons of SCB [1]. As illustrated in Fig. 1, Brazil and India were the leading producers of sugarcane bagasse in 2020, together accounting for 46.3% of the global production volume [2]. In 2014, Egypt produced around 4.8 million tons of sugarcane waste [3]. Bagasse, the fibrous byproduct remaining after sugarcane is crushed to extract its juice, makes up roughly 30% of the wet weight of the cane [4]. One promising avenue for utilizing bagasse is its incorporation into clay bricks, a practice that not only improves brick performance but also reduces by-products. This method offers a cost-effective alternative to open-air burning. Additionally, the thermal energy produced from burning SCB can be utilized in brick manufacturing, with gas emissions being filtered and incorporated into the production process [5]. Wheat is a key crop for Egypt’s staple food production, covering approximately 32.6% of the nation’s winter farmland. Wheat straw, a renewable fiber source, is abundantly available worldwide and is largely underutilized despite its potential. Although some wheat straw is used annually for applications like cattle feed and energy production, most of it is wasted. Straw, similar to wood, can be considered a natural composite material composed of cellulose, hemicelluloses, and lignin [6]. Agricultural residues, such as bagasse ash, are generated in large quantities in various countries worldwide, including Brazil, South Africa, India, China, Cambodia, the Philippines, Indonesia, Thailand, and Pakistan [7].
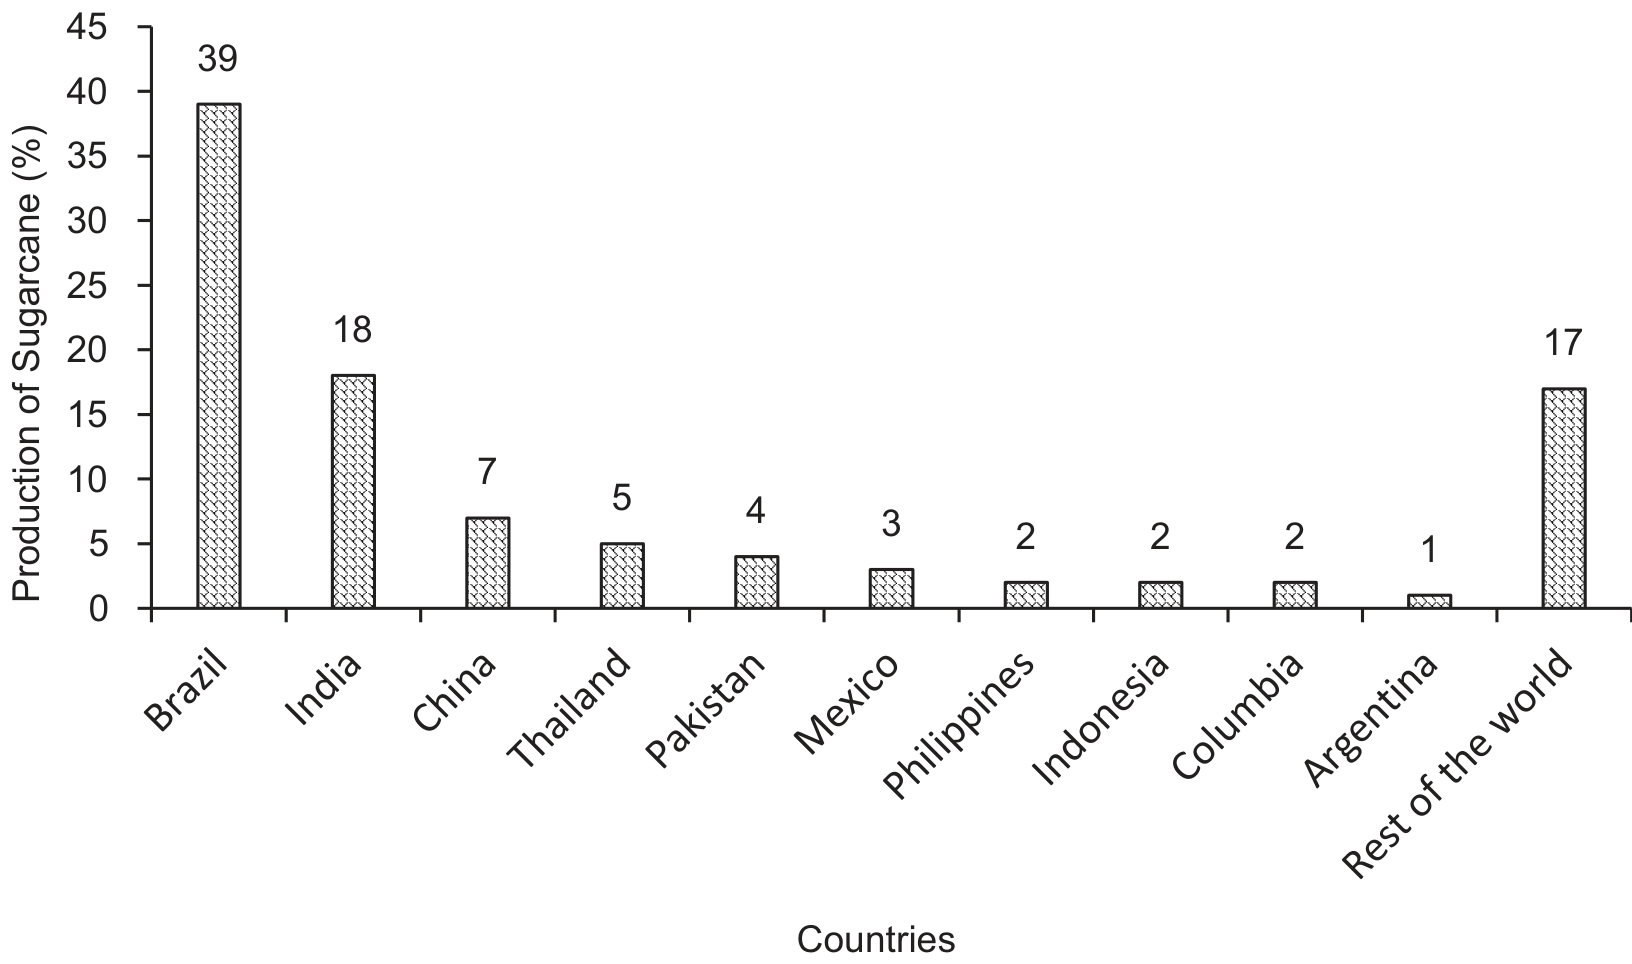
Sugarcane is one of the most extensively cultivated crops worldwide. India ranks second in sugarcane production after Brazil, producing approximately 350 million tons annually. Fig. 2 illustrates the production levels of sugarcane in major countries worldwide [8]. This study offers valuable insights into the sustainable utilization of SCB in comparison to conventional additives in asphalt.
Flexible pavement materials commonly use bituminous binders derived from the byproducts obtained during the refining of crude oil. Technological advancements in refining processes aim to maximize fuel production while minimizing asphalt residue [9]. However, petroleum, a non-renewable resource, is expected to deplete over time, leading to a decrease in the supply of petroleum asphalt. With the increasing demand for bituminous binders in road construction and a pressing need for environmental conservation, exploring alternative binders is essential to reduce dependence on petroleum asphalt and mitigate resource depletion [10]. The alternative binder is eco-friendly asphalt made from renewable sources [11]. Incorporating alternative binders, such as waste engine oil, vegetable oil, and other substances, either as modifiers or partial replacements for asphalt, offers a means to decrease reliance on petroleum-derived asphalt in pavement construction. Alternative binders derived from plant matter and residues possess chemical compositions similar to conventional asphalt [12]. BO components have similarities to the four primary compounds in petroleum asphalt: saturates, aromatics, resin, and asphaltenes [13].
Numerous publications have explored the use of bio-binder as a rejuvenator or modifier for asphalt. An innovative asphalt cement formulation incorporating petroleum asphalt, natural asphalt, vegetable oil, crumb rubber, and styrene-butadiene rubber has been developed. This blend exhibits low viscosity during application and transitions into a high-viscosity, durable, and resilient material upon curing on highways [12, 14]. Oils derived from sesame, sunflower, soybean, corn, palm, or peanut are utilized as asphalt rejuvenators, typically at concentrations ranging from 2–20% by mass of bitumen. Blending conventional penetration grade bitumen with these oils can modify the binder’s viscosity to achieve desired performance grades. These rejuvenators can be applied using both ex-situ and in-situ methods for asphalt restoration [15]. The sealant composition combines soy and other vegetable products with a mixture of soy derivatives and asphalt [16]. Additionally, special rejuvenating agents for recycling contain blends of 10– 90% palm oil and 90-10% asphalt. These are used in hot asphalt pavement recycling, done on-site (hot-in-place) or at a mixing plant (hot in-plant), with the former occurring directly on the road and the latter involving transport to a plant [17].
Evaluating technologies to optimize industrial processes is important for saving energy and understanding economic and environmental impacts. This evaluation is essential for the future of sugarcane bio refineries and helps make strategic decisions [18–22]. The environmental results from the LCA show that the optimization technologies examined in this study have substantial potential to decrease the environmental impacts of both existing and upcoming sugarcane bio refineries [23]. The methodology employed in this study facilitated the identification and comparison of technical, environmental, and economic aspects for optimizing a first-generation sugarcane bio refinery [23]. This research paper aims to explore various alternative binders that can replace fossil fuel-derived bituminous binders partially. It also investigates the economic and environmental aspects of SCB-BO.
Research Methodology
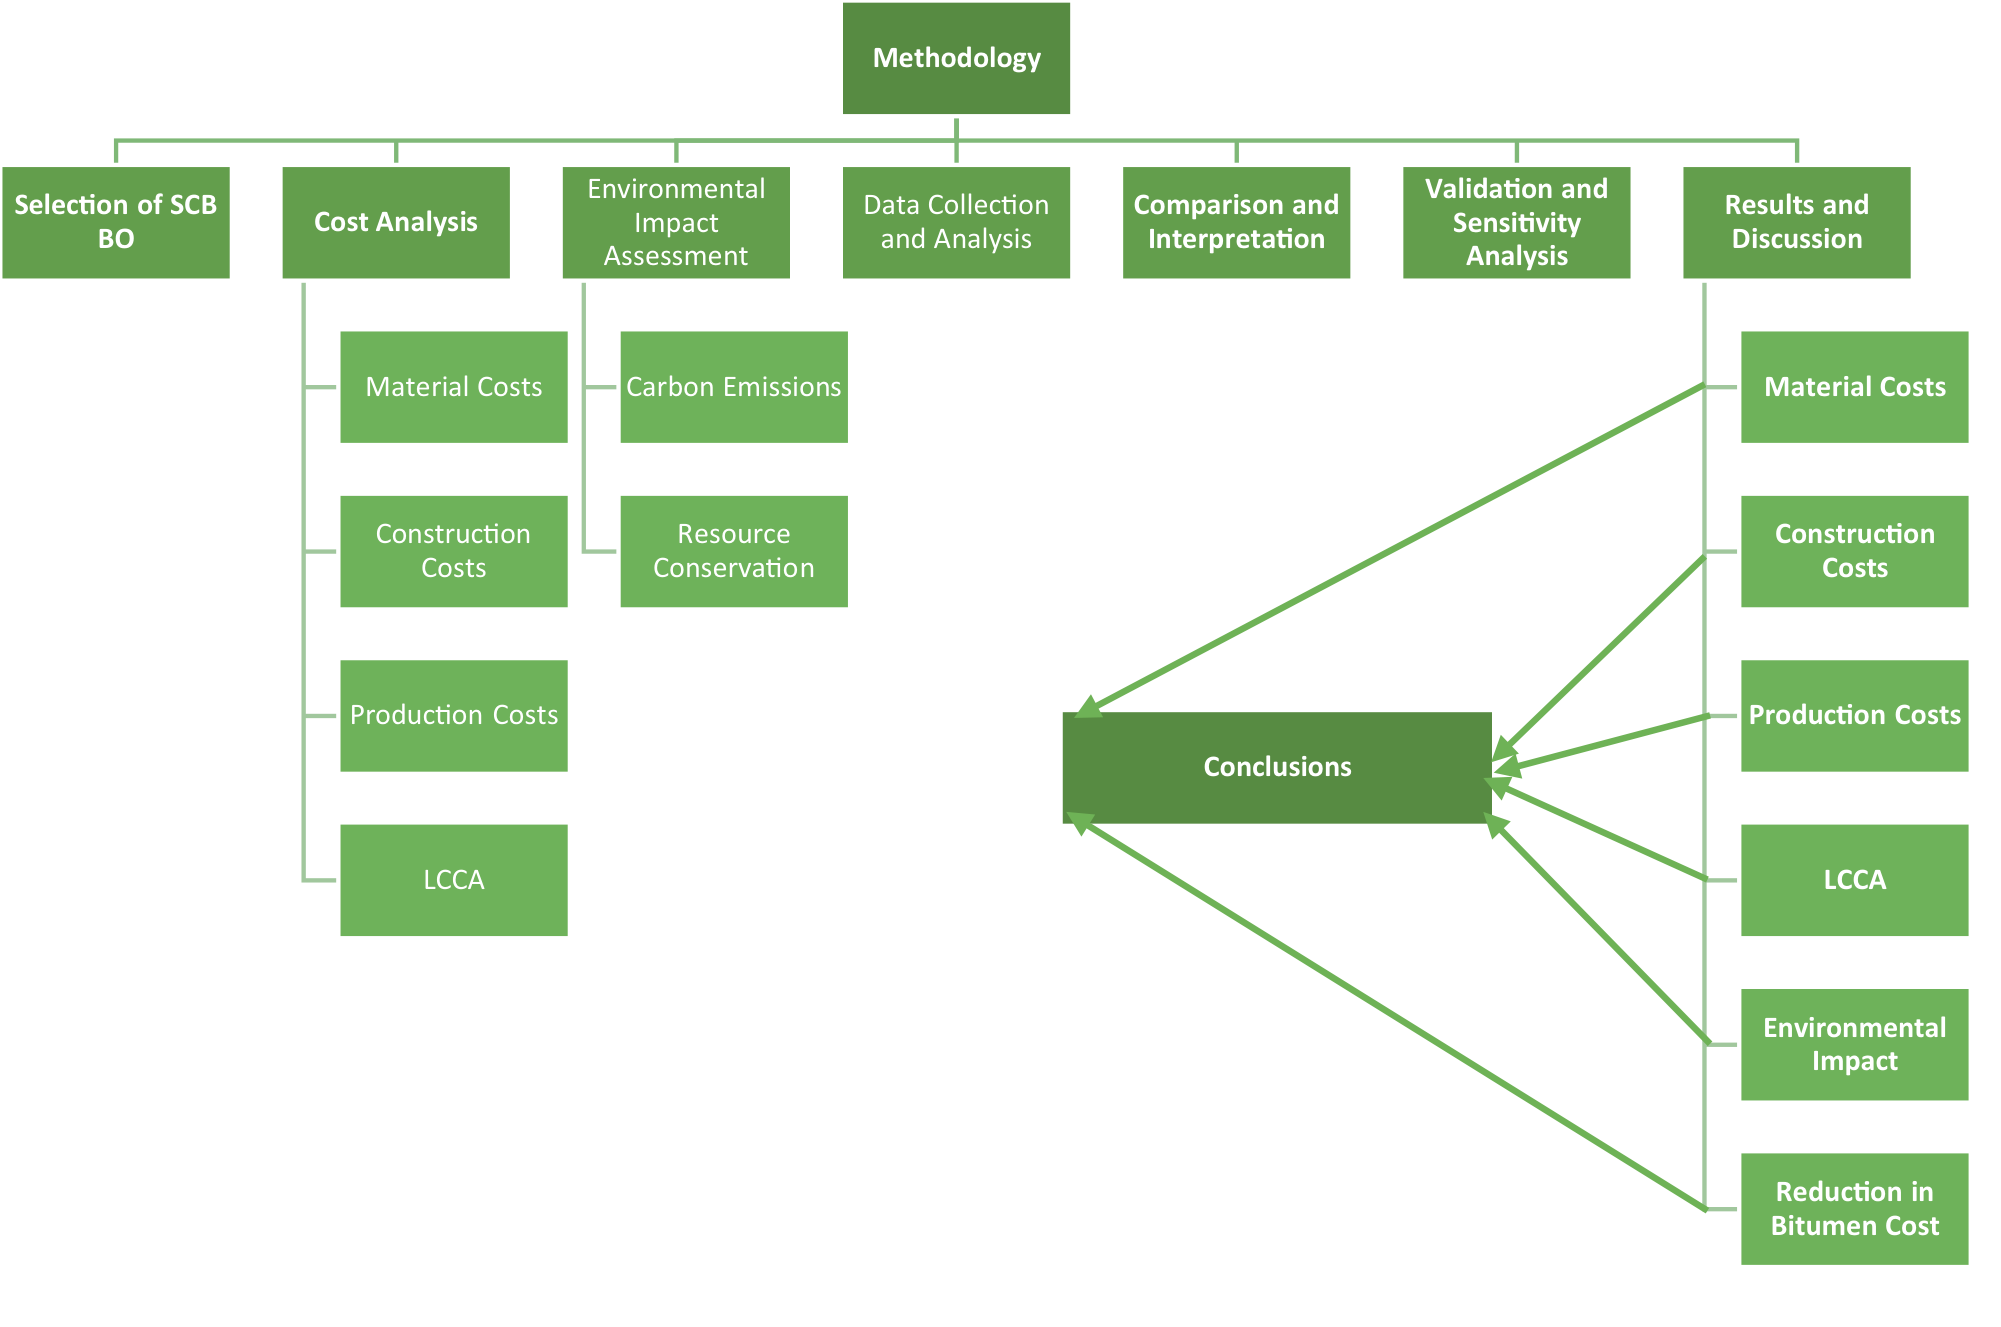
For every ton of sugarcane processed, around 0.28 tons of SCB are generated [24]. SCB is utilized as fuel in boilers, producing steam at temperatures ranging from 700 to 1000°C. The generated steam is subsequently used to drive turbines, thereby producing power for the plant’s operations [24]. Following combustion, approximately 8–10% of the material remains as residue, known as bagasse ash [25]. Improper disposal of bagasse ash results in significant environmental problems, such as air and water pollution. In India alone, approximately 15 million tons of sugarcane bagasse ash are generated annually. This ash is frequently thrown in open lands or close-by fields of agriculture, causing severe land and water contamination [25]. A comprehensive literature review was conducted to gather existing knowledge on the use of BO in asphalt pavements. This included studying previous research on SCB-BO, its properties, and its potential environmental and economic benefits. The review also covered LCCA methodologies and their application in assessing pavement projects. The methodology used in this study is shown in Fig. 3.
Selection of SCB-BO
In this study, SCB-BO was selected as a partial replacement for bitumen in asphalt mixtures. The selected replacement percentages were 0%, 3%, 6%, and 9%. These percentages represent the proportion of SCB-BO used in place of traditional bitumen. The goal was to evaluate the economic and environmental impacts of using SCB-BO in asphalt pavement construction, considering both the material and life cycle costs, as well as the environmental benefits.
Production of BO from SCB
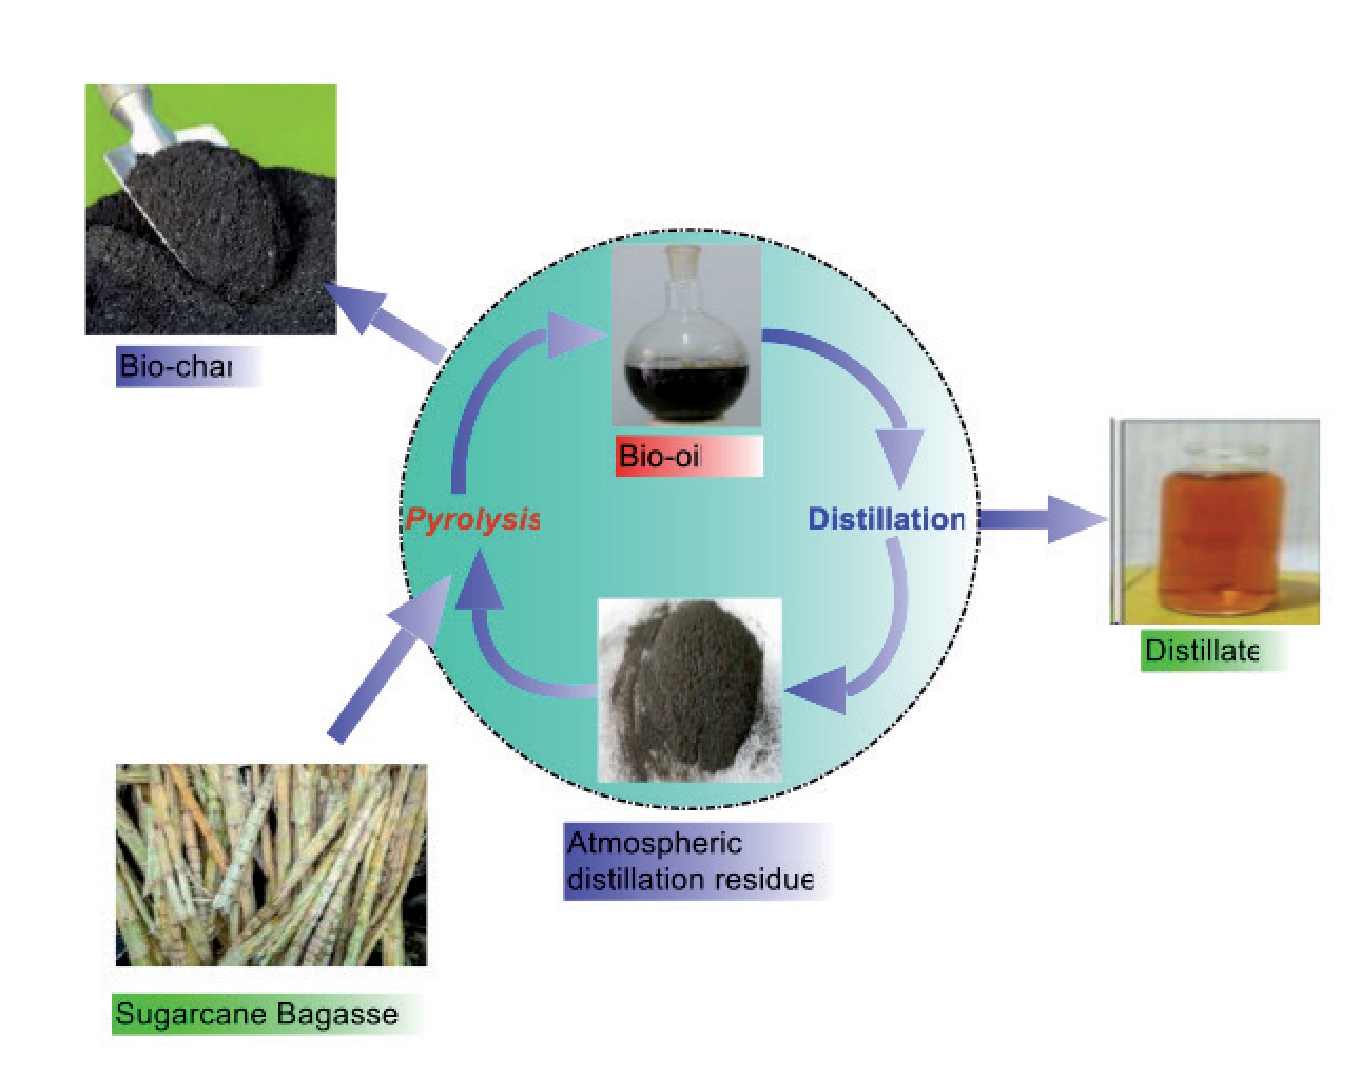
The production of bio-oil from SCB involves a process known as fast pyrolysis, as illustrated in Fig. 4. Fast pyrolysis is a thermal decomposition process that occurs in the absence of oxygen, rapidly heating the biomass to temperatures between 450°C and 600°C. During this process, the SCB is converted into BO, along with other by-products such as biochar and syngas.
Cost Analysis
Material Costs: The material costs were determined by calculating the expenses associated with acquiring BO and bitumen. The cost per ton of bitumen and SCB, as well as any additional processing costs, were considered. The asphalt cost per ton is shown in Fig. 5.
Asphalt Cost per Square Foot
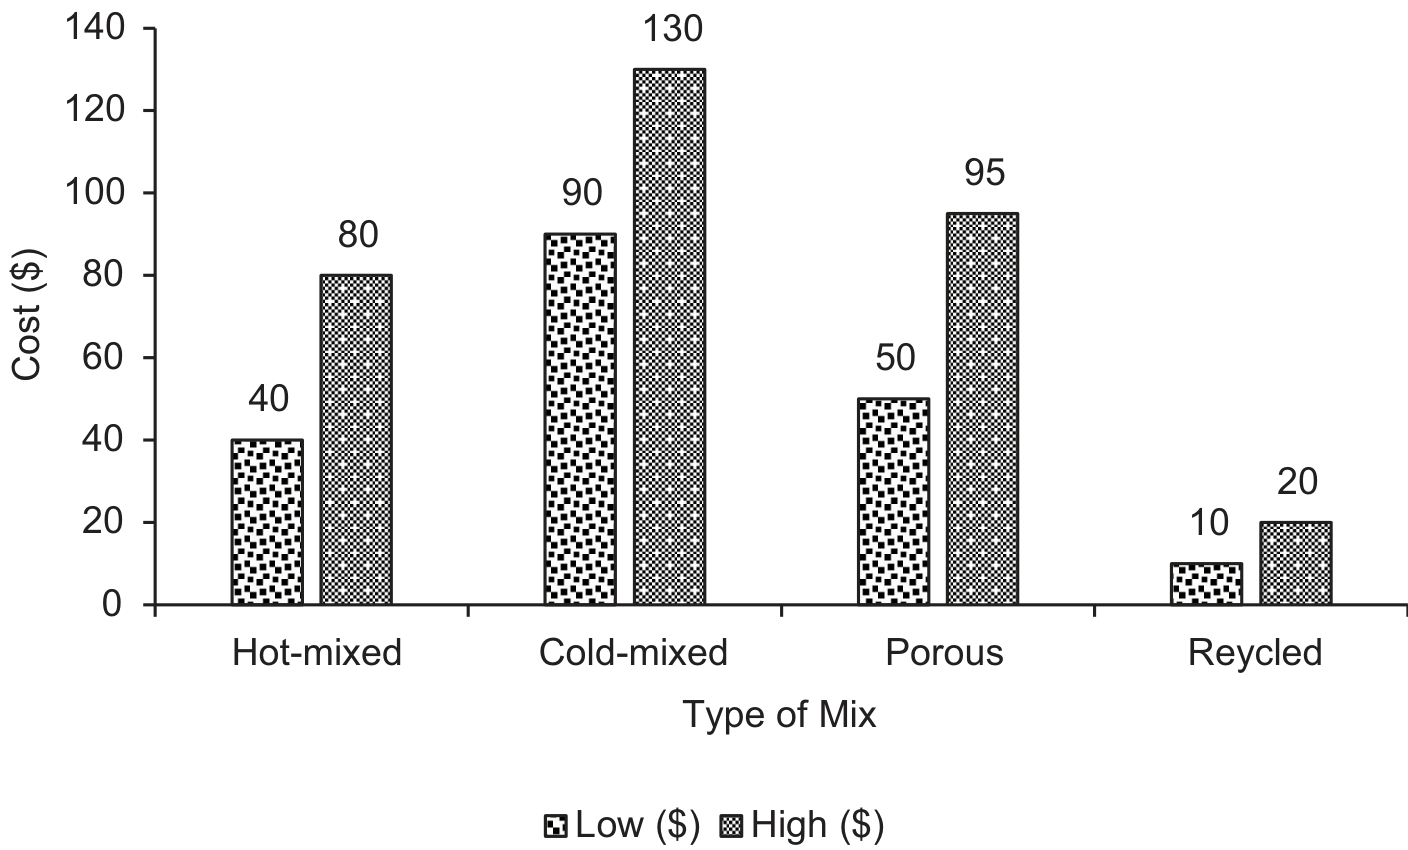
Asphalt costs $0.75 to $2.00 per square foot when spread 3” to 5” thick. A ton of asphalt covers 30 to 80 square feet. An average 2-car driveway requires 10 to 18 tons of asphalt, costing $600 to $1,100 for asphalt materials or $1,700 to $4,000 including installation [27]. The asphalt cost per square foot is shown in Table 1.
Construction Costs: The construction costs encompassed expenses related to the installation of asphalt pavement. This includes the cost of labor, equipment, and other construction materials required for laying the asphalt mixture. The cost of constructing an asphalt driveway varies with the region and the project specifications. Different types of asphalt and their cost per unit are mentioned in Table 2 below [28].
Production Costs: Production costs were evaluated based on the manufacturing processes involved in producing asphalt mixtures with BO. This includes expenses associated with mixing, heating, and transporting the asphalt mixtures to construction sites.
Life Cycle Cost Analysis
LCCA involved assessing the total costs associated with asphalt pavement over its entire life cycle, including construction, maintenance, and rehabilitation. Discounted cash flow analysis was used to account for the time value of money with a predetermined discount rate.
Environmental Impact Assessment
The carbon emissions associated with SCB-BO and traditional asphalt mixtures were estimated. This involved calculating the CO2 emissions generated during the production, transportation, and installation of asphalt pavements. Resource conservation considerations involved assessing the potential reduction in fossil fuel consumption and waste generation resulting from the incorporation of BO in asphalt mixtures.
Data Collection and Analysis
Data on material costs, construction practices, production processes, and environmental impacts were collected from industry sources, research publications, and government databases. Statistical analysis techniques, such as regression analysis and sensitivity analysis, were employed to analyze the data and identify significant factors influencing the economic and environmental performance of asphalt pavements with BO.
Comparison and Interpretation
The results of the cost analysis and environmental impact assessment were compared across different scenarios representing varying percentages of BO replacement in asphalt mixtures. The findings were interpreted to assess the economic viability, environmental sustainability, and potential benefits of incorporating BO in asphalt pavement construction.
Table 1.
Asphalt cost per square foot [27].
Table 2.
Different types of asphalt and their cost per unit [28].
Validation and Sensitivity Analysis
Sensitivity analysis was conducted to evaluate the robustness of the results and assess the impact of uncertain parameters on the outcomes of the study. The methodology and findings were validated through peer review, expert consultation, and comparison with existing literature and empirical data. By employing this comprehensive methodology, the study aims to provide valuable insights into the economic and environmental implications of utilizing BO in asphalt pavement construction, thereby contributing to the advancement of sustainable infrastructure development practices.
Results and Discussion
The economic and environmental analysis revealed significant insights into the incorporation of BO in asphalt pavement construction. The material costs, construction costs, production costs, and LCCA were assessed across varying percentages of BO replacement for bitumen, including 0%, 3%, 6%, and 9%.
Material Costs
Material costs exhibited a direct relationship with the percentage of BO replacement. As the proportion of BO increased, the material costs also increased proportionally. This was attributed to the additional expenses associated with acquiring and processing sugar cane bagasse. To calculate the material costs for using 0%, 3%, 6%, and 9% BO as a partial replacement of bitumen, we need to consider the cost of bitumen and BO for each percentage of replacement. The cost of bitumen per ton is $365, and the cost of SCB BO per ton is $145. For 1 kilometer of road, 10 metric tons of bitumen are required.
Material Cost for Bitumen: The material cost for bitumen is calculated using the formula:
Material Cost for SCB BO: The material cost for SCB BO is calculated using the formula:
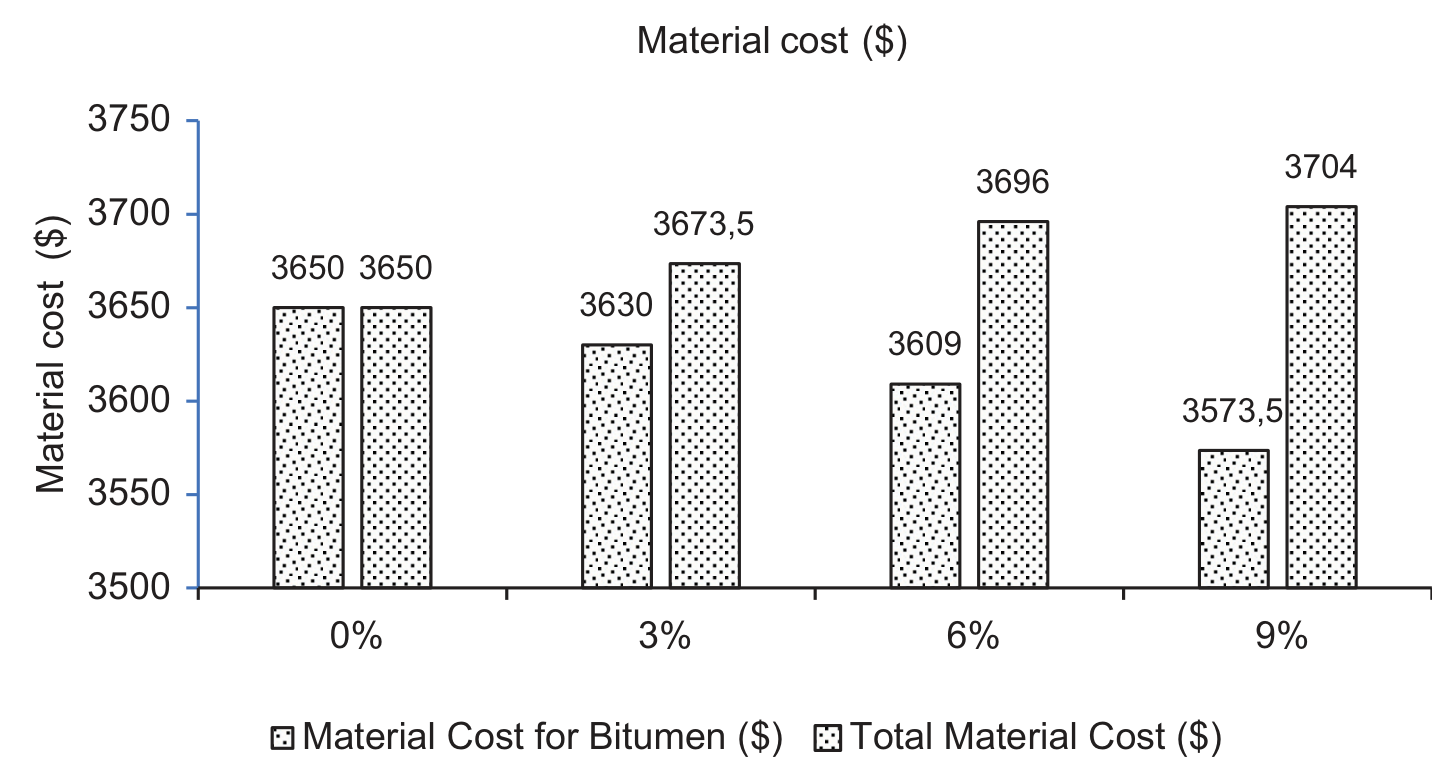
Total Material Cost: The total material cost is calculated using the formula:
Fig. 6 summarizes the material costs for different percentages of BO used as a replacement for bitumen in the construction of roads. These calculations provide the material costs for using 0%, 3%, 6%, and 9% BO as a partial replacement of bitumen in asphalt mixtures for 1 km of road. The material cost per bitumen is shown in Fig. 6.
Construction Costs
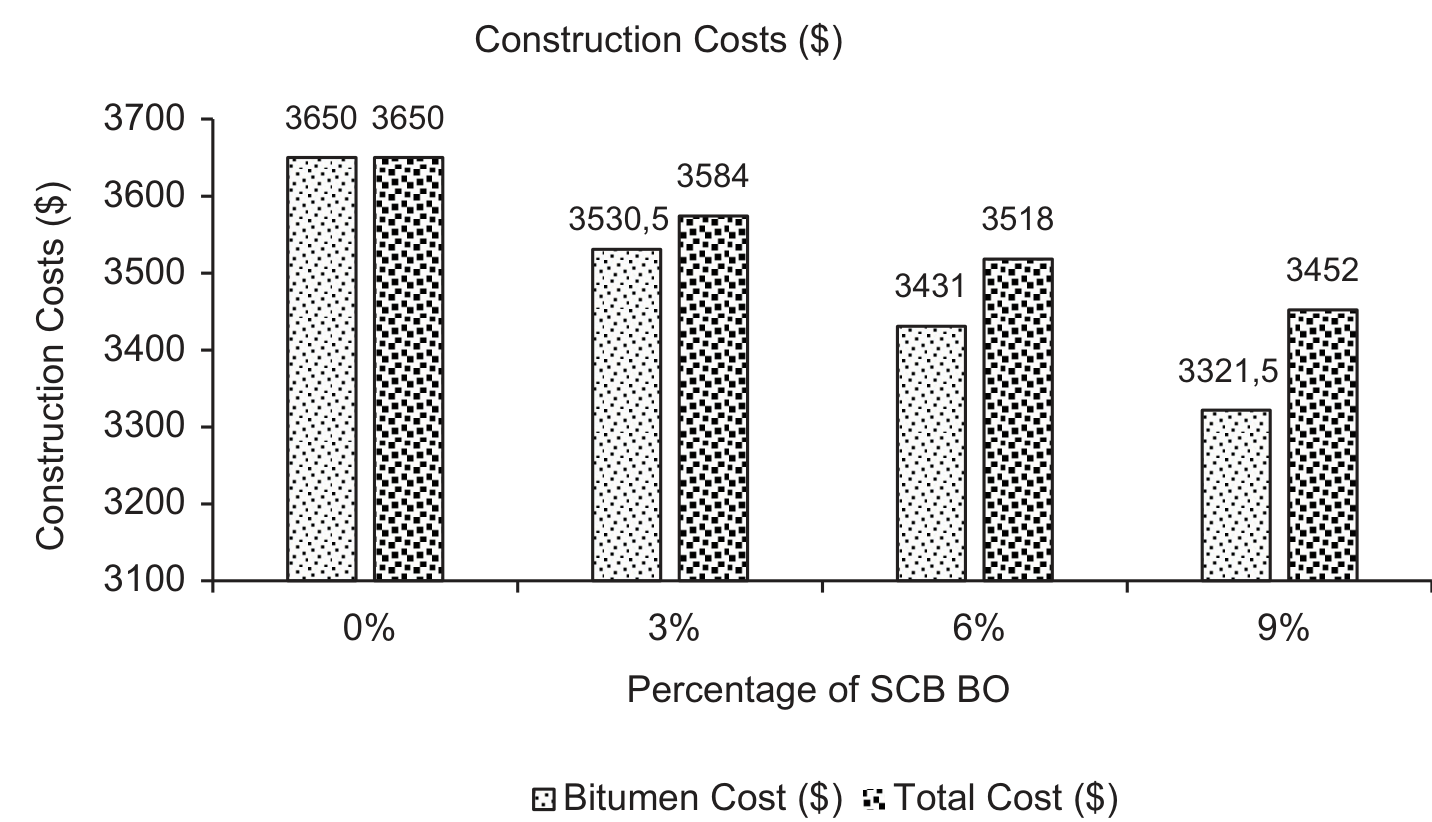
Construction costs demonstrated higher percentages of BO replacement leading to decreased construction expenses. The need for specialized equipment and modified construction techniques contributed to the costs associated with asphalt mixtures containing BO. Fig. 7 summarizes the purpose of the plot, indicating that it illustrates how construction costs vary depending on the percentage of BO replacement in the asphalt mixtures. Construction costs can be calculated by using the following formula:
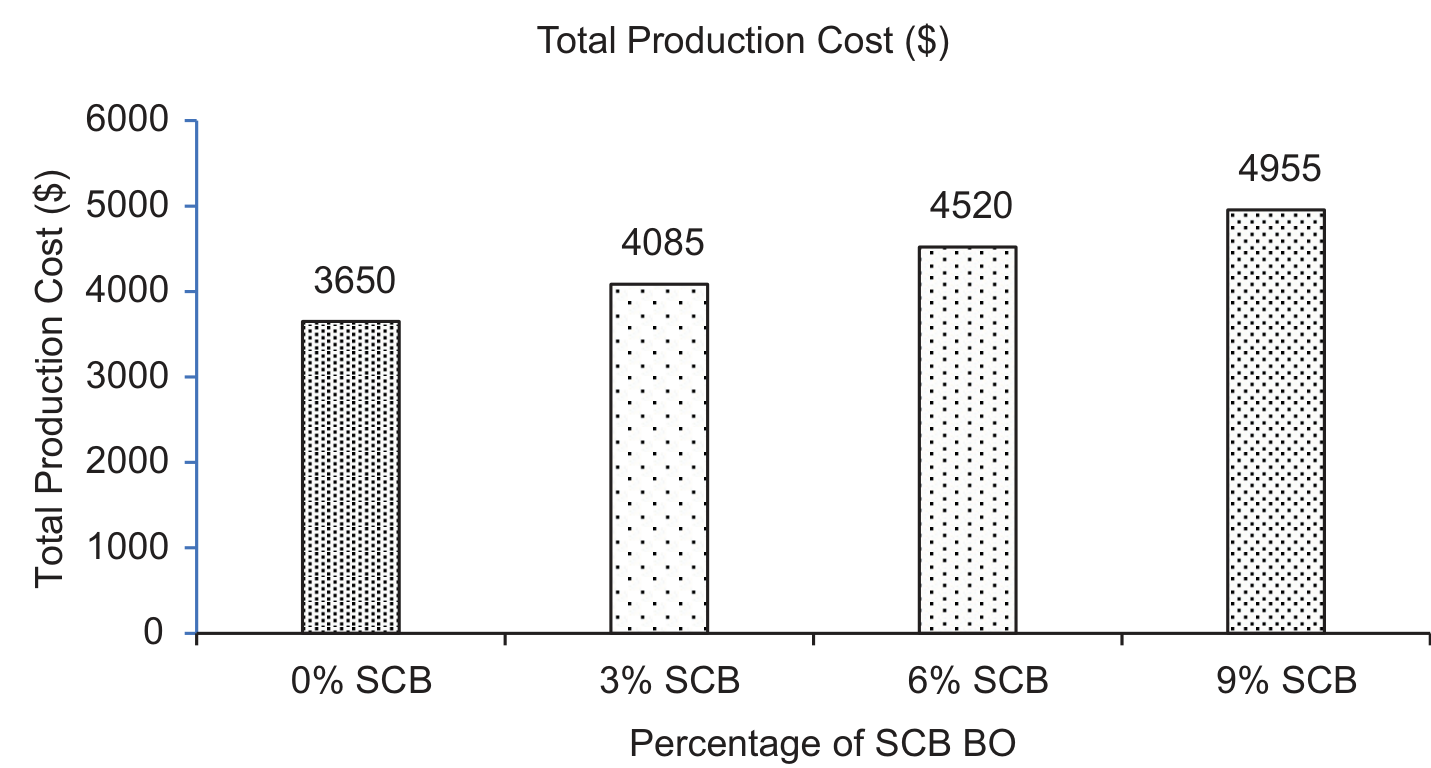
Fig. 7 provides a clear comparison of the construction costs associated with different levels of BO replacement. The table illustrates that increasing the percentage of BO replacement leads to a reduction in the total construction costs for 1 km of road. This indicates potential cost savings by using BO additives in road construction, making it an economically viable and environmentally friendly alternative.
Production Costs
Production costs mirrored the trends observed in material and construction costs, showing an upward trajectory with increasing percentages of BO replacement. The additional processing requirements and adjustments in production processes contributed to the escalated production expenses. These calculations show that the production costs increase for all percentages of BO replacement, as the manufacturing processes involved do not vary based on the amount of replacement. Incorporating the four percentages of BO – 0%, 3%, 6%, and 9% – into asphalt mixtures presents a unique opportunity to examine their effects on production costs. As the percentage of BO replacement increases, the production expenses increase. However, it’s essential to assess whether these variations align with the anticipated trends observed in material and construction costs.
Initially, production costs rise in tandem with the increasing percentage of BO replacement. This escalation can be attributed to the additional processing requirements necessitated by incorporating bio-based additives into the asphalt mixture. These processing demands may include refining procedures, adjustments in manufacturing equipment, and potential increases in energy consumption during production. By evaluating the production costs associated with each percentage of BO replacement, we can gain insights into the efficiency and feasibility of incorporating bio-based additives into asphalt production. These insights will inform decision-making processes regarding the optimal utilization of BO additives in asphalt mixtures, balancing economic considerations with environmental sustainability objectives. Fig. 8 shows the breakdown of production costs for each scenario, including the cost of bitumen, the cost of BO (where applicable), and the total production cost.
Life Cycle Cost Analysis
LCCA encompassed the evaluation of total costs incurred over the entire life cycle of asphalt pavements, including construction, maintenance, and rehabilitation. The analysis indicated that while upfront material and construction costs were higher for asphalt mixtures with higher percentages of BO, the long-term savings resulting from reduced maintenance and rehabilitation requirements offset these initial expenses. These calculations indicate that the LCCA decreases for all percentages of BO replacement, as it represents the total cost associated with the entire life cycle of the road infrastructure and is affected by the amount of replacement.
The implementation of green lost circulation materials (LCM) as an alternative to existing commercial LCM involves using sugarcane bagasse waste. With sugarcane cultivation being widespread across more than 110 countries, the global production of sugarcane is substantial, representing about 22.4% of total world agricultural production by weight. This abundance of sugarcane creates a significant opportunity to explore projects that utilize sugarcane bagasse waste effectively, particularly in the development of sustainable solutions such as green LCM for mitigating lost circulation in drilling operations [29].
Commercially available LCM consists of various materials, including fibrous materials like raw cotton and wood fiber, as well as flake-type materials such as mica and cottonseed, which can pose environmental risks when disposed of in the sea due to their toxicity to aquatic creatures. Limestone (CaCO3) is a prevalent LCM in drilling fluids but has drawbacks in terms of cost and environmental impact. Therefore, there is a need to develop green LCM solutions that are environmentally friendly and cost-effective. By implementing green LCM, we aim to reduce drilling operation costs and enhance well integrity, contributing to more sustainable drilling practices [29].
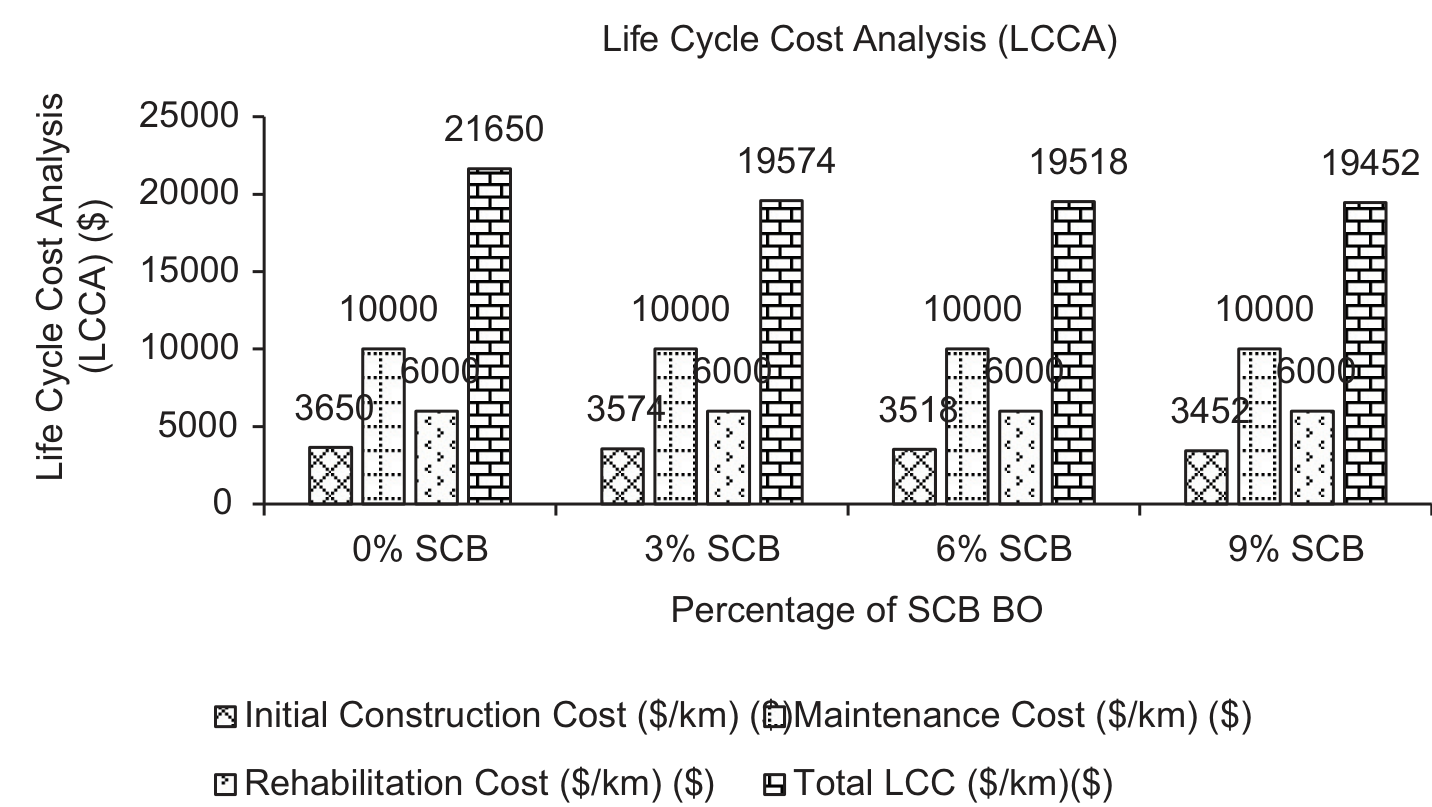
To perform the LCCA, we’ll calculate the total cost over the entire life cycle of the road for each scenario. The LCCA includes not only the initial construction costs but also the costs associated with maintenance and rehabilitation over the expected lifespan of the road. Given the initial construction costs calculated previously and assuming a lifespan of 20 years for the road, we’ll incorporate maintenance and rehabilitation costs into the analysis. The total initial construction cost for 1 kilometer of road varies depending on the percentage of BO replacement. For no replacement (0%), the cost is $3650 per kilometer. When 3% of the bitumen is replaced with BO, the cost decreases to $3584 per kilometer. A 6% replacement results in a further reduction, bringing the cost to $3518 per kilometer. The lowest cost is observed with a 9% replacement, amounting to $3452 per kilometer.
Maintenance and Rehabilitation Costs: Assuming an average annual maintenance cost of $500/km and rehabilitation cost of $3000/km over a lifespan of 20 years:
(assuming every 10 years)
Total LCC: The LCC can be calculated by using Eq.8.
These calculations provide the LCC for each scenario, incorporating both initial construction costs and ongoing maintenance and rehabilitation expenses over the expected lifespan of the road. Fig. 9 summarizes the initial construction cost, maintenance cost, rehabilitation cost, and total LCC for each scenario, based on the provided calculations and assumptions.
Environmental Impact
Environmental assessments revealed promising reductions in carbon emissions associated with the use of BO in asphalt pavements. By substituting a portion of bitumen with renewable BO, the carbon footprint of asphalt production and construction activities could be substantially reduced, contributing to environmental sustainability goals. To evaluate the environmental impact, we’ll consider factors such as carbon emissions and resource conservation associated with incorporating BO in asphalt mixtures. The formula for calculating the carbon emissions reduction based on the percentage of BO replacement is:
(9)
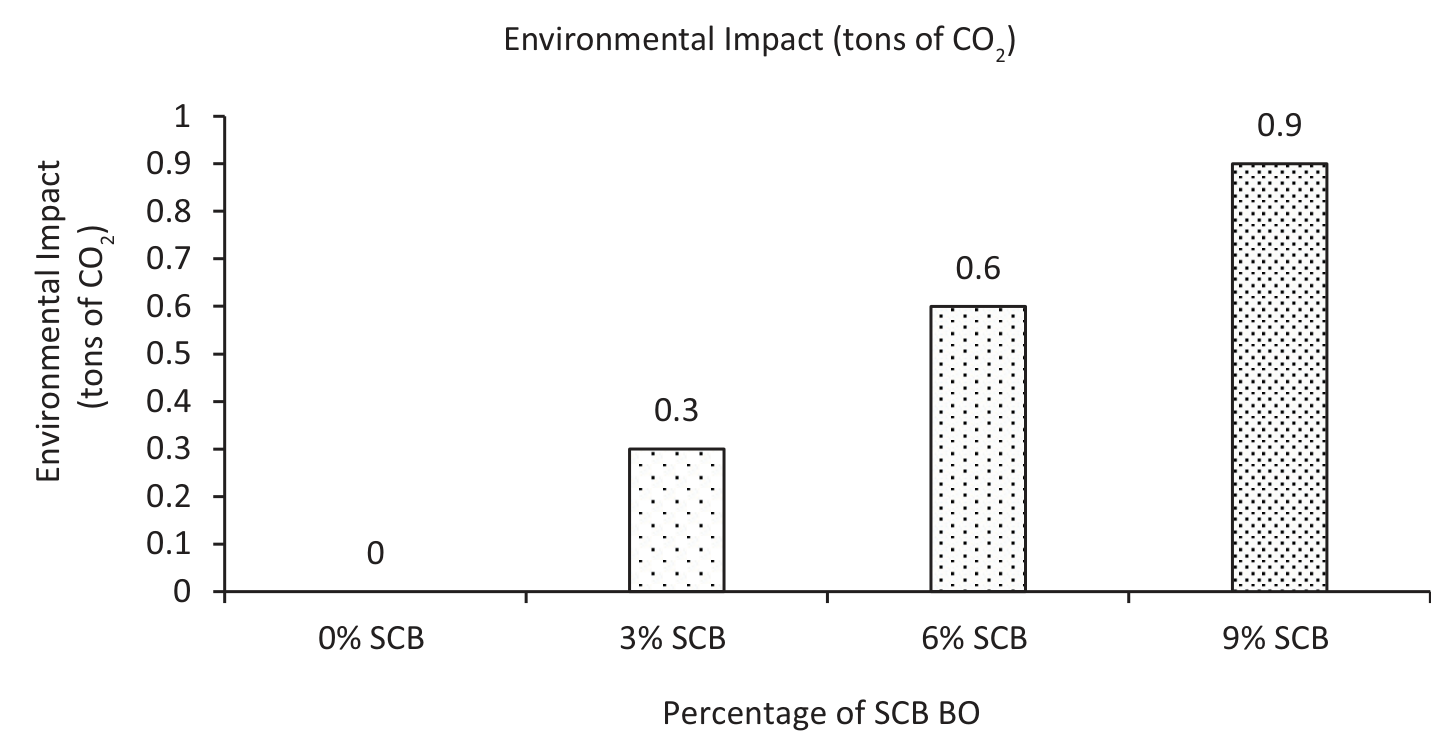
Where: Net carbon emissions reduction per km is 10 tons of CO2. The percentage of BO replacement is the specific percentage used (e.g., 3%, 6%, 9%).
Fig. 10 summarizes the carbon emissions reduction associated with different percentages of BO replacement in asphalt mixtures for road construction. These calculations show the reduction in carbon emissions associated with each percentage of BO replacement. The higher the percentage of replacement, the greater the reduction in carbon emissions, contributing to environmental sustainability. The environmental sustainability is shown in Fig. 10.
Reduction in Bitumen Cost
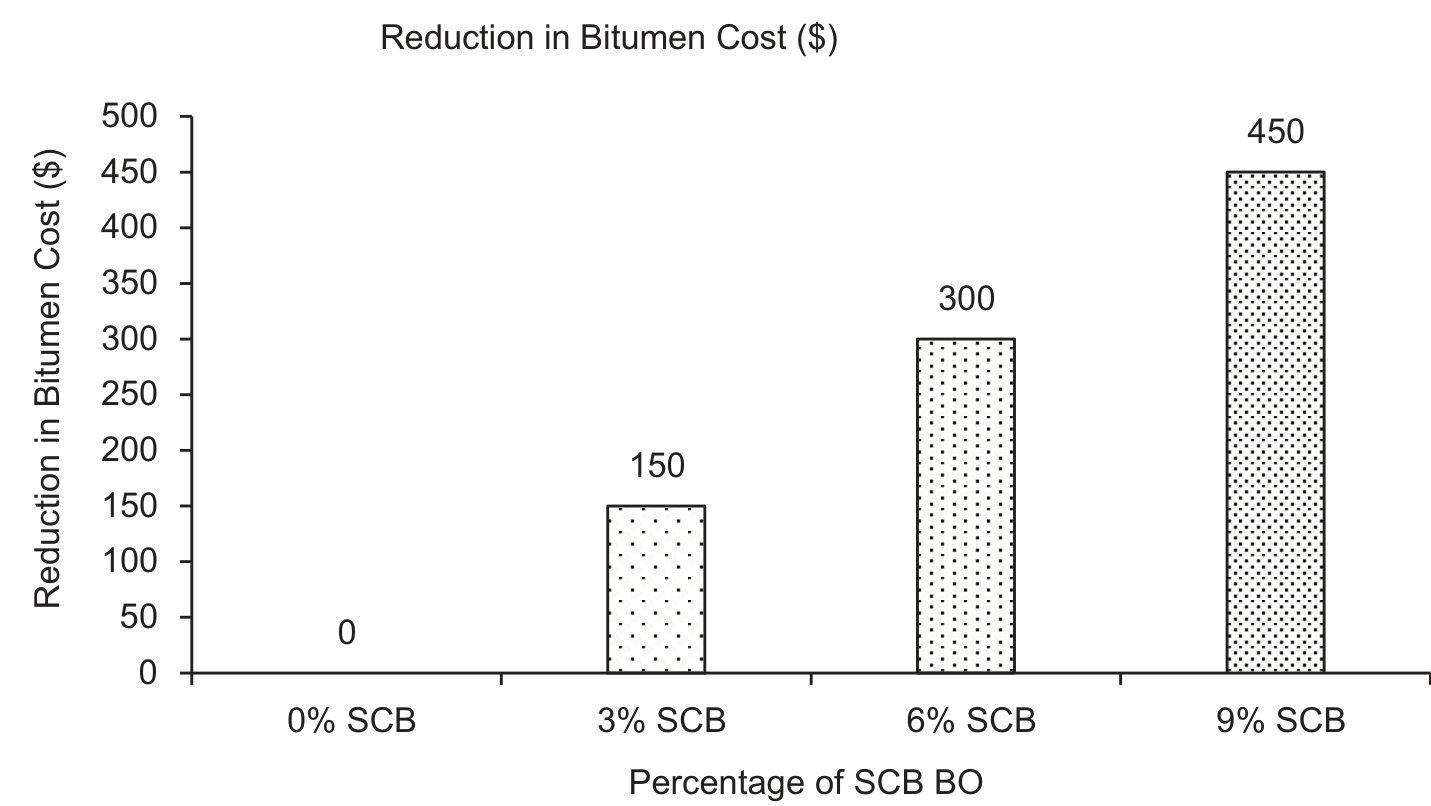
The reduction in bitumen cost for each percentage of BO (0%, 3%, 6%, and 9%) is based on a total quantity of 10 metric tons of bitumen required for 1 km of road. No replacement of bitumen, so no reduction in bitumen cost. The reduction in bitumen cost can be calculated by using Eq.10.
Fig. 11 summarizes the amount of bitumen replaced and the corresponding reduction in bitumen cost for different percentages of BO used in road construction. These calculations provide an estimate of the potential cost savings in bitumen expenses for different percentages of BO incorporated into asphalt mixtures for 1 km of road with 10 metric tons of bitumen. The reduction in bitumen cost is shown in Fig. 11.
Discussion
The findings underscored the potential economic and environmental benefits of integrating BO into asphalt pavement construction. While initial costs may be higher due to the need for specialized processing and equipment, the long-term advantages, including reduced maintenance expenses and environmental impact, justify the investment in sustainable asphalt mixtures. Moreover, the use of renewable and locally sourced materials like SCB aligns with sustainability objectives and promotes circular economy principles in infrastructure development. The result has met the objectives of the research by using sugarcane bagasse. Sugarcane bagasse also practices economics besides avoiding any hazardous effects on humans [29]. Overall, the study's results confirm the feasibility and benefits of incorporating BO into asphalt pavements. This approach offers a promising solution for improving the sustainability and durability of transportation infrastructure while reducing its environmental impact.
Conclusions
Overall, these conclusions highlight the cost implications and environmental benefits of using BO as a partial replacement for bitumen in asphalt mixtures for road construction. The economic and environmental analysis of incorporating BO in asphalt pavement construction presents compelling findings regarding the feasibility and sustainability of this approach. Through comprehensive assessments of material costs, construction costs, production costs, and LCCA, along with considerations of environmental impact, several key conclusions can be drawn.
– The total material costs exhibit an upward trend with increased incorporation of BO, attributed to the additional expenses associated with sourcing and processing the BO.
– Construction costs demonstrate a decline, suggesting potential economic benefits of utilizing BO in road construction.
– Production costs increase in conjunction with higher percentages of BO substitution.
– The total life cycle cost of road infrastructure decreases as the proportion of BO in the mix rises.
– A higher replacement level of BO results in reduced carbon emissions, thereby enhancing the environmental sustainability of road construction.
– The use of BO as a partial substitute for bitumen leads to a reduction in bitumen costs, with more significant cost savings observed at higher replacement levels.
Future Recommendations
To maximize the economic and environmental benefits, it is recommended to incrementally increase the percentage of BO in road construction. This approach will optimize cost savings, enhance sustainability, and reduce carbon emissions throughout the lifecycle of the infrastructure.
Further Research
Additional studies should be conducted to explore the long-term performance and durability of asphalt pavements with SCB bio-oil.

