

Introduction
Sanitary landfills are commonly employed as the primary method for municipal waste disposal. When appropriately constructed and operated in adherence to laws and regulations, these landfills can effectively manage waste. However, it is important to acknowledge that even well-maintained landfills still carry inherent risks to the environment. Landfill leachates represent highly complex and heavily contaminated waters which are formed through a combination of factors, including stormwater infiltration, moisture present in the waste, and the process of waste biodegradation. They can contain various organic and inorganic impurities, of which the most attention is paid to hazardous and toxic substances [1]. The composition of leachate is influenced by various factors, with the most significant ones including the waste composition, landfill age, meteorological parameters such as temperature and precipitation, landfill depth, and waste treatment processes conducted prior to disposal [2, 3].
Addressing the issue of leachate from sanitary landfills is of utmost importance due to its profound and detrimental impact when released into the environment. In pursuit of a higher environmental standard and improved quality, it is imperative to collect leachate and transport it to a purification facility, where various treatment processes are employed. Only after meeting legal regulations and ensuring proper purification, can the treated leachate be safely reintroduced into nature [4]. It is worth noting that leachate continues to be generated within the landfill long after its closure, and these later-stage leachates tend to contain elevated concentrations of pollutants [5]. The quantity of leachate in landfills exhibits variability and relies on several key factors. One crucial aspect is the disposal and compaction of waste within the landfill cells. The degree of compaction directly influences the permeability of the waste to water, with well-compacted waste offering less permeability compared to loose waste. This compaction factor plays a pivotal role in determining the flow rate of leachate. Moreover, the presence of landfill covers serves to limit the infiltration of stormwater into the landfill body. These covers, in conjunction with factors such as precipitation levels, infiltration rates, surface flow, temperature, and evapotranspiration, directly impact the volume of leachate generated [6]. In addition, the composition of the waste, waste aging, waste characteristics, biochemical degradation processes, and other related factors also exert significant influence on the formation of leachate [7]. During the planning phase of constructing a sanitary landfill, it is crucial to calculate the volume of leachate as it helps estimate the dimensions of drainage pipes, collectors, and the necessary processing plant. The amount of leachate is influenced by seasonal variations and meteorological conditions [8]. One common approach for estimating leachate is through the calculation of evapotranspiration (ET), which can be obtained empirically using various methods. Meteorological data plays a significant role in modeling ET [9]. Moreover, potential (reference) evapotranspiration holds great importance within the hydrological cycle, particularly concerning hydraulic structures [10]. In 1959, P.E. Rijtema [11] discussed various methods for calculating potential evapotranspiration and highlighted six specific approaches, namely Lysimeter, Pan x red. Factor, Penman, Makkink, Turc, and Haude. Rijtema noted that although these methods required different parameters for calculations, the results obtained from each method did not exhibit significant differences. However, it is important to consider that the accuracy of all evapotranspiration calculation methods is contingent upon their application in the same climatic conditions for which they were originally developed [12].
The most common methods for calculating evapotranspiration are: the Thornthwaite method, established in 1948, based on the length of the canopy and the mean air temperature [13]. In 1961, Turcov established a method based on air temperature (T), solar radiation (Ig) and maximum monthly duration of sunbathing (H) [14]. The Blaney-Criddle formula, established in 1950, uses the average monthly temperature (Tm ºC) and the maximum daily insolation factor (p) as a percentage of the annual sum to estimate evapotranspiration [12]. Albrecht’s formula for calculating evapotranspiration was established in 1950 and involves the use of saturated vapor pressure (Es) and monthly mean vapor pressure (e). In 1952, Haudet’s formula for evapotranspiration was presented as the product of the proportionality factor for the annual day length (f) and the difference in saturation and water vapor pressure at 14 h (Es14, e14) [12].
Apart from the above, various modified equations adapted to different climatic regions and available parameters are used to calculate evapotranspiration. According to Zotarelli et al., the Penman formula from 1948 was modified by combining it with the Monteith method from 1965, and is widely represented as the Penman-Monteith equation [15]. Trajković [16] introduced a simple empirical formula for estimating reference evapotranspiration, which is a modified version of the Hargreaves formula from 1985.
Evapotranspiration is closely linked to temperature and precipitation, and its patterns are directly influenced by changes in these climatic factors. Particularly, during periods of drought, evapotranspiration undergoes significant alterations [17]. Precipitation strongly affects evapotranspiration. Some equations for calculating evapotranspiration directly include them, such as the Hargreaves equation modified by Allen 2003, which includes the monthly sum of precipitation [18]. Precipitation determines some other parameters on the basis of which evapotranspiration is calculated, such as water vapor content and soil water content [17]. Cui et al. also point out that rainfall intensity is very important for evapotranspiration because it determines surface runoff and evaporation [19]. Snyder et al. [20] corroborated the relationship between evapotranspiration and temperature, affirming its significance. However, they highlighted that other factors, such as wind speed and air humidity, also exert considerable influence on evapotranspiration. In a study conducted in Turkey, from October 2018 to September 2019, Kuzai et al. [21] confirmed that temperature and evapotranspiration are directly proportional. Their results show the highest evapotranspiration values in July (2018-191 mm/month; 2019-175 mm/month), when the temperature was also 7-8ºC higher than in the previous months. Haggag et al. [22] demonstrated the strong correlation between evapotranspiration and temperature in their extensive study spanning 46 years. Additionally, Haggag et al. [22] confirmed the compatibility between precipitation and evapotranspiration (ET), indicating a positive relationship, except during the summer months spanning from June to September. In a study conducted by Nastos et al. [23] in Greece, the assessment of reference evapotranspiration (ETo) in relation to global warming revealed compelling results. The study indicated a substantial projected increase in ETo, nearly doubling its current levels, as a consequence of global warming. These findings underscore the potential impacts of climate change on water loss processes, suggesting a significant intensification of evapotranspiration rates in the future. Chaouche et al. [24], in their research, did not observe a straightforward dependence of evapotranspiration (ET) solely on temperature. However, they employed the Penman-Monteith formula to calculate ET, which takes into account not only temperature but also relative humidity, solar radiation, and wind speed. Their findings emphasized that these additional factors, such as relative humidity, solar radiation, and wind speed, exhibited a significant influence on ET. Prăvălie [25] corroborated the previous research by highlighting the influence of multiple factors on evapotranspiration (ET), extending beyond air temperature alone. In their study, they noted that ET can be affected by anthropogenic factors as well. Using China as an example, Prăvălie pointed out that air pollution can lead to a reduction in daily sunlight duration, thereby impacting ET rates.
The goal of the research presented in this paper is to evaluate the production of leachate at the Savina Stena sanitary landfill by analyzing evapotranspiration, as well as to compare two methods for calculating evapotranspiration, the Tornthwaite method and the Penman-Monteith method.
Materials and Methods
Study Area
The sanitary landfill “Savina Stena” is located on the territory of the municipality of Zvečan, in the town of Srbovac. It covers an area of 26.6 ha, not far from the highway Raška-Kosovska Mitrovica, with coordinates 42º58´01´´N and 20º49´52´´E, with an elevation of 560 meters. Positioned approximately 300 meters away from the right bank of the river Ibar, the landfill finds itself within a basin surrounded by hills. The slope of the landfill varies, with a gradient of 30%-35% from north to south and 23% from east to west. The facility comprises two cells, with the initial decade of waste disposal planned exclusively in cell “A” (Fig. 1).
The cell has a total area of 2.92 hectares and a capacity to accommodate 350,000 cubic meters of waste. This capacity projection aligns with the ten-year waste disposal requirements for four municipalities: Zvečan, Kosovska Mitrovica, Leposavić, and Zubin Potok. The waste estimation takes into consideration various factors, such as the current waste generation per capita in these municipalities, projected municipal development, and expected population growth. The anticipated waste quantities for the period spanning from 2020 to 2035 are provided in Table 1.
The bottom of the landfill cell has a 5% slope, which facilitates the controlled movement of water within the cell. This slope proves advantageous for the installation and functioning of the landfill’s leachate collection system.
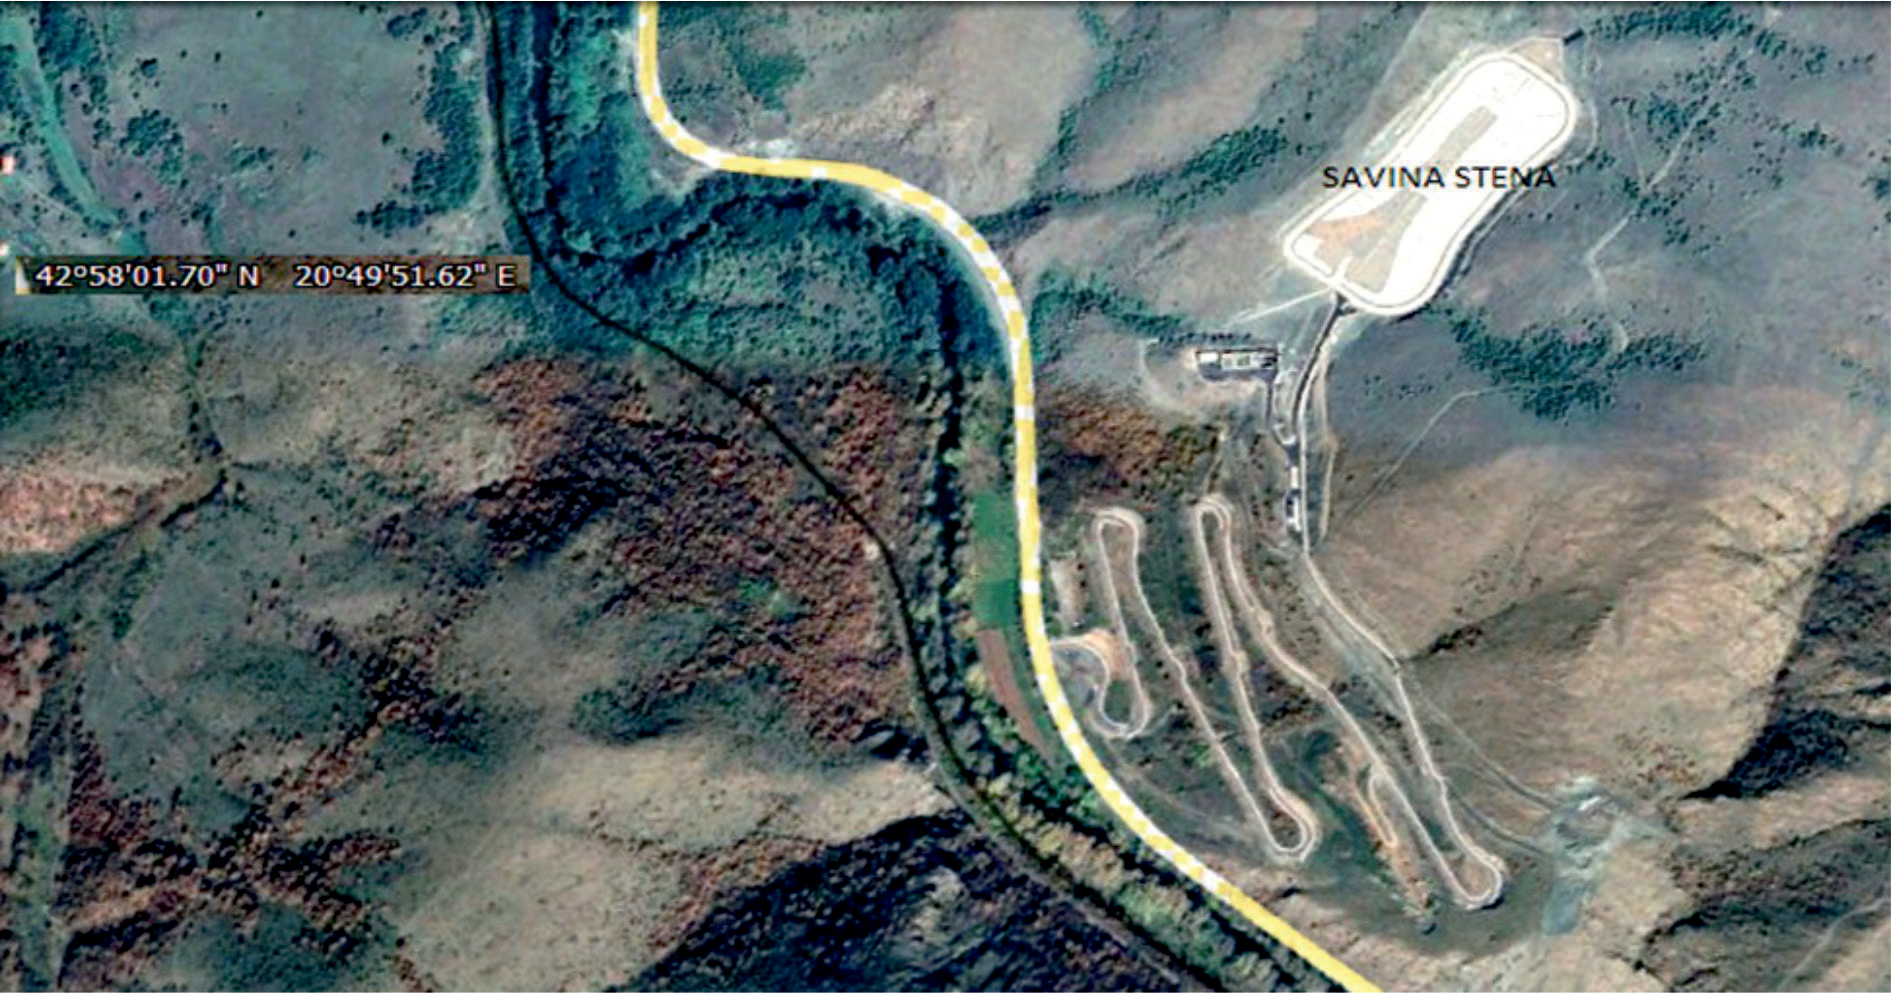
Table 1.
Quantity and volume of disposed waste, for the years 2020-2035.
Meteorological Data
Due to the unavailability of meteorological stations in the vicinity of the “Savina Stena” landfill, the required meteorological data was obtained from the FAO AQUASTAT Climate Information Tool. The AQUASTAT tool, a global information system on water and agriculture developed by the Food and Agriculture Organization (FAO), offers comprehensive data on various climatic parameters such as precipitation, temperature (minimum, maximum, and average), relative air humidity, insolation, wind speed at a height of 2 meters, and ETo (reference evapotranspiration) based on the specified coordinates of the study site.
For this research, data from the period between 1990 and 2020 was obtained from the AQUASTAT tool, and the average values of the meteorological parameters are presented in Table 2.
Evapotranspiration and Leachate
Evapotranspiration for a period of 31 years was calculated using the Thornthwaite (1948) formula:
where: ETo - potential evapotranspiration, ETx - corrected potential evapotranspiration
where: Ti - mean monthly air temperature, J - annual heat index, a - surface flow coefficient
Ji = monthly heat index
P - mean daylight hours for latitudes 42º [26]. P values are given in Table 3.
To compare the obtained evapotranspiration values with those calculated by the FAO AQUASTAT Climate Information Tool for the same time period, the Penman-Monteith method is used, as employed by the FAO AQUASTAT tool. The Penman-Monteith method requires several primary data inputs, including the pressure drop of saturated water vapor (∆), net radiation (Rn), assumed heat flux (G), psychrometric constant (γ), mean air temperature at a height of 2 meters (T), wind speed at a height of 2 meters (), and water vapor deficit at a height of 2 meters ( - ).
Table 2.
Average values of meteorological data for the period 1990-2020.
Table 3.
Mean daylight hours for latitudes 42º for the 15th of the month (P).
| Month | Jan | Feb | Mar | Apr | May | Jun | Jul | Aug | Sep | Oct | Nov | Dec |
|---|---|---|---|---|---|---|---|---|---|---|---|---|
| P | 9.3 | 10.4 | 11.7 | 13.2 | 14.4 | 15.0 | 14.8 | 13.7 | 12.3 | 10.8 | 9.6 | 9.0 |
The formula for calculating evapotranspiration using the FAO 56 Penman-Monteith method is as follows [16]:
To assess the potential deviation of the calculated evapotranspiration values, two measures are used: the root mean square error (RMSE) and the relative error (RE):
Following the calculation of evapotranspiration, the amount of leachate in the sanitary landfill was determined by employing the hydrological balance equation:
L= P-R-E,
Where: P-stands for precipitation, R-coefficient of surface runoff and E-evapotranspiration. It is crucial to highlight that the ingress of leachate into the groundwater, as well as vice versa, is effectively prevented through the implementation of a geosynthetic barrier positioned along the bottom and edges of the landfill cell. Furthermore, the absence of stormwater inflow from the surrounding landfill area is ensured due to the presence of drainage channels designed to handle its discharge.
The data used to calculate potential evapotranspiration and evapotranspiration are shown in Table 4.
Results and Discussion
Evapotranspiration and the Amount leachate
Annual heat index (J), calculated by formula
Surface flow coefficient (a), whose value is calculated by the formula a = 0.016J + 0.5, amounts to 1.13.
Surface runoff coefficient (R) has a value of 0.00, which means that all precipitation is lost in the form of abstractions such as infiltration, controlled drainage, and evaporation, that is, there is no precipitation runoff into the landfill cell.
Table 4.
Values for calculating corrected potential evapotranspiration and evapotranspiration.
Table 5.
Corrected potential evapotranspiration and evapotranspiration in mm/month.
| Jan | Feb | Mar | Apr | May | Jun | Jul | Aug | Sep | Oct | Nov | Dec | Total | |
|---|---|---|---|---|---|---|---|---|---|---|---|---|---|
| ETx | -2.88 | 1.76 | 16.16 | 37.76 | 62.72 | 85.28 | 98.56 | 100.80 | 74.88 | 49.44 | 22.72 | 1.28 | 547.48 |
| ETo | -3.26 | 2.23 | 23.01 | 60.66 | 109.91 | 155.68 | 177.52 | 168.06 | 112.09 | 64.98 | 26.54 | 1.40 | 898.82 |
Table 6.
Amount of leachate.
| Jan | Feb | Mar | Apr | May | Jun | Jul | Aug | Sep | Oct | Nov | Dec | |
|---|---|---|---|---|---|---|---|---|---|---|---|---|
| L (m³/hour) | 2.11 | 1.96 | 1.86 | 0.42 | 0 | 0 | 0 | 0 | 0 | 0 | 1.44 | 2.58 |
| L (m³/day) | 50.52 | 47.09 | 44.61 | 10.09 | 0 | 0 | 0 | 0 | 0 | 0 | 34.58 | 61.82 |
| L (m³/month) | 1515.60 | 1412.70 | 1338.30 | 302.70 | 0 | 0 | 0 | 0 | 0 | 0 | 1037.40 | 1854.60 |
Obtained values of corrected potential evapotranspiration (ETx) and reference evapotranspiration (ETo) for the time period from 1990-2020, are shown in Table 5.
The Thornthwaite method in the calculation of reference evapotranspiration relies on the mean air temperature and heat index. The mean daily air temperature for January is -0.87, which results in a negative value of reference evapotranspiration (-3.26). In relation to the Penman-Monteith calculation, the obtained value is significantly different due to the use of many other input parameters (in relation to Thornthwaite), such as solar radiation, wind speed, water vapor deficit, psychometric constants, etc., which results in obtaining a positive value of evapotranspiration for the same period (18.22).
Quantification of Leachate Production in the Savina Stena Sanitary Landfill
Based on meteorological data and evapotranspiration values, the amount of leachate produced per hour, day and month was calculated (Table 6).
The calculation of leachate generation was performed utilizing the hydrological balance equation, incorporating meteorological data spanning 31 years (1990-2020). The findings revealed that the highest leachate production is anticipated in December, with a daily rate of 61.82 m³/day, equivalent to 1854.60 m³ per month or 2.58 m³ per hour. The results for January and February further validate the winter period as characterized by increased leachate generation. This aligns with the observation that evapotranspiration is at its lowest during these months, confirming the inverse relationship between seepage water and evapotranspiration.
During the months of May, June, July, August, September, and October, the leachate production is not zero in real conditions. It corresponds to the sum of water generated by the biodegradation of organic waste and the water content within the waste, minus the water retained by the waste. The age of the landfill, along with the thickness and composition of deposited waste, can significantly influence this value. However, considering that the „Savina Stena“ sanitary landfill is relatively young, these factors are not expected to exert a substantial impact on leachate production.
Comparison of Evapotranspiration Results Obtained by Different Calculation Methods
Fig. 2 showcases a graphical comparison between the evapotranspiration values obtained from the FAO AQUASTAT Climate Information Tool (ETo,pm) and those calculated using the Thornthwaite method (ETo). It is important to note that these methods utilize different sets of data for their respective calculations, which explains the observed differences in the obtained values.
The data provided by the FAO AQUASTAT Climate Information Tool is specific to its methodology, while the Thornthwaite method relies on its own set of parameters and calculations. These methodological disparities contribute to the variations in the resulting evapotranspiration values.
Fig. 2.
Graphic representation of ETo,pm (FAO AQUASTAT Climate Information Tool) and ETo (Thornthwaite).
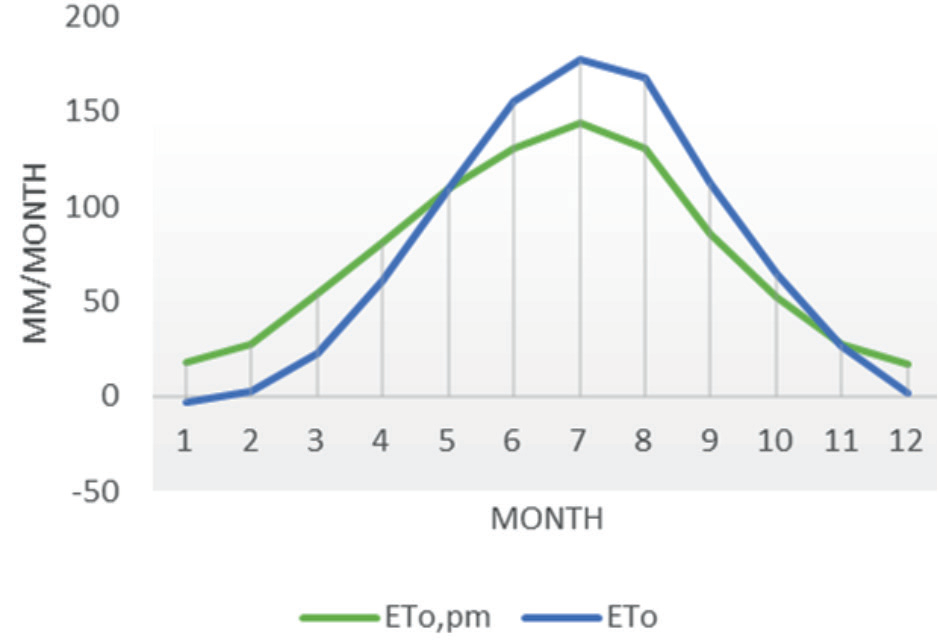
By visually representing the comparison in Fig. 2, the graph highlights the distinct patterns and magnitude of the evapotranspiration values derived from each method.
A quantitative evaluation was conducted to compare the Thornthwaite method and the evapotranspiration values obtained from the FAO AQUASTAT Climate Information Tool. This comparison was performed using two error metrics: the root mean square error (RMSE) and the relative error (RE). The values needed for this calculation are shown in Table 2 (FAO AQUASTAT Climate Information Tool -ETo, pm) and Table 5 (Thornthwaite method- ETo).
The calculated RMSE value between the two methods was determined to be 0.807 mm/, indicating the average difference between the calculated and reference evapotranspiration values. This metric provides a measure of the overall accuracy of the Thornthwaite method in estimating evapotranspiration compared to the values obtained from the FAO AQUASTAT Climate Information Tool.
The relative error (RE) value, on the other hand, was determined to be 0.001. This metric represents the discrepancy between the calculated and reference evapotranspiration values, expressed as a percentage of the reference values. A low RE value suggests a relatively small deviation between the calculated and reference evapotranspiration values.
Based on the demonstrated relatively small RE compared to the comparative method, Torthwaite‘s method can be considered suitable for calculating evapotranspiration for the study area. The reasonable agreement of the two compared methods confirms the applied method as effective for areas for which there is not enough input data for other, more complicated methods. The compatibility of these two methods for calculating evapotranspiration was also confirmed by Santos et al. [27], who in their work compared Torthwaite‘s method with the standard PM FAO-56 method, showed the accuracy of this method (d>0.90; EPE<0.72 mm ) and ranked it among the best for calculating evapotranspiration for Rio de Janeiro.
Conclusions
The sanitary landfill „Savina Stena“ holds significant importance for the northern region of Kosovo and Metohija. It provides a much-needed solution for proper municipal waste disposal, addressing the inadequate waste management practices in the four municipalities of Kosovska Mitrovica, Zvečan, Leposavić, and Zubin Potok. With its capacity meeting the waste disposal needs of these municipalities for a span of 20 years, the landfill plays a crucial role in ensuring environmental sustainability in the region.
In this study, evapotranspiration was estimated using the Thornthwaite method for the period from 1990 to 2020. Due to the unavailability of a nearby meteorological station, meteorological data were obtained from the FAO AQUASTAT Climate Information Tool based on the coordinates of the landfill site. The potential evapotranspiration (ETo) was calculated, and subsequently, the quantity of leachate expected to be generated within the landfill was determined using a straightforward hydrological balance equation. The results revealed that the highest volume of leachate production would occur in December, reaching 61.82 m³/day. Similarly, elevated amounts of leachate were observed in January (50.52 m³/day) and February (47.09 m³/day), highlighting the winter months as significant contributors to leachate generation. These findings align with the expectation that leachate production is highest during periods of reduced evapotranspiration, which is typically observed during the winter season.
To validate the accuracy of the calculated evapotranspiration values, a comparison was made with the evapotranspiration values provided by the FAO AQUASTAT Climate Information Tool. This was accomplished by computing the root mean square error (RMSE) and relative error (RE) between the two sets of values. The analysis indicated an RMSE of 0.807 mm/ and an RE of 0.001, demonstrating a relatively small deviation between the calculated and FAO AQUASTAT values.Comparing the results of different methods, including the FAO AQUASTAT tool, using the root mean square error (RMSE) and relative error (RE), highlighted the discrepancies and potential variations caused by different calculation approaches.
These findings emphasize the need for further scientific activities to investigate the impact of climate change on evapotranspiration and leachate generation. Future research should focus on studying the potential effects of climate change on these parameters, enabling adaptation and mitigation strategies to be developed for more sustainable waste management practices in the face of changing climatic conditions. Understanding the implications of climate change will assist in improving waste management infrastructure and enhancing environmental resilience in the region.

