

Introduction
The antimony resources in the Xikuangshan area of Lengshuijiang City account for approximately 30% of the global reserves, earning it the title of 'World Antimony Capital'. The waste slag in the antimony mining area is toxic material generated during the processes of mining, ore dressing, smelting, and production of antimony. The accumulation of waste slag not only occupies a large amount of land resources but also results in potentially toxic heavy metal elements leaching into nearby residential water environments during rainfall [1, 2]. Heavy metal elements can enter the human body through skin contact and intake, causing cardiovascular diseases, kidney problems, neurological and digestive system issues, and posing carcinogenic risks [3]. Therefore, it is of significant practical importance to identify the characteristics of heavy metal content and assess their ecological and health risks.
The Xikuangshan Antimony Mine in Hunan Province is one of the largest antimony mines in the world. The mining and production activities of antimony mines have caused severe antimony pollution to the surrounding environment [4, 5]. So far, numerous scholars at home and abroad have conducted research on heavy metal pollution and risk assessment. Studies have shown that during mineral extraction processes, the discharge of wastewater, the stacking of waste slag, and leaching from rainfall have led to the accumulation of large amounts of heavy metals in the soil surrounding mining areas [6-9]. Xu et al. used the geoaccumulation index and potential ecological risk index to assess the characteristics of soil heavy metal pollution, indicating that the soil heavy metal pollution risk in Ningxia along the Yellow River urban belt mainly comes from Cd elements [10]. Wu et al. conducted a comprehensive evaluation of soil samples in Jinshan District, Shanghai, using the geoaccumulation index, Nemerow comprehensive pollution index, and potential ecological risk index, indicating a moderate overall ecological risk in the study area, with attention warranted for Ni, Cu, and Cd in the soil [11]. Zhang et al. employed a health risk assessment model to evaluate the health risks of drinking water sources in the Liujiang River basin, identifying Cr and As as the primary pollutants posing health risks [12]. Wang Zhigang et al. conducted a health risk assessment of surface water and groundwater in the Yangtze River Estuary region, finding that the hazard quotient for the children's group exceeded the USEPA's recommended maximum acceptable risk value [13]. Muhammad Adnan et al. assessed the heavy metal pollution status in the soil of smelting areas, concluding that children are more susceptible to heavy metal contamination compared to adults [14]. Current research largely focuses on heavy metal pollution in farmland soil and surface water around mining areas, but there is insufficient study utilizing multiple assessment methods for risk evaluation of mining waste slag and leachate.
This study focuses on the waste slag in the Beikuang area of the Xikuangshan Tin Mine, Lengshuijiang City, Hunan Province. It employs the Geoaccumulation Index, Nemerow Pollution Index, Potential Ecological Risk Assessment method, and the health risk assessment model recommended by USEPA to systematically analyze the concentration levels of heavy metals in the waste slag and leachate, pollution characteristics, and ecological and health risks. The objective is to provide a scientific basis for the prevention and control of heavy metal pollution in water resources in this area.
Material and Methods
Study Area Overview
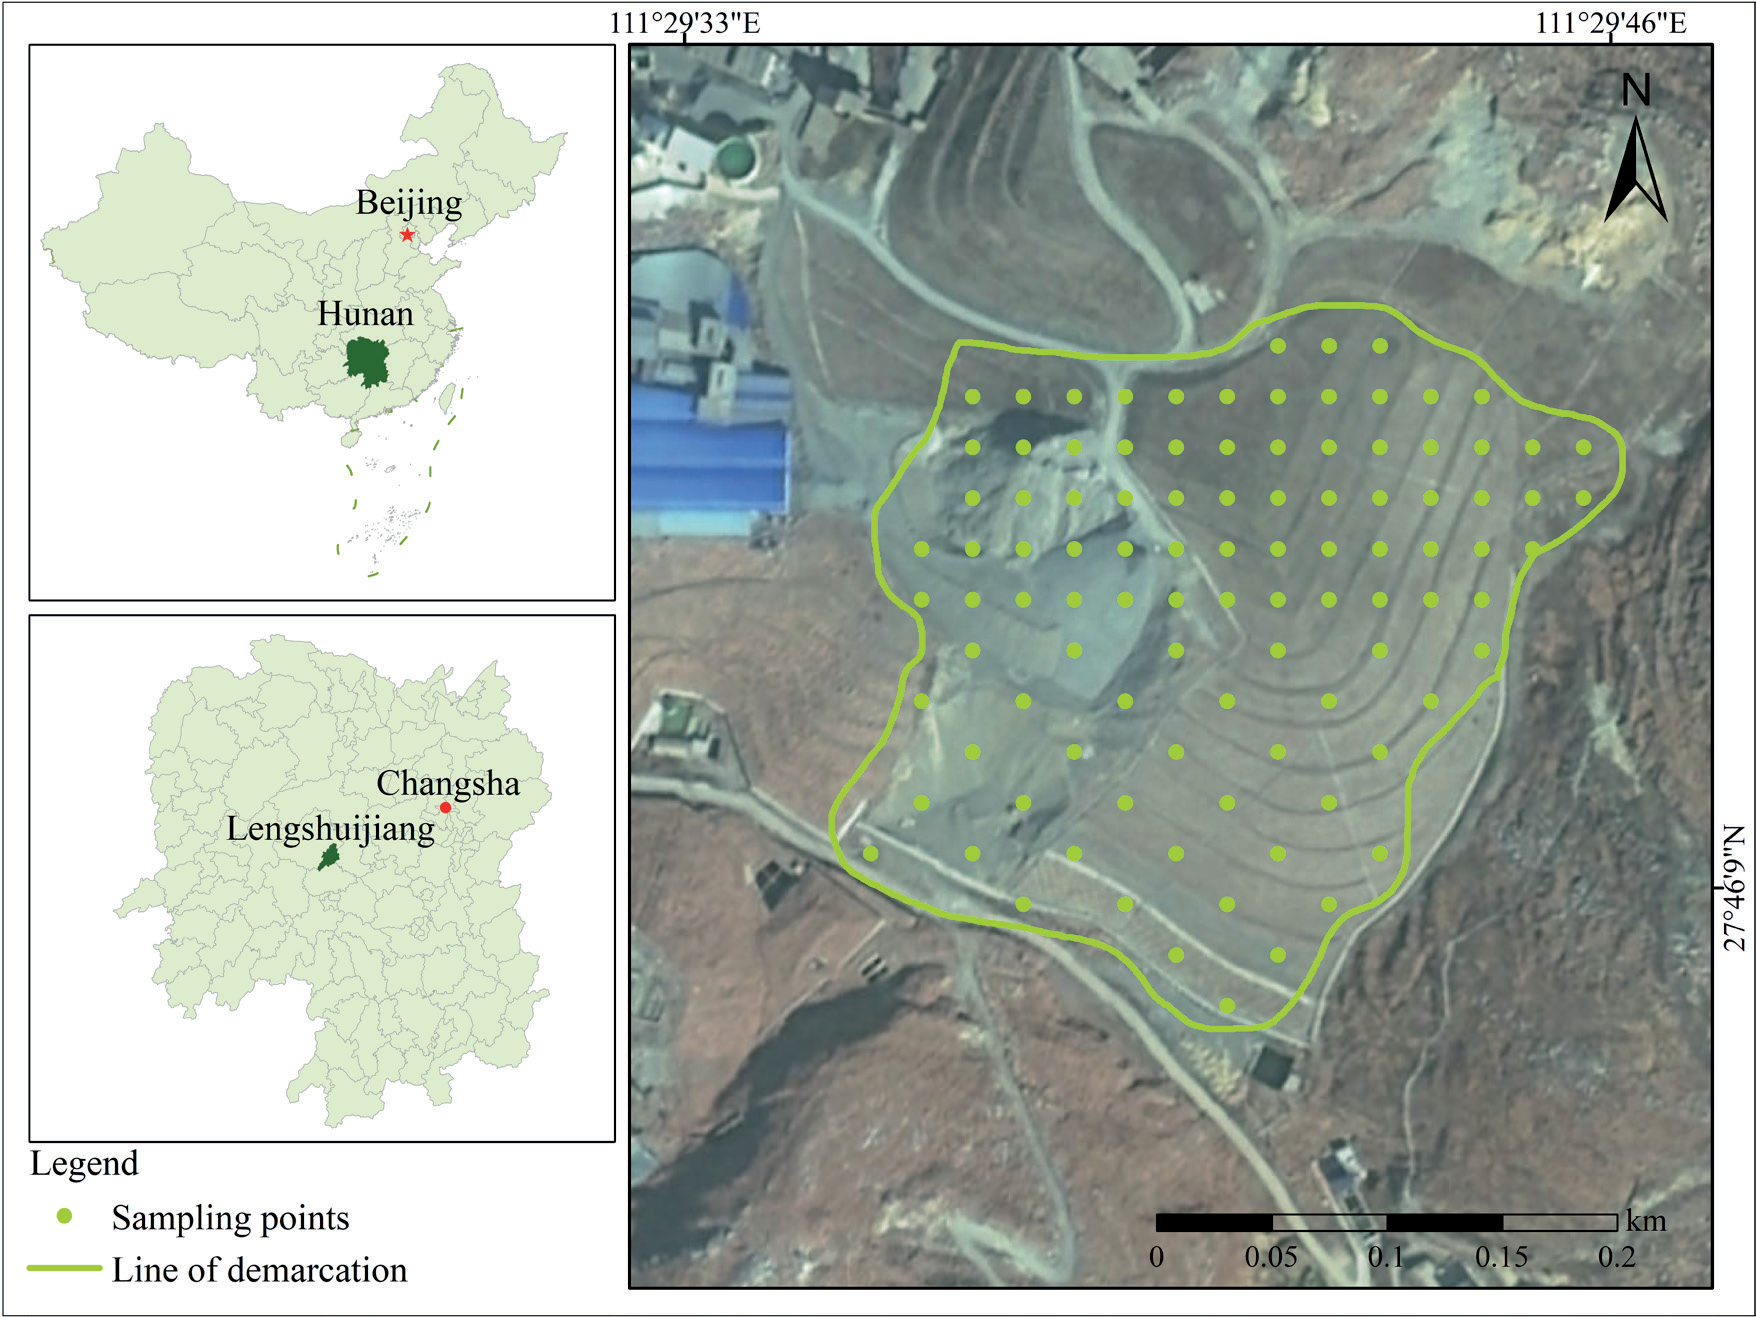
The study area is located in the Xikuangshan Tin Mine, Lengshuijiang City, Hunan Province. Lengshuijiang City is situated between north latitude 27°30′49″ to 27°50′38″ and east longitude 111°18′57″ to 111°36′40″, in the central part of Hunan Province. It is located in the middle reaches of the Zijiang, at the eastern foothills of Xuefeng Mountain. The city covers an area of 438 km² and is bordered by Lianyuan City to the east, Xinshao County to the south, and Xinhua County to the west and north. The terrain within the city is characterized by higher elevations in the north and south, with lower elevations in the central area, resembling an asymmetrical saddle shape. The climate of Lengshuijiang City belongs to the warm and humid subtropical monsoon climate zone, characterized by hot and humid summers and cold and dry winters, with distinct seasons. The annual average temperature is 18°C, with a daily maximum temperature of 40°C and a daily minimum temperature of -4°C. The annual precipitation ranges from 1159.0 to 1568.2 mm. The Xikuangshan Tin Mine is located in the northeastern part of Lengshuijiang City, featuring a structural erosion low mountain and hill-valley landform. The original topography has significant fluctuations, predominantly composed of hill slopes with steep gradients ranging from 25 to 45 degrees. The relative elevation difference between the base and top of these slopes is around 50 meters. Vegetation on the slopes is generally sparse, with exposed mine waste commonly visible. The location of the study area and distribution of sampling points are shown in Fig 1.
Sample Collection and Processing
Based on the preliminary data collection and initial sampling analysis, it is evident that the composition of the waste slag is generally uniform. A total of 100 waste slag samples were collected using the slag heap sampling method. Specifically, the sampling method involved drawing the first horizontal line 0.5 meters from the base of the cone on both sides of the slag heap. Subsequently, horizontal lines were drawn every 0.5 meters and vertical lines were drawn every 2 meters, with sampling points identified at the intersections of these lines. To ensure the waste slag samples are representative, the slag heap was divided into three layers within the depth range of 0.2 to the bottom layer, based on actual site conditions. Sampling points are set at every 0.5~1.0m increment in each layer, and then a mixed sample is formed. At the same time, layers are classified based on color, structure, texture, tightness, temperature, and other factors for careful observation. The morphology and characteristics of the waste residues at each layer are recorded from top to bottom, and samples are taken accordingly. To avoid contamination, the surface layer is scraped off before sampling layer by layer. Finally, the samples were placed into labeled, self-sealing cloth bags, and corresponding location information was recorded.
Samples of collected waste slag are sent back to the laboratory, placed in a dry and ventilated indoor area for shade drying, ground, sifted through 20- mesh and 100-mesh screens, and stored in self-sealing bags for subsequent analysis. Dissolve the samples using concentrated HCl, concentrated HNO3, and HF. After cooling, dilute the digestion fluid to 100ml or 50ml, adjusting the final volume based on the content of the components to be tested. The water immersion experiment adopts the method specified in 'Solid Waste Leaching Toxicity Leaching Method Horizontal Vibration Method' HJ 557-2009. A sample of 100 g was placed in a 2 L extraction bottle. The volume of the leachat was calculated based on a liquid-to-solid ratio of 10:1 (L/kg). The oscillation frequency was adjusted to 110 ± 10 times/min with an amplitude of 40 mm. After oscillating at room temperature for 8 hours, the extraction bottle was removed and allowed to stand for 16 hours. For the determination of heavy metal elements Pb, Cr, As, Cd, and Sb content, direct flame atomic absorption spectrometry is used. When analyzing samples in the laboratory to ensure data accuracy, a full procedural blank test is performed for each batch of monitored samples. Additionally, for each project analysis in a batch of samples, 20% are conducted as parallel samples; when fewer than 5 samples are available, at least 1 parallel sample is included.
Data Processing
This study used Excel 2016 and SPSS software for data processing and analysis, calculating the maximum, mean, standard deviation, and coefficient of variation for each sample point. Origin 2022 was used for various data plotting. Using ArcGIS 10.8 software to create distribution maps of study area sample points and spatial distribution maps of heavy metal content. The spatial distribution maps were generated using the inverse distance weighting (IDW) method to interpolate the spatial distribution of heavy metal contents.
Table 1.
Classification of pollution.
Ecological Risk Assessment Methods
In this study, the geo-accumulation index method, Nemerow pollution index method, and potential ecological risk index method were employed to assess heavy metal pollution in waste slag and leachate.
(1) The geo-accumulation index method comprehensively considers factors such as anthropogenic pollution and geochemical background, quantitatively assessing the degree of heavy metal pollution in soils or other substances in the ecological environment [15, 16]. The calculation formula is:
Where Igeo is the geo-accumulation index, Cn is the measured concentration of a specific heavy metal, k is the correction factor (typically 1.5) [17, 18], and Bn is the background value of the heavy metal [19, 20]. Evaluation criteria for Igeo are shown in Table 1 [21-23].
(2) The Nemerow pollution index method integrates the effects of maximum and mean values on the basis of single-factor pollution indices, commonly used in comprehensive pollution index calculations [24]. The calculation formula is:
Where Pi is the single-factor index for heavy metal i; Ci is the measured value of heavy metal i; Si is the background value of heavy metal i; Pn is the Nemerow comprehensive pollution index; Pimax is the maximum single-factor index of heavy metals; Piave is the arithmetic mean of single-factor indices of heavy metals. Evaluation criteria for Pn and Pi are shown in Table 1 [25-27].
(3) The potential ecological risk index method comprehensively evaluates the potential ecological hazard of multiple heavy metals by considering their concentrations and ecological toxicity in soils or other substances [28, 29]. The calculation formula is:
Where RI is the comprehensive potential ecological risk index of multiple heavy metals in waste slag; Eir is the potential ecological risk index of individual heavy metal i; Tir is the toxicity coefficient of heavy metal i, with values Pb (5) < Cr (2) < As (10) < Cd (30) < Sb (7) [30-32]; Cir is the pollution coefficient of heavy metal i; Ci is the measured concentration of heavy metal i; Cin is the background value of heavy metal i. Evaluation criteria for Eir and RI are shown in Table 2 [33-35].
Health Risk Assessment Methods
This study adopted the USEPA-recommended carcinogenic and non-carcinogenic health risk assessment models to evaluate the health hazard risk of heavy metals in leachate [36]. Heavy metals in water can pose health risks to humans through ingestion, skin contact, and inhalation pathways. Ingestion and skin contact are the main pathways through which heavy metals in water sources enter the human body [37]. Therefore, this study only considers the health risks posed by heavy metals to human health through ingestion and skin contact [38]. According to the International Agency for Research on Cancer (IARC), elements are classified into non-carcinogenic (Pb and Sb) and carcinogenic (Cr, As, and Cd) categories [39]. The calculation formula is as follows:
In the formula, ADDingestion and ADDdermal represent the daily average exposure dose through ingestion and dermal contact (µg/(kg·d)); Cw is the average concentration of heavy metals in water (µg/L); IR is the intake rate (L/d), 2.2 for adults and 1.0 for children; EF is the exposure frequency (d/a), 350 days/year for both adults and children; ED is the exposure duration (years), 30 years for adults and 6 years for children; BW is the average body weight (kg), 57 kg for adults and 24 kg for children; AT is the average exposure time (days), 25,550 days for non-carcinogens and 2,190 days for carcinogens for children and adults; PC is the permeability coefficient of heavy metal elements on the skin surface (cm/h), 0.001 for Pb, As, and Cd, 0.002 for Cr, and 0.004 for Sb; ET is the daily exposure time (hours/day), 0.58 for adults and 1 for children; SA is the exposed skin area (cm²), 18,000 cm² for adults and 6,600 cm² for children. Values of parameters related to the health risk assessment model can be found in references [40-43].
The non-carcinogenic risk calculation formula is as follows:
In the formula, HQ is the hazard quotient; ADD is the daily average exposure dose (µg/(kg·d)); RfD is the reference dose (µg/(kg·d)); HI is the sum of hazard quotients for each heavy metal element from direct ingestion and dermal absorption; HQingestion is the hazard quotient from direct ingestion; HQdermal is the hazard quotient from dermal absorption; according to USEPA classification, HI<1 indicates a relatively low non-carcinogenic health risk; HI>1 indicates a significant health risk to human health [44, 45].
The carcinogenic risk calculation formula is as follows:
In the formula, CR represents carcinogenic health risk; SF is the slope factor (µg/(kg·d)). According to USEPA classification, CR > 1×10⁻⁴ indicates potential carcinogenic risk. Values for RfD and SF can be found in Table 3 [46-49].
Results and Discussion
Descriptive Statistics
Characteristics of Heavy Metal Content in Waste Slag
The statistical characteristics of pH and heavy metal content in waste slag are shown in Table 4. The average pH is 8.19, ranging from 7.69 to 8.65, indicating that the waste slag in the study area is generally alkaline. The average concentrations of heavy metals Pb, Cr, As, Cd, and Sb are 29.12, 41.57, 183.93, 1.75, and 288.88 mg/kg, respectively. The order of concentration is Sb >As>Cr>Pb>Cd. The ratios of Pb, Cr, As, Cd, and Sb concentrations to the soil background values in the area are 1.08, 0.63, 13.14, 25, and 96.94, respectively. Except for Cr, the levels of the other heavy metals exceed the soil background values. The proportions of spot locations exceeding background values for Pb, As, Cd, and Sb are 56%, 100%, 100%, and 100%, respectively. The coefficient of variation can reflect the uniformity of heavy metal distribution in soil; a higher coefficient indicates a more uneven spatial distribution, suggesting possible anthropogenic influences [50]. According to the coefficient of variation, it can be classified into three levels: low variation (<15%), moderate variation (15%~36%), and high variation (>36%) [51]. The order of coefficient of variation for heavy metals is As = Sb > Pb > Cd > Cr. The coefficient of variation for As and Sb is 0.61, showing strong variation, suggesting uneven distribution in the waste slag with significant spatial differences, influenced largely by human activities; Pb and Cd have coefficients of variation of 0.23 and 0.16, respectively, showing moderate variation, with differences in Pb and Cd content among different sampling points in the study area, indicating enrichment phenomena; Cr has a coefficient of variation of 0.12, showing low variation, suggesting relatively uniform distribution of Cr in the waste slag.
Table 3.
Values of reference doses and slope factors for heavy metals (µg/(kg·d)).
| Heavy metal | RfDingestion | RfDdermal | SFingestion | SFdermal |
|---|---|---|---|---|
| Pb | 1.4 | 0.42 | — | — |
| Cr | 3 | 0.075 | 0.5 | 0.5 |
| As | 0.3 | 0.285 | 1.5 | 3.66 |
| Cd | 0.5 | 0.025 | 6.1 | 0.38 |
| Sb | 0.4 | 0.357 | — | — |
Table 4.
Descriptive statistics of pH and heavy metal content in waste slag (mg/kg).
Table 5.
Descriptive statistics of pH and heavy metal content in leachate (mg/L).
Characteristics of Heavy Metal Content in Leachate
The descriptive statistics of pH and heavy metal content in leachate are shown in Table 5. The pH ranges from 7.57 to 8.89, complying with the standards set by 'Surface Water Environmental Quality Standards' (GB 3838—2002). Except for Sb, the average concentrations of Pb, Cr, As, and Cd meet Class III water quality requirements. The average concentrations of these five heavy metals, from highest to lowest, are Sb > Cr > As > Pb > Cd. The leached concentration of Sb ranges from 0.0006 to 0.564 mg/L, with 67% of samples exceeding Class III water quality standard limits for Sb. The highest concentrations of the other heavy metals do not exceed the standard limits. As and Sb exhibit strong variation, indicating significant spatial differences for these two elements; pH and other elements show relatively low variation, indicating more uniform distribution and less influence from the spatial scale. The water leaching experiment results indicate that Sb is the primary pollutant in the water environment of the study area. Heavy metals in waste slag enter surface water through geochemical processes and should be given attention [52].
Spatial Distribution Characteristics of Heavy Metals
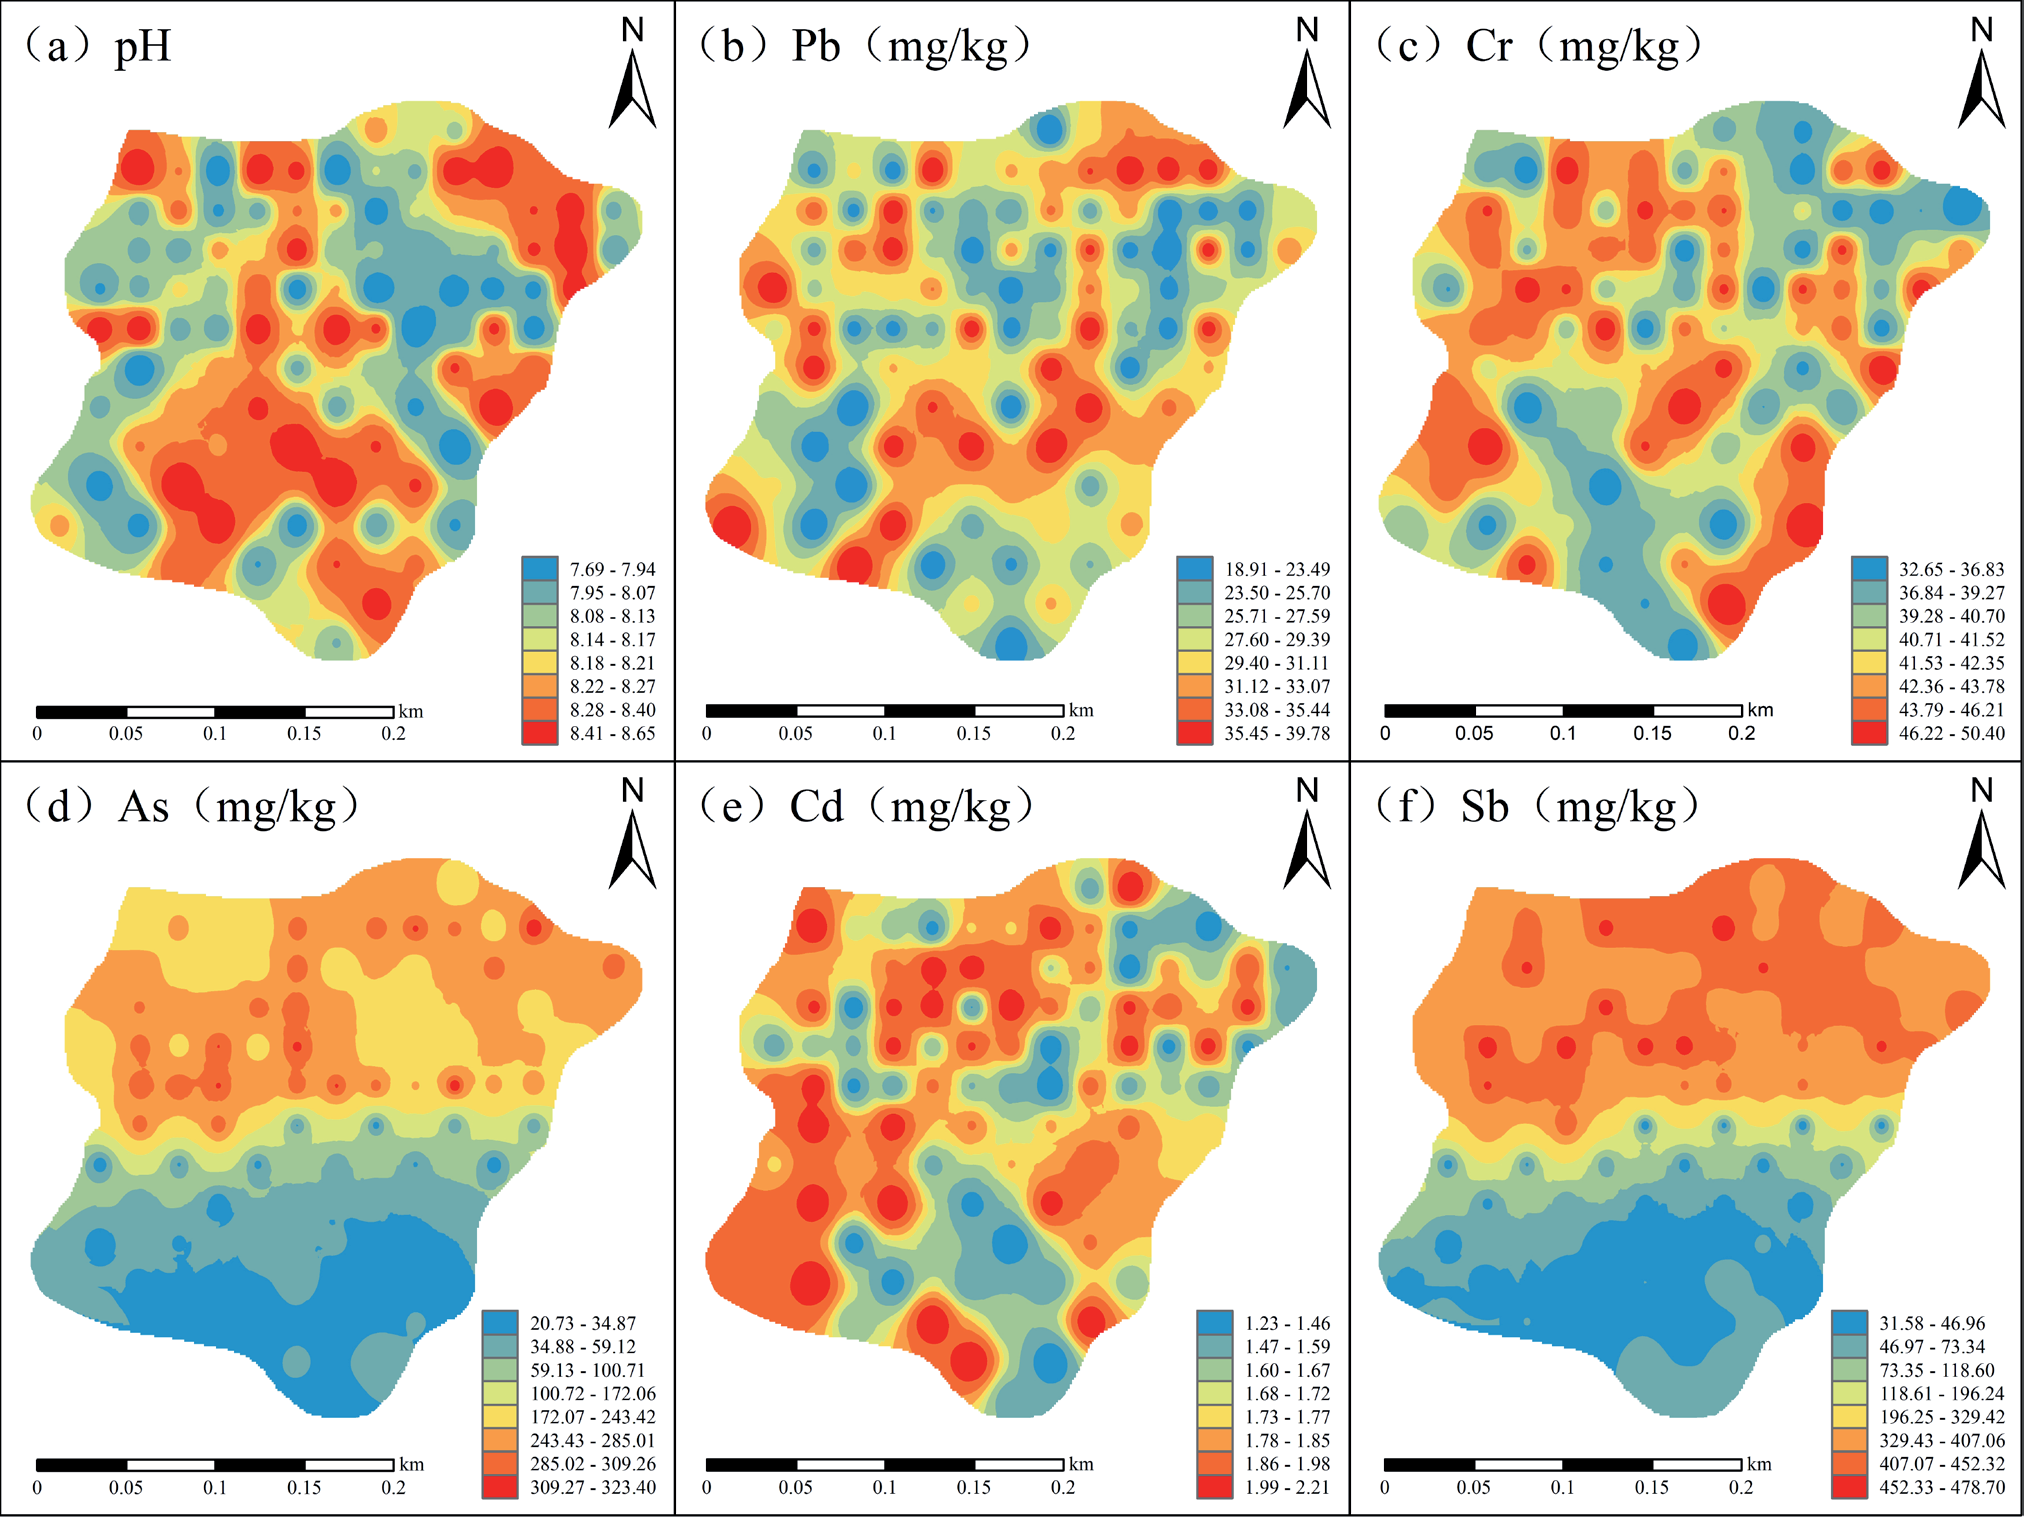
Using inverse distance weighting interpolation to map the spatial distribution of pH and heavy metal concentrations in the study area (Fig. 2). High pH values are mainly distributed in the southern and northeastern parts of the study area; areas of high Pb values are patchily distributed mainly in the central part of the study area, with some scattered in the northeast, and low Pb values are sporadically distributed in the southwest and northeast parts of the study area. The high concentration areas of Cr are patchily distributed in the western part of the study area, with island-like distributions in the central and southeastern parts, while concentrations are lower in the southern and northeastern parts; the spatial distribution characteristics of As and Sb are similar, showing a trend of increasing concentrations from south to north, with high and low-value areas concentrated in patches; the high concentration areas of Cd are patchily distributed in the northern and southwestern parts of the study area, with low-value areas scattered in the southern regions.
Assessment of Heavy Metal Pollution
Geoaccumulation Index Method
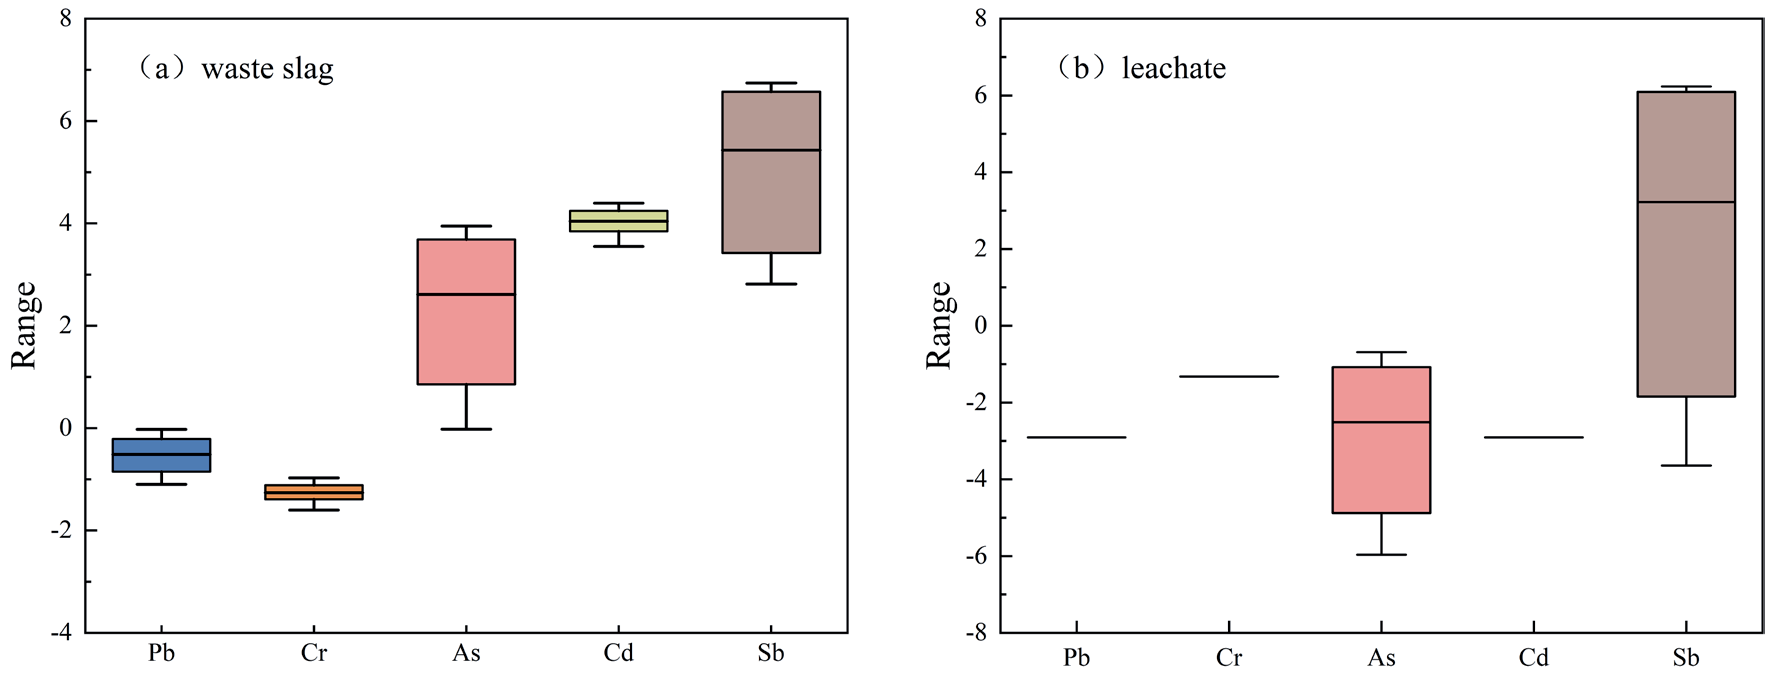
Using the background values of heavy metal elements in soil from Hunan Province as a standard, the geoaccumulation index was used to evaluate the heavy metals in waste slag, as shown in Fig. 3(a). The average geoaccumulation index values for heavy metals are as follows: Sb (5.43) > Cd (4.04) > As (2.61) > Pb (-0.51) > Cr (-1.26). Among these, the Igeo values for Pb and Cr are less than 0, indicating no pollution, while the Igeo values for other heavy metals are greater than 0, indicating a high cumulative degree of pollution overall, suggesting a severe pollution level. Pb and Cr elements show no pollution levels; As exhibits slight pollution, moderate pollution, and heavy pollution levels at 29%, 1%, and 67% of sites, respectively, with only 3% of spot locations showing no pollution levels; Sb shows severe pollution, heavy pollution, and moderate pollution levels at 67%, 26%, and 7% of sites, respectively; Cd exhibits heavy pollution and moderate pollution levels at 56% and 44% of sites, respectively. The study results indicate that the pollution levels of Sb and Cd are relatively severe in the slag heap. Therefore, strict monitoring of the concentrations of Sb and Cd in the slag heap is necessary.
The geoaccumulation index results of leachate heavy metals are shown in Fig. 3(b). With surface water quality class III as the standard, the average geoaccumulation index values are: Sb (3.22) > Cr (-1.32) > As (-2.51) > Pb = Cd (-2.91). Spot locations with severe pollution from Sb account for 67%, making it the most significant source of pollution. The Igeo values for the other heavy metals are all less than 0, indicating no pollution levels.
Overall, the waste slag and leachate in the study area are severely polluted. In the waste slag, Sb and Cd show relatively severe pollution, while in the leachate, Sb is the primary source of pollution.
Nemerow Pollution Index Method
Using the single pollution index method and the Nemerow comprehensive pollution index method, the evaluation of heavy metal pollution in waste slag is shown in Fig. 4(a). The single pollution index ranges for heavy metals Pb, Cr, As, Cd, and Sb are 0.70~1.47, 0.49~0.76, 1.48~23.14, 17.57~31.57, and 10.57~160.74, respectively. Pb uncontaminated spot locations account for 44%, while spot locations with slight contamination levels reach 56%; Cr shows no pollution levels; As has 67% of spot locations at severe pollution levels, with additional spot locations at 8%, 24%, and 1% for slight, moderate, and mild pollution levels, respectively; Cd and Sb show spot locations at severe pollution levels, accounting for 100%. The Nemerow comprehensive pollution index reflects the overall pollution status of five heavy metals in the waste slag, with 100% of spot locations having a comprehensive pollution index greater than 5. The results indicate that heavy metal pollution in the slag heap is extremely severe, with Sb and Cd being the main pollutants.
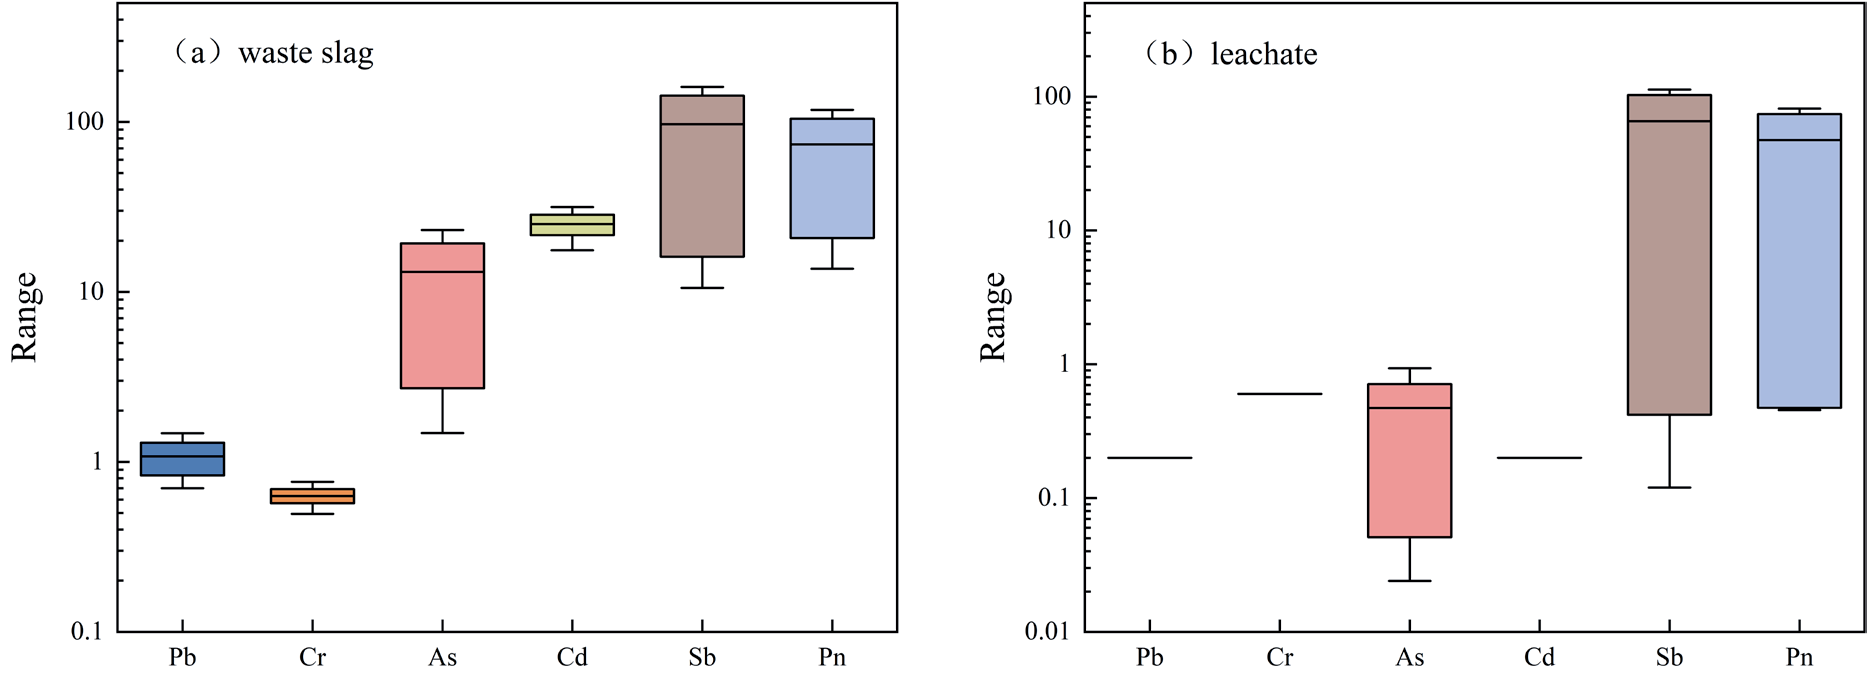
The single-factor index and Nemerow comprehensive index of leachate heavy metals are shown in Fig. 4(b). With surface water quality class III as the standard, the Nemerow comprehensive index ranges from 0.45 to 81.39, with a mean of 47.25, and 67% of sites show severe pollution. The pollution status of each heavy metal is Sb > Cr > As > Pb = Cd, with 67% of spot locations showing severe pollution from Sb, making it the most significant pollution source. The Pollution Index (PI) values for the other heavy metals are all less than 1, indicating no pollution risk.
Overall, in the waste slag, Sb and Cd are severely polluted, while in the leachate, Sb is the primary contributing element. This finding aligns with the results from the geoaccumulation index method.
Assessment of Potential Ecological Risks of Heavy Metals
The results of a single-factor and comprehensive potential ecological risk assessment of heavy metals in waste slag are shown in Fig. 5(a). The average values of Ei r for heavy metals are Cd (750.30) > Sb (678.57) > As (131.38) > Pb (5.39) > Cr (1.26). Cd, Sb, and As exhibit higher risk levels, while the potential ecological risk indices for other heavy metals indicate low risk. The potential ecological risk index for Cd is the highest, with Eir ranging from 527.14 to 947.14 and an average of 750.30. Sampling points with extremely high ecological risk account for 100%. The potential ecological risk index for Sb is slightly lower than Cd, with Eir ranging from 73.99 to 1125.17 and an average of 678.57, with sampling points categorized as moderate ecological risk, strong ecological risk, and extremely strong ecological risk at 4%, 29%, and 67%, respectively. The ecological risk level of the As element is at a strong risk grade, with sampling points categorized as low ecological risk, moderate ecological risk, and high ecological risk at 33%, 19%, and 48%, respectively. The comprehensive potential risk index (RI) for heavy metals ranges from 674.14 to 2250.55, with an average of 1566.90, indicating an extremely high ecological risk. The contribution of each heavy metal to the comprehensive potential ecological hazard equals the ratio of its single-factor potential ecological hazard index to the comprehensive potential ecological hazard index [53]. Cd and Sb are the primary ecological risk contributing factors, with contributions to the comprehensive potential ecological risk index of 47.88% and 43.31%, respectively. Cd and Sb should be prioritized as key elements for pollution control.
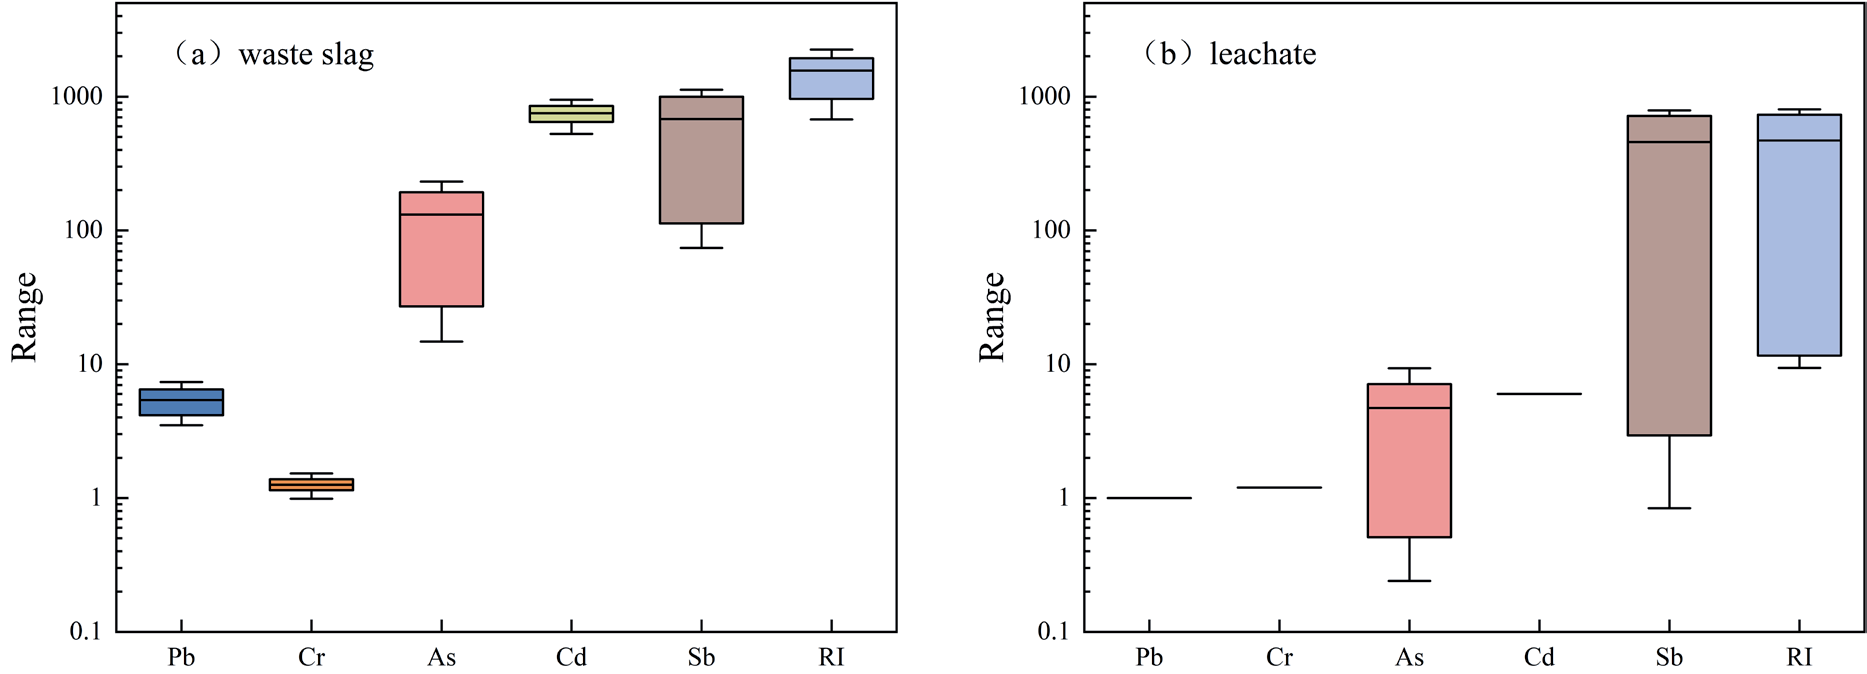
The results of a single-factor and comprehensive potential ecological risk assessment of heavy metals in leachate are shown in Fig. 5(b). The average values of Eir for heavy metals in the study area are Sb (457.58) > Cd (6) > As (4.71) > Cr (1.2) > Pb (1). Sb exhibits the highest risk level, indicating extremely high ecological risk, while the potential ecological risk indices for other heavy metals indicate low risk. The range of Eir values for Sb is 0.84 to 789.6, with an average of 457.58. Sampling points with extremely high ecological risk account for 67%. The comprehensive potential risk index (RI) for heavy metals ranges from 9.38 to 803.64, with an average of 470.49, indicating a strong ecological risk. Sb is the primary ecological risk contributing factor, contributing 97.26% to the comprehensive potential ecological risk index.
In summary, heavy metals in waste slag pose an extremely high ecological risk, while those in leachate pose a strong ecological risk. Cd and Sb are the primary contributing factors in waste slag, with Sb showing a particularly high contribution rate in leachate. Considering the coefficient of variation of Sb in waste slag and leachate as 0.61 and 0.7141, respectively, Sb is likely sourced from human activities associated with local mining operations [54].
Health Risk Assessment of Heavy Metals in Leachate
The non-carcinogenic risk assessment results of heavy metals in leachate for adults and children are shown in Table 6. Under the drinking water pathway, adults and children show similar trends in average non-carcinogenic health risks. The risks caused by heavy metals ranked from highest to lowest are: Sb > As > Cr > Pb > Cd. Children's non-carcinogenic health risk HQ is significantly higher than that of adults, indicating that under the same conditions, toxic heavy metals in water pose greater health risks to children. Additionally, the HQ mean values of Sb and As elements are greater than 1 in both adult and child populations, exceeding acceptable levels. Under the dermal exposure pathway, the non-carcinogenic health risks caused by each element in both adult and child populations are relatively low, whereas the non-carcinogenic risks from the drinking water pathway are higher than those from dermal exposure. From the perspective of total non-carcinogenic risk HI, for both adults and children, the non-carcinogenic risks caused by Sb and As elements are relatively high, indicating that residents near antimony mining areas are primarily threatened by Sb and As elements. Therefore, the prevention and control of heavy metal pollution in aquatic environments should focus on Sb and As elements.
The carcinogenic risk assessment results of heavy metals in leachate for adults and children are shown in Table 6. The risk trends of Cr, As, and Cd elements are similar in two populations and two pathways, all showing higher carcinogenic risks for adults compared to children, with higher risks from the drinking water pathway than from dermal exposure. The carcinogenic risks of Cr and As exceed the USEPA recommended potential carcinogenic risk threshold of 1.00×10⁻⁴ in two populations and two pathways, indicating a high carcinogenic risk associated with Cr and As. Cd poses a higher carcinogenic risk under the drinking water pathway in both populations, exceeding the potential carcinogenic risk threshold.
Overall, the health risks of heavy metals in leachate indicate significantly higher risks through the drinking water pathway compared to the dermal exposure pathway for both populations, highlighting drinking water as the primary route of health risk for these two groups, consistent with conclusions drawn in similar previous studies [55, 56]. The total non-carcinogenic risk HI shows higher values for children compared to adults, likely due to children's lower body weight and weaker immune systems. Conversely, the total carcinogenic risk CR shows higher values for adults compared to children, likely due to adults' higher water consumption, exposed skin surface area, and exposure duration [57, 58].
Table 6.
Non-carcinogenic and carcinogenic health risk assessment of heavy metals in leachate.
Conclusions
(1) The average contents of Pb, Cr, As, Cd, and Sb in waste slag samples from the study area were 29.12, 41.57, 183.93, 1.75, and 288.88 mg/kg, respectively. In the leachate, the average concentrations of five heavy metals are ranked as follows: Sb>Cr>As>Pb>Cd. The concentration of Sb exceeds the Class III water quality limit specified in 'Surface Water Environmental Quality Standards (GB 3838-2002)', with an exceedance rate of 67%. The other heavy metals are within acceptable limits.
(2) In terms of spatial distribution, As and Sb exhibit similar spatial distribution characteristics, showing a trend of lower concentrations in the south and higher concentrations in the north. The spatial distribution of other heavy metals shows greater variability.
(3) Both the geo-accumulation index method and the Nemerow comprehensive pollution index indicate severe heavy metal pollution in the slag heap of the Beikuang area of the Xikuangshan Tin Mine. In the waste slag, Sb and Cd pollution is severe, with Sb being the primary source of contamination in the leachate. The potential ecological risk index method indicates that heavy metals in waste slag and leachate pose extremely high and high ecological risks, respectively. Cd and Sb are the main contributing factors in waste slag, while Sb has a very high contribution rate in leachate. The control and prevention of heavy metals should primarily focus on Cd and Sb.
(4) The health risks caused by the drinking water pathway are significantly higher than those from the dermal exposure pathway, indicating that drinking water is the primary route of health risk. The non-carcinogenic risks posed by Sb and As elements are significant. The carcinogenic risks of Cr and As exceed the USEPA-recommended potential carcinogenic risk threshold of 1.00×10⁻⁴ in two populations and two pathways.

