

Introduction
Climate change and environmental issues have become the focus of global attention and have far-reaching effects on human survival and development. The increasing global pollution emissions have led to the rising temperature of the earth, triggering extreme weather, ecological damage and other problems, bringing great risks to human society and natural ecosystems [1]. In this context, all countries are exploring effective paths for green development, actively taking measures to reduce environmental pollution, and promoting green economic development (hereinafter referred to as GED). The report of the 20th National Congress of the Chinese Party explicitly proposes to promote green development and the harmonious coexistence of human beings and nature. At the same time, China has also put forward the strategic goal of “carbon peaking and carbon neutral” to promote the construction of ecological civilization and lay a solid foundation for sustainable development. Undoubtedly, the factor-driven development model, which relies on the sacrifice of the environment, is no longer suitable for the development requirements of the new era, and it is necessary to achieve a harmonious coexistence with the ecological environment while developing the economy, i.e. the pursuit of GED is an inevitable choice for China to achieve high-quality economic development and draw a grand blueprint for a beautiful China.
As a major region for economic activity and resource allocation, urban agglomerations can efficiently participate in socio-economic activities as well as possess the ability to process and distribute capital and information [2]. Urban agglomerations have closely tied business contacts and economic ties between cities, accelerate the flow of economic factors, improve resource allocation efficiency, and promote the integrated development of urban agglomerations. However, at the same time, urban agglomerations also suffer from problems such as energy consumption and environmental pollution. With the improvement of transportation facilities and the continuous strengthening of regional trade, the flow of factors between cities has become more intensive, and the flow of pollution and carbon dioxide emissions between different regions through economic trade is on the rise [3]. At the same time, due to the increasing level of urbanization, the urban population is growing and more and more end-users of goods, food, and energy are gathering in cities. Energy consumption, pollution, and greenhouse gas emissions are increasing rapidly, leading to a decline in environmental quality in cities. This trend is particularly evident in urban agglomerations with high economic and population density [4]. It can be said that urban agglomerations have the heaviest task of reducing greenhouse gas emissions.
As economic and social development spaces, urban agglomerations are important carriers, support bases and constraints for GED [4], and the level and quality of their GED have important implications for global environmental governance and sustainable development. Therefore, it is important to study how to scientifically lay out GED space within urban agglomerations to promote sustainable development and environmental governance of urban agglomerations. The Yangtze River Delta urban agglomeration, as one of the most economically developed city clusters in China, is the core region for promoting ecological green integration in the Yangtze River Economic Belt and accelerating the construction of ecological civilization. Within the Yangtze River Delta urban agglomeration, GED has become an important development direction. Therefore, we will choose the Yangtze River Delta urban agglomeration as the research object of this paper to explore the spatial association network and influencing factors of its green economic development, which will help to better understand the inter-city connection and interaction, provide a scientific basis for inter-city cooperation and exchange, and thus promote the green development of the regional economy.
The green economy is an economic model based on the ecological environment and characterized by low carbon, high efficiency, cleanliness and environmental protection, which is an important way to solve climate change and environmental problems. GED pursues the coordinated development of economic, social and environmental dimensions, which can be traced back to the theory of sustainable development. Xu (2022) and others believe that green development is a more efficient way of production [5]; Jiakui et al. believe that GED is conducive to achieving the Sustainable Development Goals (SDG) and is a “win-win” for environmental protection and economic growth [6]. Hu (2007) et al. use the data inclusion approach (DEA) to include energy, labor, capital, and GDP as input-output variables in finding energy efficiency targets for APEC economies [7]. Wang (2021) et al. use super-efficiency DEA to measure regional energy efficiency in China and used the Theil index to account for regional differences in green economic development, an approach that is generally accepted by the academic community [8]. GED has become a frontier theme and a hot area in recent years, especially with the increasing global environmental problems. Scholars have measured it based on methods such as Solow residuals, stochastic frontier (SFA) and data envelopment analysis (DEA) [9-11]. Empirical studies have argued that government intervention, environmental regulation, industrial agglomeration, foreign investment, industrial structure, human capital, and capital deepening exert a driving, inhibiting, or non-linear influence on GED [12, 13]. In addition, a considerable number of studies have used spatial autocorrelation analysis and spatial analysis models such as SDM to study the spillover effects of GED on neighboring regions from a spatial perspective pair perspective [14].
However, the existing studies still have the following problems: (1) The existing studies mainly explain or measure GED from a static resource or factor perspective, and lack the measurement and spatial and temporal analysis of the dynamic changes of green economic development. (2) Focusing on neighboring relationships while ignoring the spillover effects of non-neighboring regions. With the continuous deepening of the integrated development strategy of the Yangtze River Delta and China’s market-oriented reform, the spatial correlation effect of regional economy is becoming increasingly significant with the enhancement of commodity and production factor mobility, gradually exhibiting complex spatial correlation characteristics. The spatial correlation between regions has broken through the traditional linear pattern and presented a complex multi-threaded network structure state. In the exploration of spatial effects, existing research only considers linear spillover effects in adjacent or adjacent areas through spatial econometric analysis, neglecting the possibility of spillover effects in non-adjacent areas caused by GED, making it difficult to reflect the multi-directional spatial dependence between GED in urban agglomerations, and unable to accurately identify the status and role of each region in spatial correlation, This may lead to inaccurate estimates of the impact and contribution of GED. (3) The analysis of the factors influencing the evolution of the spatial and temporal patterns of urban GED from the perspective of complex networks and their evolutionary mechanisms still needs to be deepened.
Therefore, this paper takes the Yangtze River Delta urban agglomeration as the research object, measures the changes of GED dynamics in the Yangtze River Delta urban agglomeration from 2010 to 2019 using the SBM-GML model, and visualizes the spatial and temporal evolution characteristics, spatial association structure and influencing factors of GED in the Yangtze River Delta urban agglomeration through social network analysis method and secondary assignment procedure, in order to better capture the spatial association and influence of green economic development, to better guide the practice and policy formulation of green economic development, and to provide empirical references for promoting the ecological green integrated development process and building green ecological cities.
Material and Methods
Methods
SBM-DDF Model
Drawing on the methods of scholars such as Li Jing [15], the super efficiency SBM model is used to measure the level of GED. However, due to the fact that most studies typically use cross sections and DEA to measure environmental performance, it is impossible to obtain dynamic changes in the development of green economy. The use of GML can effectively avoid the problems of traditional ML indices not possessing cyclic transitivity and linear programming without solutions. Therefore, this study uses the GML index to more accurately measure the dynamic changes in the development of green economy, in order to better understand its trends and influencing factors. The GML formula is as follows:
(1)
The GED studied in this paper examines the coordinated relationship between capital, labor and energy inputs and economic output under the constraints of carbon dioxide emissions and environmental pollution, and is an important way to measure the results of GED in each region. The input indicators in this paper include labor, capital and energy inputs, as well as output indicators such as economic output, carbon dioxide emissions and environmental pollution. These indicators reflect the GED of cities from different aspects and help to evaluate the effectiveness and potential of GED of cities.
Specifically, the input indicators include labor (million people), capital (million yuan) and energy (kw/h) inputs. and are expressed in terms of the number of people, fixed asset investment, and total urban electricity consumption at the end of the year in each city, respectively. Among them, the capital input indicator is converted into a stock indicator by the perpetual inventory method. The measurement formula is as follows. Ki,t = Ii,t + Ki,t-1(1-δ) Where, K is the capital stock, δ is the depreciation rate, I is the total asset formation in the year. Among them, the depreciation rate is 9.6% by Jun Zhang [16]. Output indicators include expected output and non expected output, where expected output is represented by the city’s total output value (GDP, 100 million yuan), and the actual GDP of each city is calculated using the GDP deflator index based on the year 2000 to obtain the actual GDP of the remaining years. Unexpected outputs include carbon emissions (CO2), industrial wastewater (t), industrial smoke and dust (t), and industrial sulfur dioxide (t) [17-19].
Modified Gravity Model
A gravitational matrix of Gij 26×26 is used to characterize the strength of GED linkages among cities (Feng et al. 2022; Dong et al. 2023), and a modified gravitational constant k is used to characterize the direction of GED by the contribution of the GED index to the spatial linkages, so that the spatial transmission paths of specific GED enhancement can be identified. In order to eliminate weak correlations and simplify the overall network distribution, the gravitational matrix of 26 cities in the Yangtze River Delta region from 2010 to 2019 is binarized by using the mean value of each row of the Gij 26×26 gravitational matrix as the threshold value. The modified gravity model constructed is specified as follows:
Where, Gij is the gravitational strength of GED between city i and city j , k is the modified gravitational constant; Mi, Mj, denotes the level of GED of city i and city j, respectively; dij denotes the economic geographic distance between region i and region j, g denotes GDP, Dij is the economic geographic distance between cities. Considering that the spatial effect between regions is not only from a certain aspect of geography or economy, thus this paper discards the previous single geographic distance and adopts the economic geographic distance matrix, which not only considers the spatial influence of geographic distance but also reflects the objective fact that economic factors spill over between regions.
Social Network Analysis Method
This paper adopts the social network analysis method to explore the spatial correlation strength of the GED level in the Yangtze River Delta urban agglomeration. Each city is treated as a network node, and the nodes establish connections with each other through interactions. The linkage consists of a line connecting two nodes, and the collection of multiple linkages constructs the whole association network [20]. The characteristic analysis index of the association network is used to explain the spatial distribution and association characteristics of a variable or factor in the network [21].
Block model analysis as a method to analyze spatially linked networks mainly reveals the internal structure of green economic development. The iterative correlation convergence algorithm (CONCOR) is used to divide the complex network into several sub-panels, which facilitates the visual analysis of the associations and connections among the sub-panels [22]. Without loss of generality, this paper divides it into four major segments: net spillover, bidirectional spillover, net benefit, and broker. The types of roles played by the segments in overall are judged as shown in Table 1. Where gk is the number of regions in a segment and g is the number of regions in the whole network.
Research Object and Research Data
The research object of this paper are 26 cities in the Yangtze River Delta urban agglomeration from 2010- 2019. The data are mainly obtained from the China City Statistical Yearbook, China Statistical Yearbook, Jiangsu Statistical Yearbook, Zhejiang Statistical Yearbook, Anhui Statistical Yearbook, Foreign Direct Statistical Bulletin, China Regional Economic Statistical Yearbook and China Environmental Statistical Yearbook in previous years, and the interpolation method is used to make up for individual missing values.
Study on the Factors Influencing the Spatial Association Network of GED in the Yangtze River Delta Urban Agglomeration
The spatial correlation network of GED in the Yangtze River Delta urban agglomeration is the result of a combination of multiple factors. If traditional econometric models are used for empirical testing, the results will be biased due to the existence of multicollinearity among the factors. QAP can solve the above problem, which does not require the assumption that the variables are independent. Meanwhile, QAP as a nonparametric method is more effective than the existing parametric estimation methods to study the relationship between multiple independent and dependent variable matrices [23]. Therefore, QAP has been widely used in the study of network connection formation mechanism, so in this paper, in order to further investigate the mechanism of the role of spatial network relationships of the green economic development, QAP is used to analyze it’s influencing factors.
The essence of the changes in the spatial association network of GED lies in the flow and spatial reorganization of production factors and key resources. These resources are influenced by various actors, including the government, industry (enterprises), environment, and technology. Together, they shape the evolution pattern of the spatial association network in green economic development. The government plays a crucial role through macro-control measures, which guide and promote the development of the green economy by formulating relevant policies and regulations. Effective environmental regulation, for instance, can reduce pollution and resource waste, facilitating the growth of environmentally friendly industries [24]. The development of the green economy also requires the adjustment and optimization of industrial structures. This entails transitioning from traditional high-energy-consuming and high-polluting industries to clean, low-carbon, and circular economy models [25]. External development can contribute to the green economy by introducing advanced green technology, management experience, and market mechanisms [26]. Additionally, green technology innovation plays a vital role in improving resource utilization efficiency, reducing environmental pollution, and promoting industrial upgrading and transformation through research, development, and application of green technologies. This innovation is crucial for establishing a spatial association network for green economic development [27]. Furthermore, compared to traditional urbanization, new urbanization focuses on ecological environmental protection and resource utilization efficiency. It advocates for a green and low-carbon approach to urban construction and development [28].
Table 1.
Block model role types.
To further explore the role mechanisms influencing differences in green economic development, this paper focuses on existing relevant theoretical and empirical studies. It consistently highlights that China’s GED upholds a development philosophy centered around innovation, coordination, environmental sustainability, openness, and sharing. This philosophy effectively addresses the growing needs of people for a better life, with a particular emphasis on the government’s role. The government is committed to a people-oriented approach, optimizing resources and the environment, and prioritizing scientific and technological innovation. It plays a pivotal role in promoting the coordination of industrial structures, improving the quality of urbanization, and enhancing economic and social benefits, as well as social inclusion. Therefore, with reference to the existing relevant theoretical and empirical studies [29–32], we analyze the GED network in terms of government macro-control (GOV), environmental regulation (ER), industrial structure (IND), foreign development (FDI), green technological innovation (GIN), and new urbanization (URBAN), and from six perspectives, and we believe that their interactions and coordination will promote green economic development and provide support for the realization of the SDGs. The model is built as follows:
Table 2.
Block model role types.
The spatial correlation matrix of the city is f. The proxy variables of the influencing factors are described as follows: this paper adopts the proportion of public budget expenditure to the GDP of the year to characterize the level of government macro-control (GOV) of the region; the environmental regulation (ER) indicator is selected by the entropy weight method to fit the standard industrial waste removal rate into the environmental regulation indicator of this paper [33]. Industrial structure (IND): Considering that the secondary industry is the “main force” of undesired output, and generally speaking, the higher the proportion of the secondary industry, the more serious the pollution it brings, which will have a negative impact on the development of green economy. Therefore, this paper adopts the ratio of secondary industry value added to GDP to portray the industrial structure. Openness to the outside world (FDI): The proportion of actual foreign capital used to GDP is used to portray the degree of regional openness to the outside world. Green Innovation (GIN): The number of green patents output is used to measure green innovation. New urbanization (URBAN): A comprehensive urbanization assessment index system is constructed from four perspectives of economic, social, demographic and land urbanization, drawing on the method of Zhou Liang and other scholars [34].
Spatial and Temporal Characteristics of GED in the Yangtze River Delta Urban Agglomeration
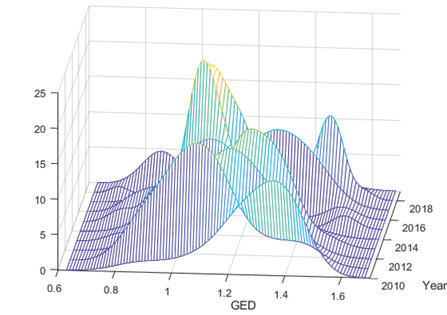
Table 1 presents the GED levels of 26 cities in the Yangtze River Delta urban agglomeration in 2011, 2013, 2015,2017 and 2019. It can be intuitively found that the GED of the Yangtze River Delta urban agglomeration fluctuates and rises from 2011 to 2019, and the overall level increases from 0.994 to 1.141, but there are obvious differences among cities. Fig. 1 shows that the center of the kernel density curve function during the examination period has roughly experienced a “right shift” from 2010 to 2013, a “left shift” from 2014 to 2016, and a “ But in general, the overall rightward shift of the curve indicates that the level of GED in the region is generally on a gradually increasing trend. In addition, the kernel density curves are all “single-peaked”, but in 2019, there are two peaks of “one large and one small”, and the peak value of the right peak is higher, which indicates that the GED level in the Yangtze River Delta region shows a polarized and high-efficiency clustering pattern during this period. Moreover, the extension of the distribution each year is gradually narrowing, indicating that the gap between the GED levels of the Yangtze River Delta urban agglomerations is getting smaller and smaller, and the spatial unevenness is weakening.
Spatial Correlation Analysis of GED in the Yangtze River Delta Urban Agglomeration
Analysis of Network Characteristics
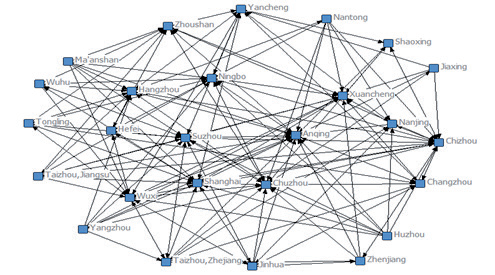
The spatial correlation network of GED is built upon the flow of factors that influence the development of the green economy. This flow is generated through complex social interactions, including the division of labor, competition, and cooperation among cities. In the network diagram, the 26 nodes correspond to the 26 cities within the GED network system. The connections between the nodes are represented by edges, each signifying the interaction and relationship of GED among cities. This paper visualizes the spatial association network of GED in the Yangtze River Delta urban agglomeration based on the modified gravity model, and because the network is more stable during the study period, Fig. 2 only shows the spatial network map in 2019. The level of GED in the Yangtze River Delta urban agglomeration shows a more obvious network structure among cities, and there are significant differences in the relationships among nodes. It is easy to see that the cities of Anqing, Chizhou, Chuzhou, Suzhou, Wuxi, Ningbo, Xuancheng, Shanghai, and Hangzhou have a higher degree of centrality, have stronger coordination control in the network, and are in a relatively central position. This may be due to the fact that the GED indexes of the above cities are more highly ranked in the Yangtze River Delta urban agglomeration and have more associated relationships.
The spatial network structure characteristics of GED of each city economy are shown in Table 3, and the network density hovers around 0.291 from 2010 to 2019 with basically no fluctuation. This indicates that the spatial linkage of GED in the Yangtze River Delta cities is relatively stable, but there is much room for improvement. The correlation degree is 1 from 2010 to 2019, indicating that the network connectivity of GED in the Yangtze River Delta urban agglomeration is very good and there are no cities that develop in isolation. The network efficiency is around 0.663, and the redundant connectivity among cities is stable. The network hierarchy degree is 0.148 and the recent upper limit is 0.997, which indicates that there is a certain hierarchy between regions with asymmetric spillover relationship, but the hierarchy relationship is weak, which helps to promote the smooth inter-city connection channels. Combining the indicators, it is easy to see that the network indicators of GED in Yangtze River Delta cities are relatively stable during the period of 2010- 2019.
Table 3.
Network density and correlation analysis of GED in the Yangtze River Delta cities.
Block Model Analysis
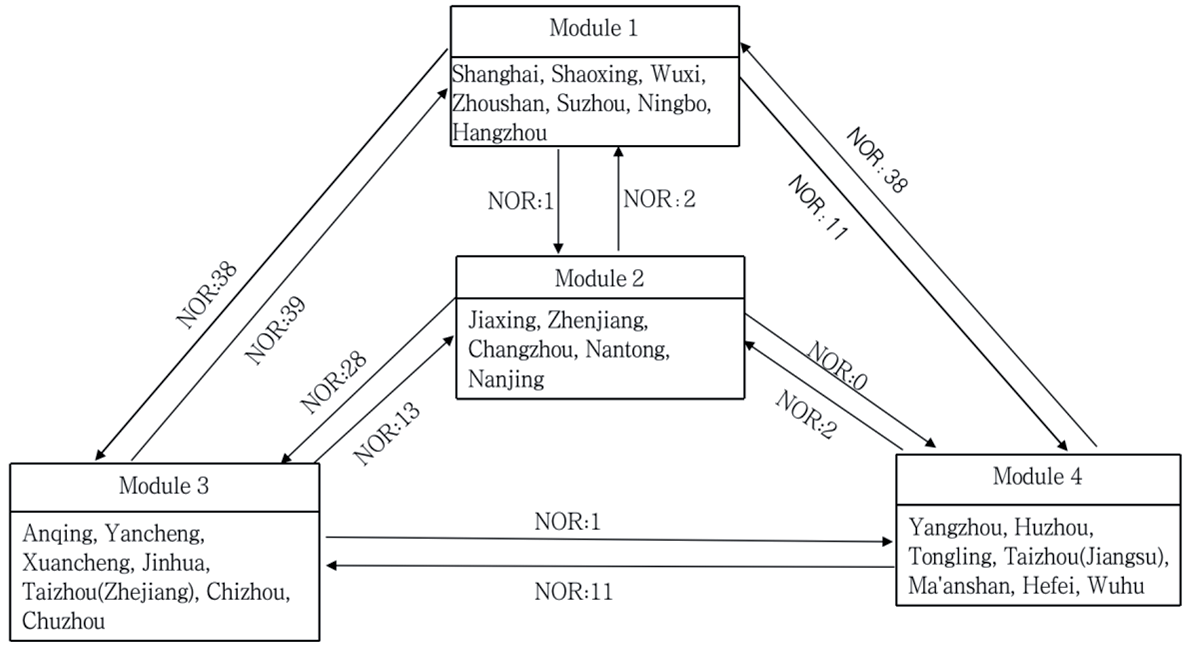
Block model analysis is used to analyze the spatial association network of GED in the Yangtze River Delta urban agglomeration, and it is divided into four segments to study the distribution of its spatial association network (Table 4 and Fig. 3). Plate I include seven cities: Shanghai, Shaoxing, Wuxi, Zhoushan, Suzhou, Ningbo, and Hangzhou; Plate II includes five cities: Jiaxing, Zhenjiang, Changzhou, Nantong, and Nanjing. Plate III includes 7 cities of Anqing, Yancheng, Xuancheng, Jinhua, Taizhou (Zhejiang), Chizhou, and Chuzhou, and plate IV includes 7 cities of Yangzhou, Huzhou, Tongling, Taizhou (Jiangsu), Maanshan, Hefei, and Wuhu. The total number of relationships in the spatial association network of urban GED in 2019 is 189, the number of external relationships between plates is 184, and the number of internal relationships is 5, indicating that the GED between plates has obvious spatial spillover effect. Among them, the number of external spillover relations of plate 1 is 50, the number of internal relations is 0, the number of external relations of plate 1 is 79, and the proportion of expected internal relations is 24%, which indicates that this plate both receives and spills over relations to other plates, but relatively speaking, the intensity of acceptance ranks the highest, so it belongs to the “main beneficiary” plate”. The total number of overflowing relationships in board 2 is 46, and the number of accepting and overflowing to other boards is 16 and 30, respectively, which indicates that this board receives connections from external members and sends relationships to other boards, and mainly inter-board relationships, so it is a “broker” board. The third board also receives and sends connections and has a greater spillover strength to other boards, so it is a “two-way spillover” board. The number of overflowing relationships to other sectors is 51, which is much higher than the number of receiving relationships, so it is a typical “net overflow” sector.
Table 4.
Spillover effects among the four major sectors of GED in Yangtze River Delta cities.
Table 5.
Density matrix and image matrix among the four segments of GED in Yangtze River Delta cities.
To examine the correlation between the plates in-depth, the density matrix was calculated based on Table 4. The density matrix can be transformed into a like matrix, i.e., the plate with a local network density greater than the whole (0.291) is assigned a value of 1, and the opposite is 0. Therefore, the relationship between the plates can be described by comparing the results in Table 5 and Fig. 3. It can be seen that the plates are closely connected and the spillover relationship is obvious. This may be closely related to the increasing interconnection of transportation facilities in the Yangtze River Delta urban agglomeration, the continuous improvement of urban energy level, the accelerated free flow of various factors, and the continuous promotion of ecological and green integrated development process. Specifically, the members of the “main beneficiary” segment are mainly located in the southeastern part of the Yangtze River Delta urban agglomeration, such as Shanghai, Suzhou, Ningbo and other areas adjacent to the sea, and this segment shows a strong “receiving effect” and “spillover” with other segments. This may be due to the fact that the regional governments of a member of the plate pay more attention to environmental issues, have a more comprehensive urbanization coverage, and have a more optimized and upgraded industrial structure, which can easily produce stronger spatial linkages and thus promote the development of the economy. However, in general, the polarization effect is greater than the trickle-down effect, and it still has a strong ability to absorb the resources and factors needed for the development of the green economy in other cities; the members of the “broker” plate are mainly distributed in the periphery of the cities adjacent to the sea in plate one and in the middle of the Yangtze River Delta urban agglomeration, which are the “hubs” and “bridges” in the network. The members of the “broker” segment are mainly located in the periphery of the cities adjacent to the sea and in the middle of the Yangtze River Delta urban agglomeration, and are the “hubs” and “bridges” in the network, which form a more complete transportation network and have strong population mobility, effectively enhancing the connectivity of GED among cities within the urban agglomeration and providing good geographical advantages for the spatial overflow of other segments; “two-way overflow” the members of the “two-way spillover” segment are mainly distributed in the periphery of the Yangtze River Delta urban agglomeration and play the role of “first driver” in the network, and the cities within the segment have spillover effects on most cities outside the segment, and the spillover effects are mainly on the main beneficiary segment; “net spillover” the members of the “net spillover” plate are mainly distributed in the middle of the Yangtze River Delta urban agglomeration, in the middle of the broker and two-way spillover plate, and the way of association to other plates is mostly “spillover” exchange, which indicates that in the association network of GED of the Yangtze River Delta cities, most of the production resources of GED spillover, but the related resources are less introduced. However, the related resources are less introduced.
Analysis of the Factors Influencing the Spatial Correlation Network of GED in the Yangtze River Delta Urban Agglomeration
Precise identification of the formation mechanism of the spatial correlation network of GED is important to accelerate the construction of green and low-carbon cities and thus promote green and high-quality development. Since the spatial correlation matrix of GED and the respective variable matrices are “relational” data matrices, the general regression method cannot be used to test the interrelationship between variables, so this paper chooses the quadratic assignment procedure in social networks to study the regression relationship between multiple matrices and one matrix, i.e., through the QAP (Quadratic Assignment Procedure) regression. Quadratic Assignment Procedure (QAP) regression analysis method to explore the influencing factors of the spatial association network of GED in the Yangtze River Delta urban agglomeration and the results are shown in Table 6. As shown in Table 8, the six influencing factor variables in the regression results can explain the changes in spatial correlation of GED in the Yangtze River Delta urban agglomeration.
In general, the regression coefficients of government macro-control, environmental regulation, industrial structure, external development, green innovation, and new urbanization level are all positive, among which, government macro-control and industrial structure pass the 1% significance level in different years.
Overall, the regression coefficients of government macro-regulation, environmental regulation, industrial structure, external development, green innovation, and new urbanization level are all positive, among which, government macro-regulation and industrial structure pass the 1% significance level in different years.
Government macro-control is an important tool to promote the formation of the spatial network of GED in the Yangtze River Delta urban agglomeration. Government fiscal expenditure is a key instrument of government macro-control. Government fiscal expenditure can be used to subsidize the R&D of green industries and environmental protection technologies, promote the development of green industries, and accelerate the formation of spatially linked networks. It can also be used to improve the urban environment and enhance the quality of life of citizens, which in turn promotes public recognition and support for the green economy. In addition, the government’s fiscal expenditure can be used to promote the construction of green infrastructure, such as promoting the development of green transportation and reducing urban carbon emissions. As a leader in China’s economic strength and regional competitiveness and a pioneer in the development of China’s green economy, the Yangtze River Delta urban agglomeration plays an important role in government macro-control in promoting its GED. Through the implementation of the Yangtze River Delta Ecological Green Integrated Development Demonstration Zone and ecological compensation, compensates for market failures, promotes the flow of resources for GED and enhances the level of the green economic development. In addition, it also guides green investment and green consumption through tax regulation and loan policies to promote the development of a green economy and accelerate the formation of a spatial network for GED in the Yangtze River Delta urban agglomeration. It is worth mentioning that the government’s macro-control has a “marginal decreasing” effect during the sample period, i.e., the effect of the policy gradually decreases as the policy increases.
The impact of environmental regulation on GED in the Yangtze River Delta region changes gradually from insignificant to positive during the sample period. This may be due to the fact that government support for GED takes some time to work and produce effects. However, in the long run, environmental regulation contributes to the development of the green economy.
This is because the government’s mandatory measures in environmental regulation can motivate enterprises to adopt more environmentally friendly production methods, reduce pollutant emissions, and lower environmental pollution, thus promoting GED. In addition, the government can encourage companies to adopt environmental measures and raise their environmental awareness through environmental incentives and penalties. These policies can generate environmental incentives and thus promote the development of the green economy.
Industrial structure has the most significant role in promoting GED, which is reflected in the regression coefficients, probably because the optimization and coordination of industrial structure have an important role in the development of green economy. During the study period, with the transfer of resource factors such as labor, capital and energy from agriculture to manufacturing and service industries, the industrial structure developed from low to high levels, and the distribution and utilization of resource factors became more reasonable and efficient, reducing resource waste and ecological damage, and promoting the green and low-carbon development of industries. Specifically, as the industrial structure is upgraded and optimized, the proportion of green industries and environmental protection industries gradually increases, and industries with high pollution, high energy consumption and high emissions gradually decrease, thus greatly reducing the degree of environmental pollution and ecological damage. At the same time, the emerging green industries and environmental protection industries also drive technological innovation and technological progress, improve production efficiency and product quality, and enhance the market competitiveness and sustainable development ability of enterprises.
Overall, opening up to the outside world helps the GED of the Yangtze River Delta urban agglomeration. High-quality foreign development can improve the level of GED of the Yangtze River Delta urban agglomeration through a spillover effect, demonstration effect and competition effect. Green technology innovation is the “key” to breaking the resource and environmental problems and promoting the development of green economy. Green technology innovation helps to reduce environmental pollution by improving resource utilization efficiency. The correlation network of new urbanization level for the green economic development. New urbanization, as green, inclusive and sustainable urbanization, brings a large amount of capital and technology diffusion dividends for urban development, which optimizes the driving force of urban GED by accumulating physical, intellectual and human capital, and thus promoting green economic development.
Conclusion and Discussion
This study takes the Yangtze River Delta urban agglomeration as the research object, based on the scientific measurement of the GED level and combined with the modified gravity model to explore the degree of association on the GED of each region; further adopts the social network analysis method and the second assignment procedure to examine the overall structural characteristics, individual structural characteristics and formation mechanism of the spatial association network of GED.
It is found that the correlation network of GED in the Yangtze River Delta urban agglomeration shows complex network structure characteristics, but the network is more stable, and the network density is low but the network connectivity is good. Among the individual networks, cities such as Chihuahua, Nanjing, Shanghai, Hefei and Hangzhou play a crucial role in the spatial association network and can form a strong control over other cities. From the analysis of the block model, the cities in each segment communicate closely, and the southeastern part of the Yangtze River Delta urban agglomeration is the most active area adjacent to the sea, which is both the main inflow area and the main inflow area; the periphery of the Yangtze River Delta urban agglomeration plays the role of the “first driving force” in the network; while the central location effectively enhances the connectivity within the urban agglomeration, and some cities show obvious spillover effect.
Government macro-control, environmental regulation, industrial structure, external development, green innovation, and new urbanization level have significant effects on the formation of the spatially linked network of GED in the Yangtze River Delta urban agglomeration. In contrast, the industrial structure has the greatest influence on the formation of the spatial association network of GED in the Yangtze River Delta urban agglomeration. And the role of government macro-control in promoting the correlation network of GED becomes increasingly obvious over time.
Table 6.
Regression structure of influencing factors of GED in Yangtze River Delta cities.
Based on the research findings, the following countermeasures are proposed: 1. Strengthen the GED concept of ecological green spatial integration, strengthen the cooperation and communication among cities, establish a linkage mechanism, jointly promote the GED of the Yangtze River Delta urban agglomeration, achieve mutual benefits and win-win situation among cities, and further promote the formation of the spatial linkage network of green economic development. 2. According to the status and roles of different cities in the network, according to local conditions, reasonable division of labor and mutual promotion, to further improve the level of coordinated development of the regional green economy. For example, the southeastern cities should strengthen the spatial radiation effect of the core cities and play the role of demonstration and leadership; the central cities should take over the spillover effect of the peripheral cities of the Yangtze River Delta urban agglomeration, strengthen the exchange and research with the neighboring and leading cities, and give full play to the learning effect; the peripheral cities of the Yangtze River Delta should continue to play the role of “the first driving force” and provide the GED opportunities to the eastern cities in 3. Promote the improvement of GED through government macro-control, environmental regulation, industrial structure, external development, green innovation, and new urbanization level. In the process of promoting the development of a green economy in the Yangtze River Delta urban agglomeration, the government should strengthen policy guidance and regulation, support and stimulate technological innovation and talent training; at the same time, promote industrial transformation and upgrading, encourage enterprises and the public to participate in the development of green economy, improve the environmental protection awareness and environmental protection action power of the whole society, and jointly promote the development of green economy in the Yangtze River Delta urban agglomeration.

