

Introduction
China is the world’s major rare earth country [1], accounting for half of the global rare earth reserves [2]. Since the 1980s, China has gradually replaced the United States and become an important international supplier of rare earths [3]. After more than a decade of development, China’s rare earth industry has made significant progress. However, due to the lack of awareness of patent protection and rare earth innovation in the early stages of China’s rare earth industry [4], coupled with Japan’s rare earth patent barriers, China’s overall position is in the middle-to-low end of the global rare earth value chain [5]. During the National People’s Congress and the Chinese People’s Political Consultative Conference in 2023, there was once again an emphasis on “enhancing the scientific and technological innovation capabilities of the rare earth industry”. Protecting rare earth resources and promoting China’s transition from a major rare earth country to a rare earth powerhouse has attracted widespread attention from the Chinese government [6].
Regarding the research on the rare earth industry, scholars have mainly analyzed, from the perspective of rare earth demanders, problems in global rare earth supply [7], China’s role in the rare earth supply and China’s rare earth policies [4, 8], the industry of future global rare earth demand [9], the economic and social issues caused by rare earth mining, and the importance of rare earth reserves [10]. However, the rare earth industry seems to have not been widely used in innovation network research.
A review of the relevant literature finds a wealth of research on innovation networks, resulting in abundant findings. Theories such as regional innovation system theory, complex network theory, and collaborative innovation theory have provided a solid theoretical foundation for the study of innovation networks [11]. Co-authored papers and co-invented patents serve as the primary sources of quantitative data for innovation network research [12, 13]. Research on the structural characteristics of innovation networks mainly focuses on the overall characteristics of the network, network positions, and network relationships. In the research on the overall characteristics of innovation networks, indicators such as network density, average clustering coefficient, network centralization, and modularity have been used in studies [14]. In research on the position of innovation networks, most scholars have used indicators such as closeness centrality, betweenness centrality, and constraint to explore the position of nodes in innovation networks [15]. In the study of the relationships in innovation networks, scholars have determined the characteristics of knowledge flow between innovation network nodes based on the one-way or two-way characteristics of the relationships between these nodes and analyze the relationship characteristics within the network based on collaborative strength [16].
As dynamic open systems, innovation networks are constantly evolving and optimized due to the changing internal and external environments of an innovation network. Accordingly, the study of the dynamic evolution of networks has gradually become a research hotspot among scholars. The structural characteristics of networks have been studied mostly from organizational dimensions (based on node types such as companies, universities, and research institutes) [17], technological dimensions (including information technology, communication technology, new energy technology, and other technological categories) [18, 19], and spatial dimensions (including cross-national, cross-provincial, cross-municipal, and other cross-regional collaboration and innovation) [20]. Regarding the research on factors influencing innovation networks, scholars have mainly discussed two aspects: the internal structural factors of the network and the external environment. In terms of the influence of the internal network structure, attributes such as the centrality and structural holes of network nodes have a large influence on the connections between the nodes. The connection and even the whole network will have a greater impact, and core nodes in particular play a crucial role in driving the development of the entire network [21, 22]. As for the factors related to the external environmental influence on networks, moderate proximity, such as cognitive proximity and social proximity, has an important impact on innovation networks [23]. In addition, the economic and social environment where the nodes are located also significantly influences innovation networks [24].
Based on a review of previous studies, there is a lack of research on innovation networks from the provincial perspective. Furthermore, research on innovation networks has mostly focused on individual levels, e.g., country, province, urban agglomeration, urban area, or rural area [16], with few analyses of the structural characteristics of China’s rare earth innovation network (REIN) from a multi-level perspective. Therefore, using China’s rare earth patent collaboration data to explore the spatial dynamics of China’s rare earth collaboration, problems can be identified from a novel perspective, thus helping to clarify China’s current technological accumulation in the rare earth sector. In addition, an in-depth analysis of the pattern evolution of the REIN at two different spatial scales (provincial and municipal levels) contributes to promoting the innovation and development of China’s rare earth industry and provides strategic guidance for its advancement.
This study provides the following marginal contributions. First, this study enriches the practical connection between social network analysis methods and innovation geography theory through two spatial scales, provincial and municipal, in China’s REIN. Secondly, the study of China’s REIN enriches the study of innovation network theory; finally, the analysis of the influencing factors affecting China’s REIN provides strategic basis for technological innovation by the government and relevant functional departments of the rare earth industry.
The structure of the other sections of this paper is as follows. Section 2 describes the research data and methods, Section 3 resents the research results and discussion, and Section 4 gives the research conclusions and policy suggestions.
Research Data and Methods
Research Data
The data in this study were derived from the Incopat global patent database. The patent abstracts in the database were searched for keywords related to rare earths. First, patents that were not related to rare earths were excluded; second, patents with natural persons as patent applicants, owned by foreign companies, or with only one applicant were eliminated. A total of 6435 patents from 2001 to 2020 met the requirements. In the analysis of patent collaborations, a distinction was made between the first and non-first patent applicants. Collaborations were divided into two categories: collaborations led by the first patent applicant and collaborations involving non-first patent applicants, forming a directed data matrix representing the collaborative innovation among patent applicants1. To present the evolution characteristics of the REIN as objectively as possible and to avoid differences in some special years, a more scientific approach network was adopted to demonstrate innovation development, that is, the study period was divided into four-year intervals: 2001-2005, 2006-2010, 2011-2015, and 2016-2020.
Research Methods
Social Network Analysis for the Structural Evolution of China’s REIN
Social networks were used to analyze the changes in indicators (e.g., centrality, network density, average clustering coefficient, and centralization) of the REIN to reveal its characteristics [25]. In particular, we evaluate node symmetry which was calculated based on the concept of effective flow rate [26]:
where Ai is the effective flow rate of a province or city, Ii is the number of rare earth innovation collaborations in which province or city i participated, and Qi is the number of rare earth innovation collaborations led by province or city i. When Ai is -1, province or city i is a main participating region for rare earth innovation, and when Ai is 1, province or city i is a core leading region for rare earth innovation.
Geographical Detector Analysis for the Influence Factors of China’s REIN
The geographical detector method is a spatial analysis model used to explore the relationship between a certain geographical attribute and its explanatory factors. It is widely applied to explain the influencing factors of various phenomena. The advantage of this method is that it is less constrained by prerequisites when analyzing multiple types of data [27, 28]. The equation is as follows:
where q is the detection value of the influencing factor on the centrality of China’s REIN; h = 1, ..., L denotes the classification of each factor of the variable; σ2 is the total variance in the centrality of China’s REIN at the provincial and municipal levels; σh2 is the variance in the centrality of China’s REIN at provincial and municipal levels, respectively; N is the number of provinces or cities in China; and Nh is the number of types of the influencing factor X. The value range of q is [0, 1], and a larger value indicates a greater influence of the factor on China’s REIN at the provincial and municipal levels.
Results and Discussion
Results
Analysis of the Overall Characteristics of the Network
As seen in Table 1, the connection and diversification of China’s REIN are gradually increasing. Both at the provincial or municipal levels, the number of nodes and connections in the network has increased substantially, indicating clear growth in the number of provinces and cities participating in rare earth innovation. The outdegree centralization and indegree centralization of the networks have been decreasing year by year, with the outdegree centralization being greater than the indegree centralization, a finding that indicates that the leading nodes in the REIN are more concentrated in a few provinces and prefecture-level cities, reflecting a greater influence of the leading nodes on the REIN. The average clustering coefficient of the networks shows an upward trend, indicating closer collaborative innovation among the nodes in the network. At the provincial level, the network modularity and average distance decreased from 0.272 and 2.336 in the 2001- 2005 period to 0.231 and 2.033 in the 2016-2020 period, indicating that in provincial-level collaboration networks, the degree of group differentiation within the network increased significantly over time, and the number of edges passed to complete collaboration between provinces decreased, improving collaboration efficiency; in contrast, the municipal-level collaboration networks exhibited the opposite trend, a finding that could be related to factors such as administrative boundaries and proximity.
Analysis of the Spatial Pattern of the Networks
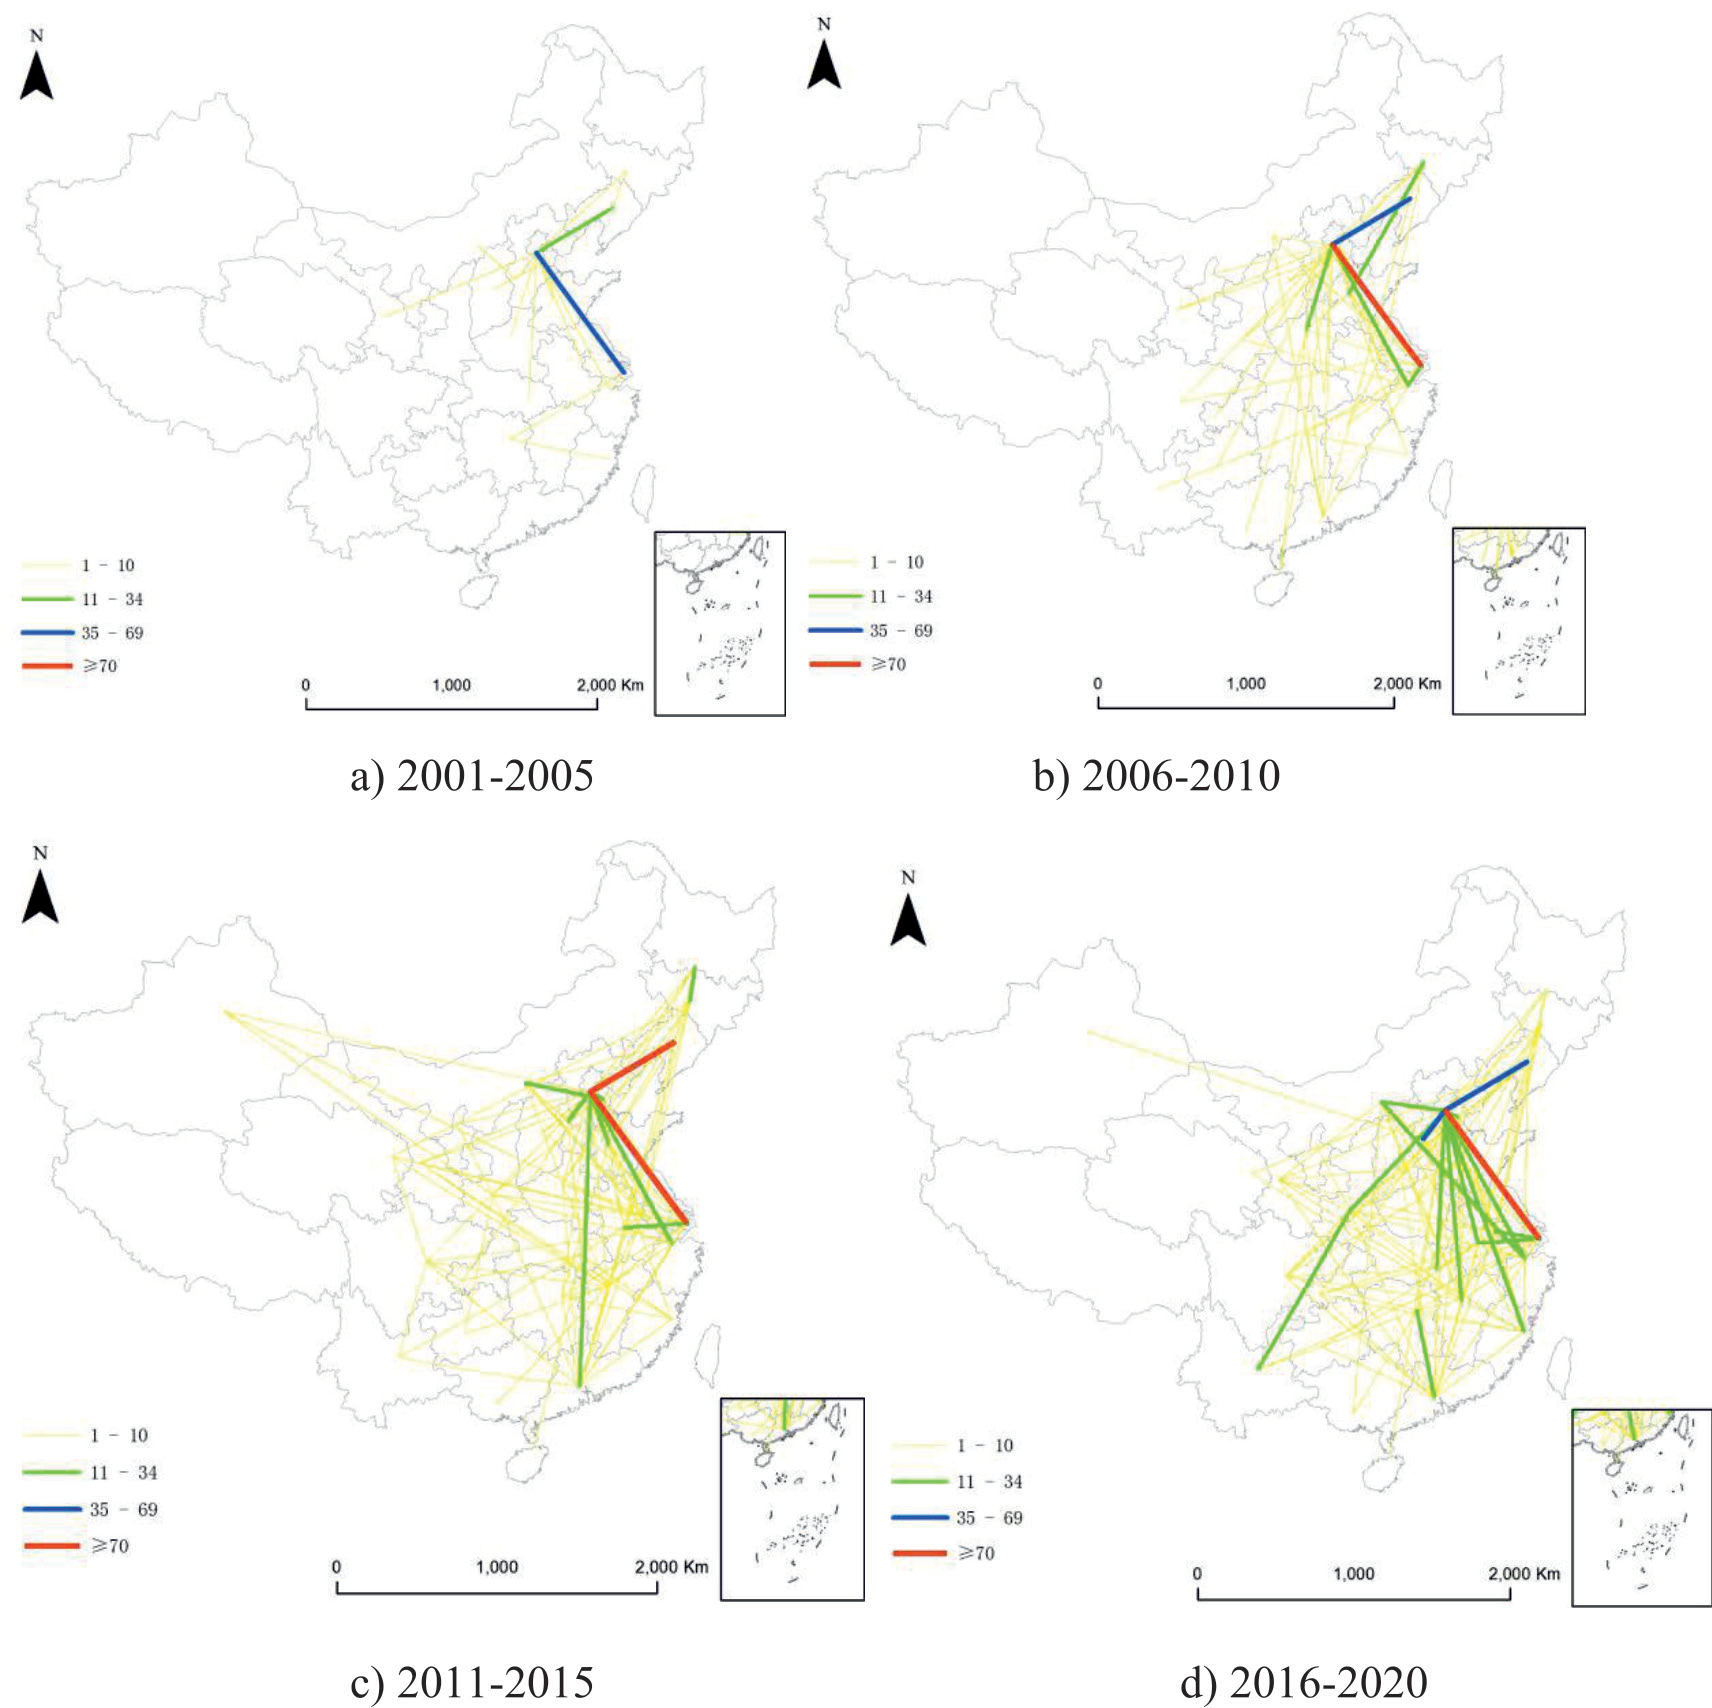
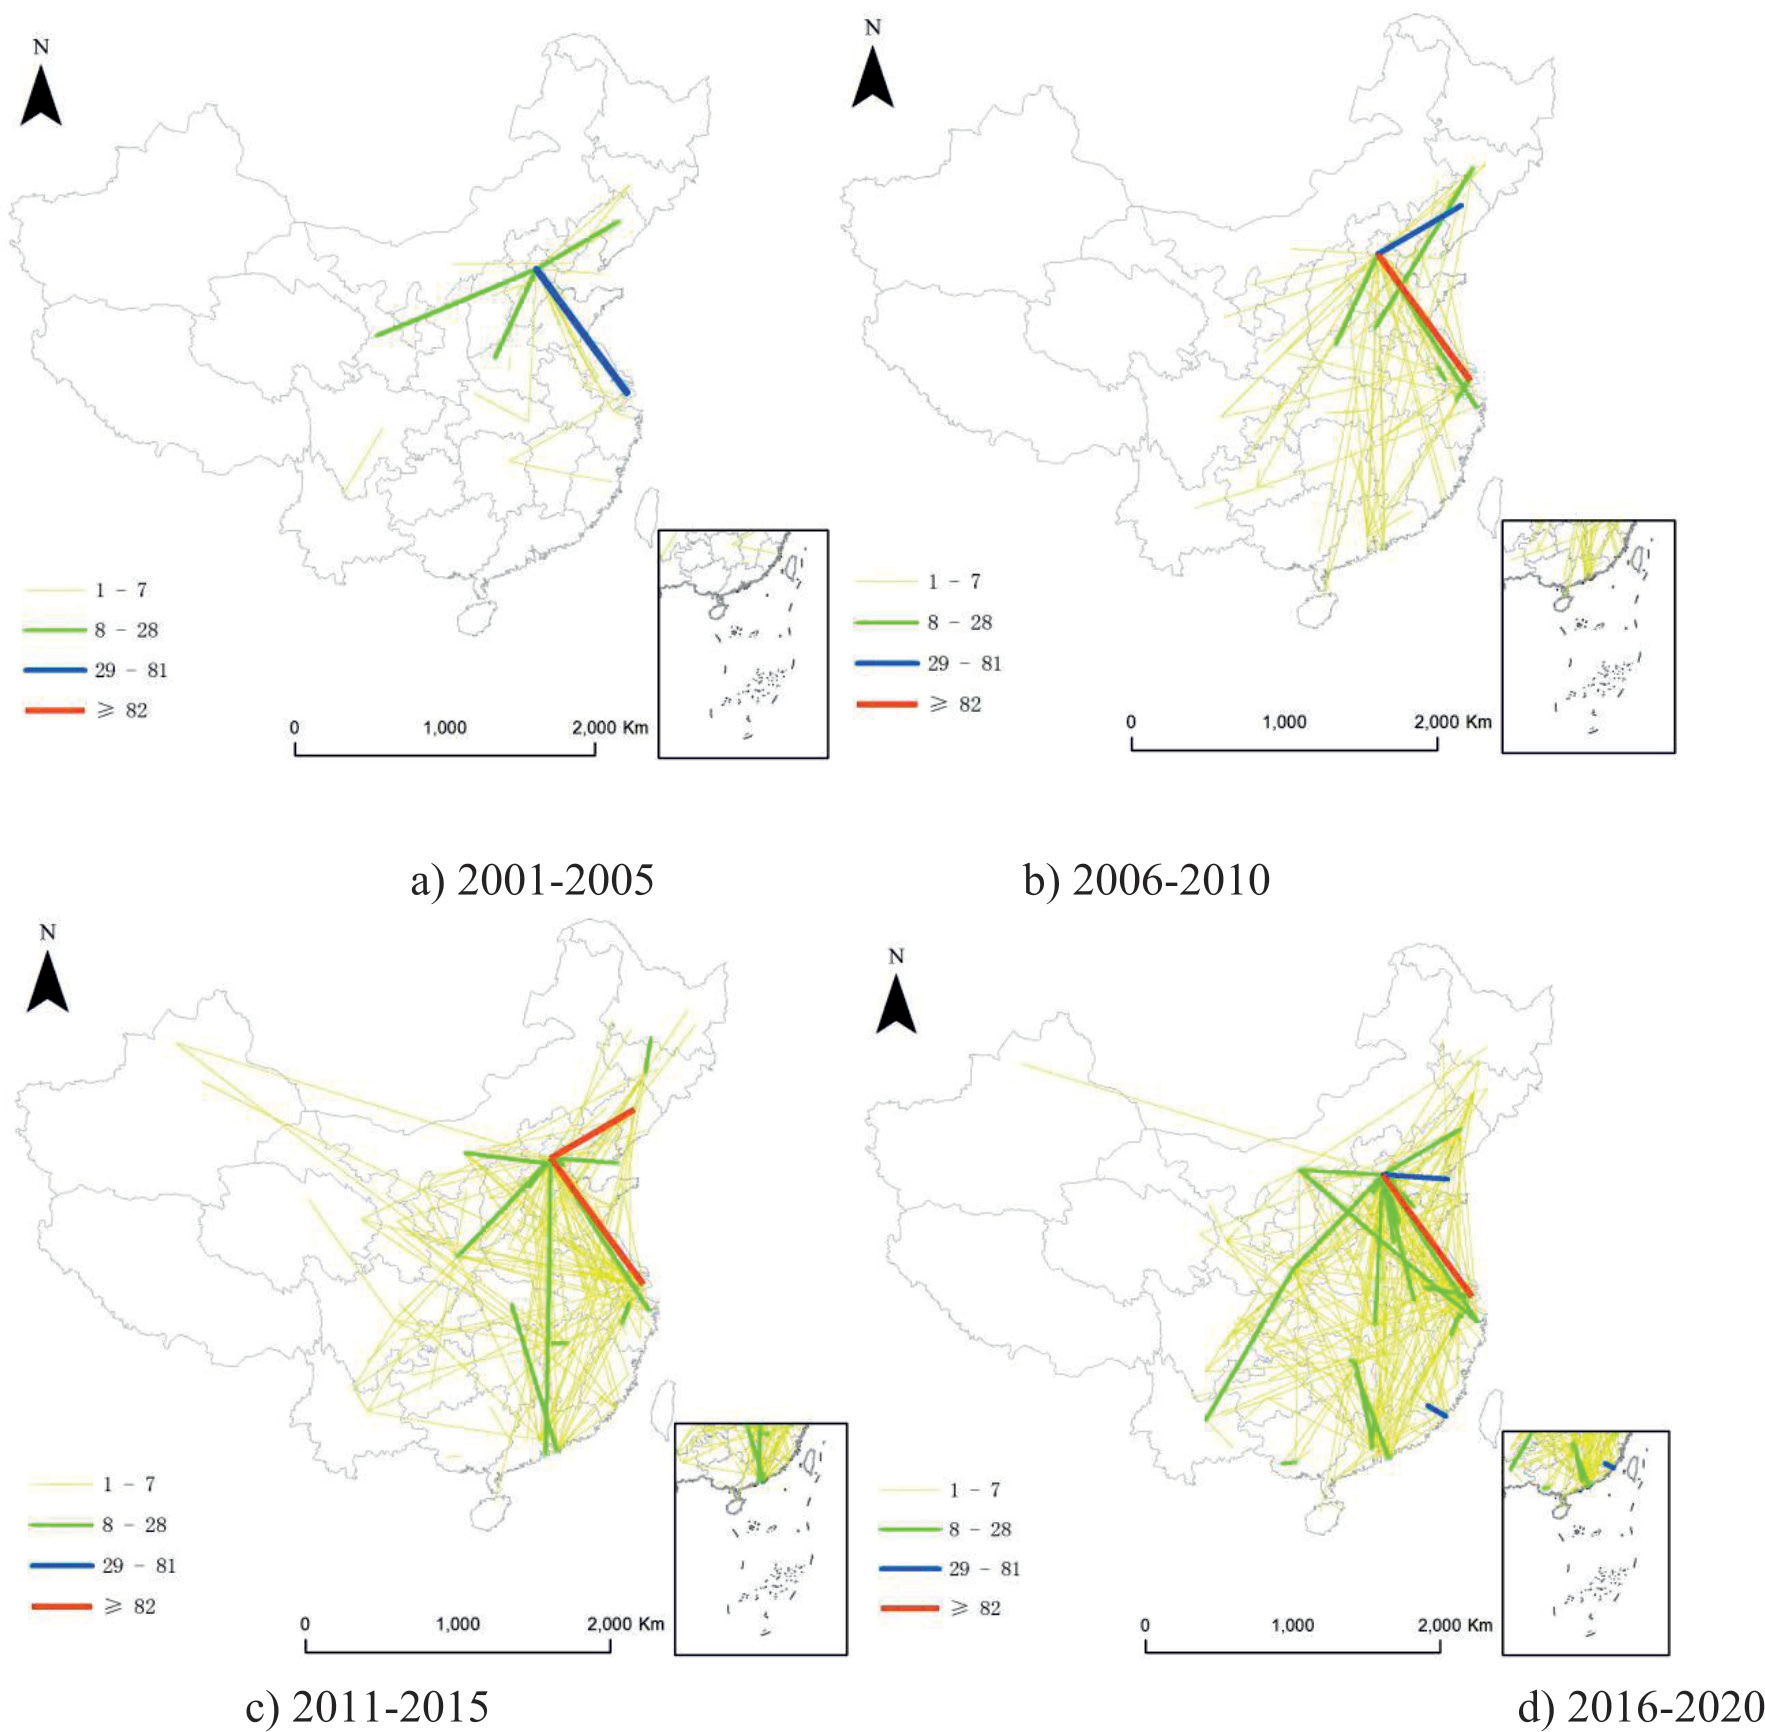
Using data from 2016 to 2020 as a baseline, the REIN was divided into four tiers based on strength of connections using the natural breakpoint method in ArcGIS; then, the results were visualized.
At the provincial level, the REIN basically formed a radial spatial pattern centered on Beijing. From 2001 to 2005, connections existed only at first to third tiers, and from 2011 to 2015, connections were missing at the third tier. Based on the spatial distribution, there existed only a few high-tier (third and fourth tier) connections, which were mainly concentrated in four provinces (Beijing, Shanghai, Liaoning, and Hebei) in eastern China. The second-tier connections only expanded from coastal provinces in the east to central and western provinces in the 2016-2020 period, resulting in a generally sparse network in western regions. The network density increased from 0.087 to 0.18, indicating further improvement in the development of the network. Specifically, the connection between Beijing and Shanghai was outstanding in all four stages, with the connection strength increasing from 48 in the 2001-2005 period to 158 in the 2016-2020 period, far surpassing the strength of the second-ranked connection. In the 2016-2020 period, the connections (strength) in the third tier were Beijing→Hebei (69) and Beijing→Liaoning (46), and more than 60% of the connections in the second tier linkage lines were connected to Beijing, highlighting the importance of Beijing in the REIN.
At the municipal level, the spatial pattern was basically similar to that at the provincial level. In terms of spatial distribution, the second tier expanded from being only located in the eastern coastal cities to the central cities in the 2006-2010 period and extended to the western cities between 2011 and 2015. Specifically, Beijing→Shanghai ranked as fourth tier in all four stages. From 2011 to 2015, Beijing→Fushun was also in this tier; from 2016 to 2020, the connections (strength) in the third tier included Xiamen→Longyan (81), Longyan→Xiamen (44), and Beijing→Langfang (3). In terms of administrative jurisdiction and proximity, except for Xiamen and Longyan, the rest of the city pairs are not in the same province and not bordering cities, indicating that geographic proximity is not the main influencing factor affecting the REIN. Comparing the network spatial pattern at the two levels, except for Longyan-Xiamen, other city pairs were composed of cities in different provinces or composed of non-bordering cities, suggesting that geographical proximity is not the major influencing factor for the REIN.
Table 1.
Overall characteristics of the REIN from 2001 to 2020.
Comparing the network spatial patterns at the two levels, except for Longyan-Xiamen, the node pairs with higher rare earth innovation connection strength are less geographically adjacent, indicating that the REIN overcomes the limitation of spatial geographical distance.
Analysis of Network Node Characteristics
To demonstrate the spatial characteristics of the most recent nodes in China’s REIN and due to the space limitation of the article, the following sections only analyze the period from 2016 to 2020 to provide constructive suggestions based on the latest node characteristics.
(1) Analysis of network node centrality
Using the natural breakpoint method, the centrality of REIN nodes was divided into four tiers, as shown in Fig. 3. As seen in Fig. 3 and Table 2, at both the provincial and municipal levels, the centrality of Beijing ranked first and was much higher than that of Shanghai, which ranked second. At the provincial level, Shanghai ranked in the second tier for centrality; 11 provinces, including Guangdong, Jiangsu, Hebei, and Shandong, which are mainly located in the central and eastern regions of China, ranked in the third tier for centrality; and the remaining provinces had relatively low centrality and ranked in the fourth tier. At the municipal level, Shanghai, Xiamen, and Longyan ranked in the second tier for centrality; 14 cities, including Tianjin, Baotou, Xi’an, Guangzhou, and Ganzhou, ranked in the third tier for centrality; and the remaining cities had relatively low centrality and ranked in the fourth tier.
Combining the REIN at the two levels, the REIN was clearly characterized by coastal and resource agglomeration. Specifically, provinces or cities in the first and second tiers for centrality were located in the eastern coastal areas of China, and those in the third tier were located in the central and eastern regions of China. Unlike previous studies, our study found that not all provinces or cities with high centrality in the REIN had a high level of economic development. For example, provinces such as Jiangxi and Inner Mongolia as well as cities such as Longyan, Baotou, and Ganzhou are regions with abundant rare earth resources and relatively high levels of rare earth research and technology, including the Baotou Research Institute of Rare Earths in Baotou, Inner Mongolia, the Fujian Changting Golden Dragon Rare Earth Co., Ltd. in Longyan, Fujian, and the Institute of Rare Earths, Chinese Academy of Sciences in Ganzhou, Jiangxi, which are authoritative rare earth research institutions in China. In addition, although Fujian ranked in the fourth tier for centrality among provinces, Longyan and Xiamen were in the second tier for centrality, and other cities were in the fourth tier for centrality, reflecting substantial polarization in the level of rare earth innovation collaboration among cities in Fujian.
(2) Node symmetry analysis of the network
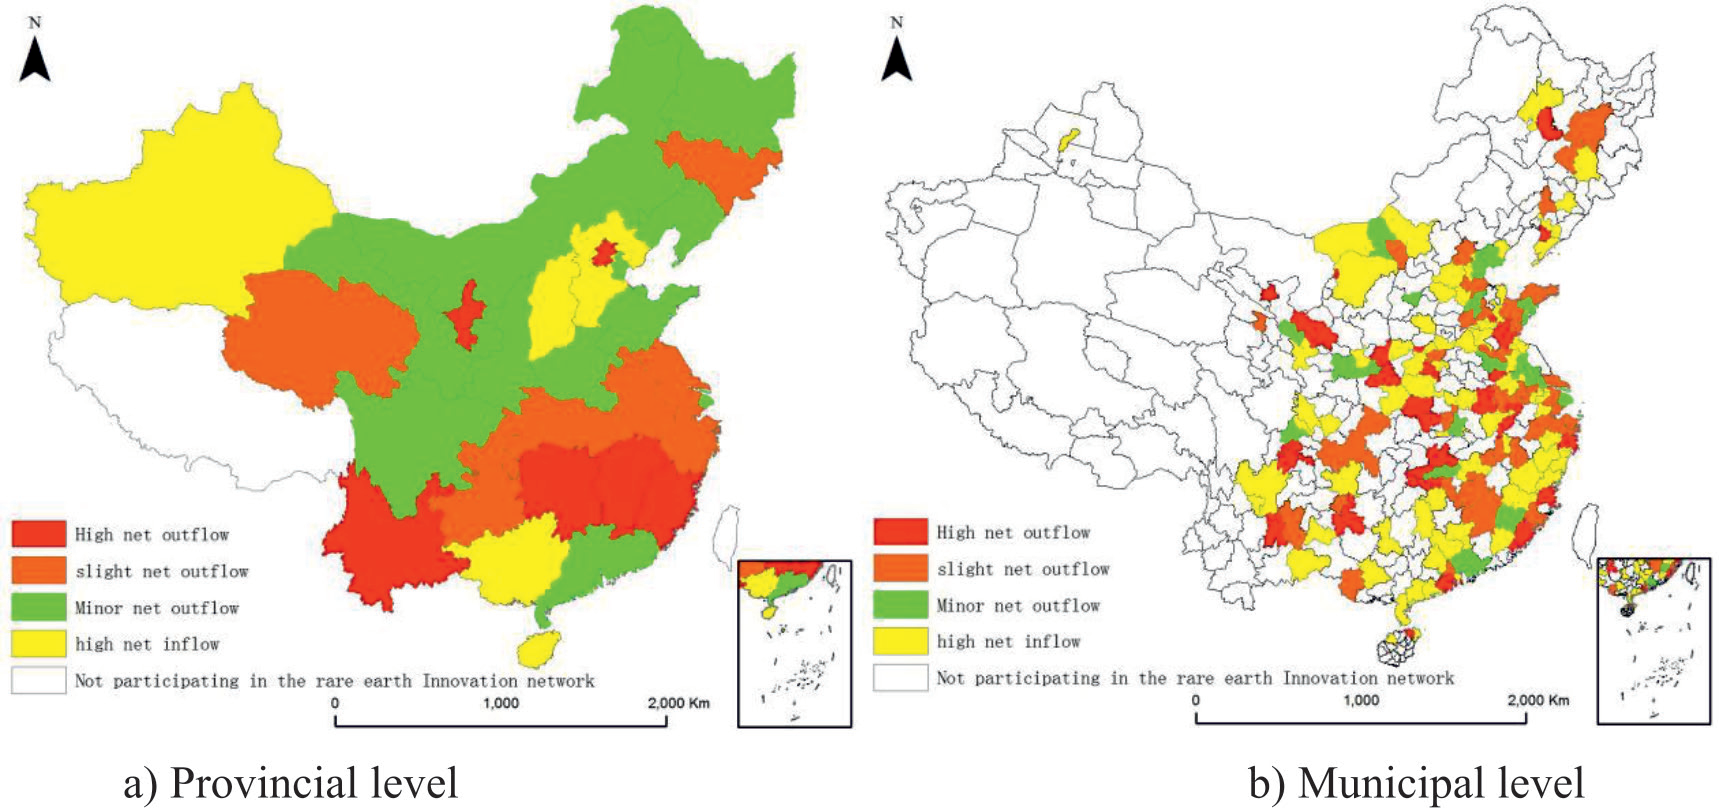
The natural breakpoint method was used to divide the node symmetry of the REIN into four tiers, as shown in Fig. 4. The net outflow nodes are the leading nodes in the REIN, and the net inflow nodes are the participating nodes. At the provincial level, there were 14 provinces with a net outflow of rare earth innovation and 16 provinces with a net inflow. Among the net outflow provinces, Ningxia, Yunnan, Beijing, Jiangxi, Fujian and Hunan had high net outflows and played leading roles in rare earth patent collaboration and, hence, in the innovation network, and Jilin, Qinghai, Zhejiang, and Jiangsu had moderate net outflows. Among the net inflow provinces, Hebei, Hainan, Shanxi, Xinjiang, and Guangxi had high net inflows, indicating that these provinces played participatory roles in patent collaboration, and Guangdong, Shanghai, and Liaoning had moderate net inflows, with Shanghai’s centrality ranking in the second tier. At the municipal level, there were 73 cities with a net outflow of rare earth innovation and 94 cities with a net inflow. Cities with high net outflows and cites with high net inflows were relatively scattered in spatial distribution. Cities with high net outflows included Zhuhai, Fuzhou, Quanzhou and other cities with relatively high levels of economic development as well as cities with average levels of economic development such as Baiyin and Qiannan. Cities with high net inflows included 74 cities, such as Liangshan, Jilin, Changzhou, and Baoding.
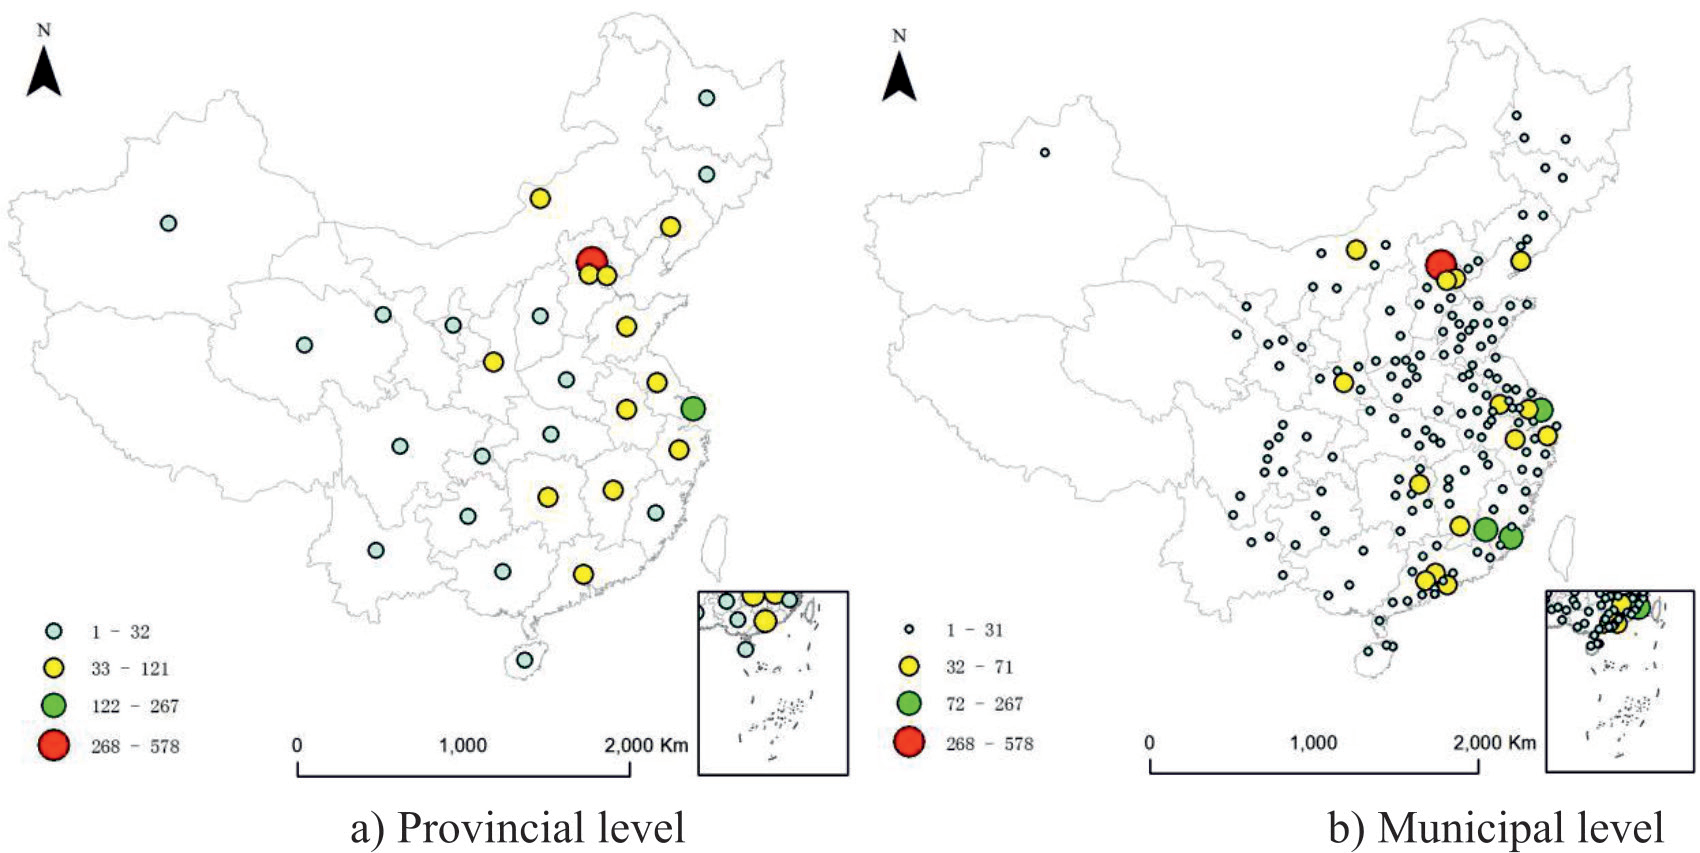
Table 2.
Centrality of nodes in China’s REIN from 2016 to 2020 (Top 30).
In general, not all provinces or nodes with high levels of economic development played leading roles in the REIN. Small and medium-sized cities with abundant earth resources also played important leading roles due to their high level of rare earth innovation.
(3) Cohesive subgroups of network nodes
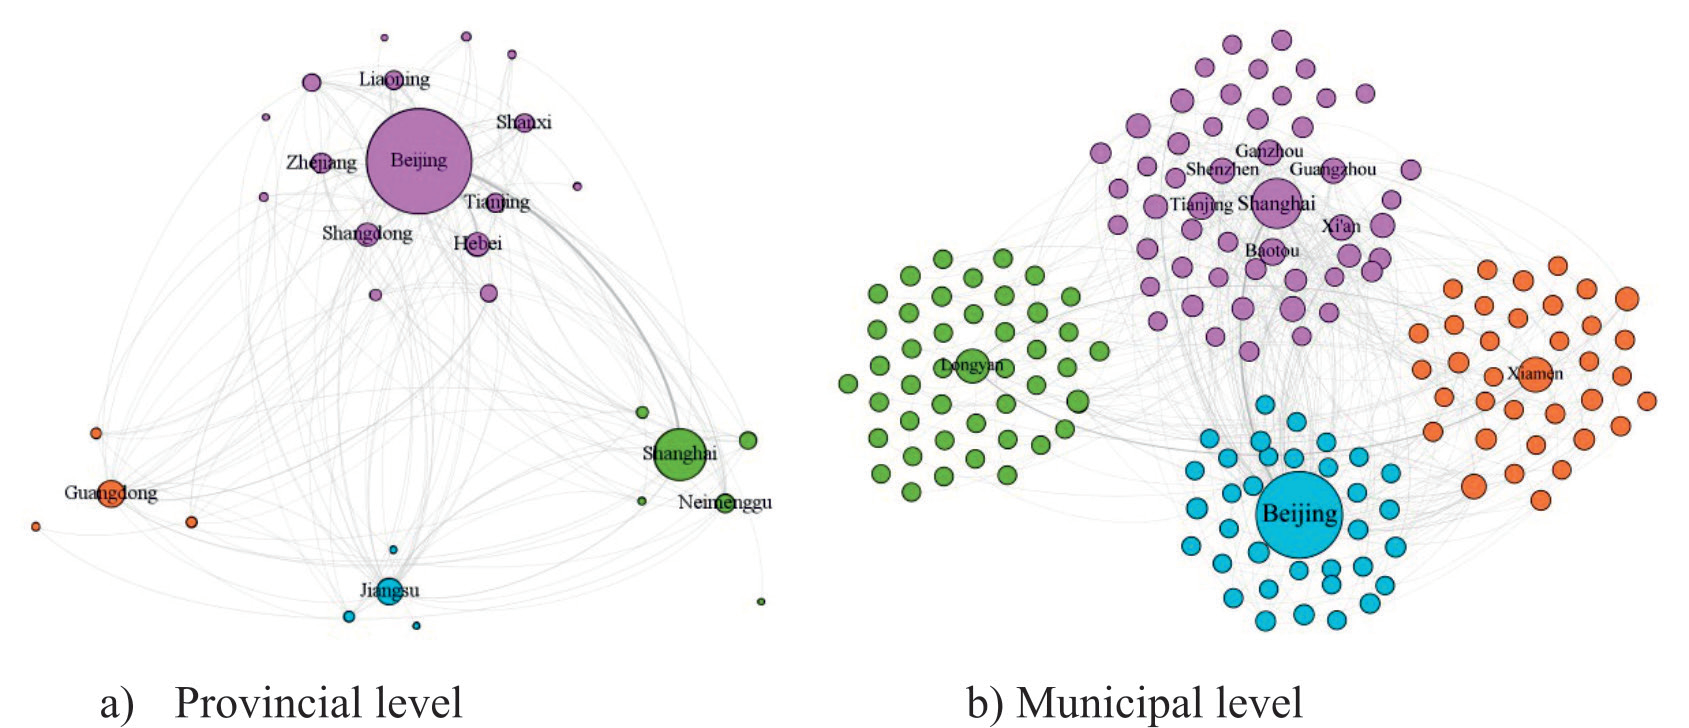
A cohesive subgroup analysis of China’s REIN from 2016 to 2020 was conducted using UCINET software. As seen in Fig. 5, the REIN had four types of subgroups at both the provincial and municipal levels. The macro-structure of the network and the E-I index analysis results are shown in Table 4.
At the provincial level, the difference in the number of provinces among subgroups increased. More than 53% of the provinces were concentrated in the second subgroup, with Beijing as the core. This subgroup radiated to drive innovative collaboration in rare earths with provinces such as Zhejiang and Shandong. Notably, among the provinces that radiated, six were among the top ten in terms of centrality, and there were close internal connections within the subgroup but sparse connections outside of the subgroup. The first subgroup was mainly centered around Shanghai and spread to provinces such as Inner Mongolia, accounting for 20% of the total. Both internal and external connections within this subgroup were close. The third and fourth subgroups were centered around Guangdong and Jiangsu, respectively, with each accounting for 13.3% of the total.
At the municipal level, the differences in the number of cities among subgroups were smaller than those at the provincial level. More than 30% of the cities were concentrated in the fourth subgroup, with Shanghai as its core, and radiated to drive rare earth innovation connections in the top ten cities in centrality, such as Shenzhen, Guangzhou, Ganzhou, Tianjin, Xi’an, and Baotou. The first, third, and second subgroups accounted for 27%, 22%, and 20%, respectively, with Longyan, Xiamen, and Beijing as their respective cores. There was no close connections within each subgroup; among the subgroups, close connections existed only between subgroups 4 and 2 as well as between subgroups 1 and 3.
Combining the cohesive subgroups of the REIN at the two levels, strong subgroups (provincial subgroup 2 and municipal subgroup 4) formed between the “strong” nodes in the REIN. At the provincial level, subgroup 2 had close internal and external connections, but at the municipal level, subgroup 4 was only closely connected to subgroup 2, and its internal connections were relatively weak.
As seen in Table 3, at the provincial level, the E-I indices of subgroups 1, 3, and 4 and the overall network were all positive, the nodes in these subgroups had significantly more external connections than external connections, with no obvious factional diversity, and they had great potential for development. Compared with nodes in other subgroups, the nodes in subgroup 2 had the strongest internal and external innovation connections, but their internal connections were slightly weaker than their external connections, indicating a trend toward the development of small groups. At the municipal level, all subgroups had positive E-I indices, and there was no formation of small groups within the subgroups. To avoid information barriers and factions caused by the excessive formation of small groups, which may hinder the overall development of subgroups, subgroup 2 at the provincial level should strengthen exchanges with external nodes and diversify the development of the patent collaboration network.
Table 3.
Density matrix and image matrix of cohesive subgroups of nodes in China’s REIN from. 2016 to 2020.
Discussion
Selection of Influencing Factors
Following the principles of comprehensiveness and data availability and drawing on the research views of previous scholars [21, 22, 29, 30], the centrality of the provincial-level and municipal-level network from 2016 to 2020 was selected as the explained variable, and the following were selected as explanatory variables: GDP per capita (to characterize the economic development level), number of industrial enterprises above designated size (to characterize the technology absorptive capacity), local scientific and technological financial resources (to characterize government leadership), number of patents granted (to characterize the innovation output level), number of books in public libraries (to characterize the infrastructure), total retail sales of consumer goods (to characterize the market leadership), proportion of the tertiary industry output value (to characterize the industrial structure), and number of college and junior college graduates (to characterize the higher education level). The geographical detector method was used to analyze and calculate the correlation coefficients between the provincial-level and municipal-level network centrality and its influencing factors. Before the analysis using the geographical detector method, each variable was divided into five levels using natural breakpoints in ArcGIS. Due to potential endogeneity issues, the data for all these explanatory variables were from the end year, namely 2020. The data for the influencing factors were all obtained from the China Statistical Yearbook and China City Statistical Yearbook for each year.
Table 4.
Results of the E-I faction analysis of cohesive subgroups of nodes in China’s REIN from 2016 to 2020.
Analysis of the Results
Taking the top three decisive factors as the core influencing factors, as seen in Table 5, at the provincial level, the core influencing factors included innovation output level, infrastructure, and economic development level, and the secondary influencing factors included technology absorptive capacity and market leadership; at the municipal level, the core influencing factors included government leadership, innovation output level, and infrastructure, and the secondary influencing factors were other influencing factors.
At the provincial level, the number of patents granted and the number of books in public libraries had the most explanatory power and both were significant at the 1% level, indicating that innovation output level and infrastructure are the two most important factors in the REIN at the provincial level. A higher level of local innovation output leads to a stronger local technological innovation capability, and a well-developed infrastructure and a favorable innovation environment provide strong impetus for the generation and dissemination of rare earth innovation. GDP per capita, total retail sales of consumer goods, and number of large-sized enterprises had explanatory powers of 0.605, 0.582 and 0.452, respectively, significant at the 5% level, indicating that economic development level, market leadership, and technology absorptive capacity are important to the provincial-level REIN. Regions with higher levels of economic development can provide a more abundant material basis for relevant innovative activities in rare earth research. Innovation also relies on market demand, and rare earth elements as industrial vitamins play an irreplaceable role in the development of high-tech industries. Industrial enterprises are the main players for patent absorption and application, and the number of industrial enterprises in a region also reflects the technology absorptive capacity of the region to some extent, with a stronger technology absorptive capacity in a region leading to a higher level of rare earth innovation. Although indicators such as local government science and technology expenditure had explanatory powers greater than 0.3, they did not pass the significance test, indicating that some influencing factors, such as government leadership, have little importance.
At the municipal level, all indicators passed the significance test at the 1% level, indicating that these influencing factors have a significant impact on China’s REIN. Similar to those at the provincial level, infrastructure, market leadership, and innovation output level had important influences. There were differences between the municipal level and the provincial level. The influence of GDP per capita and number of large-sized industrial enterprises was quite different between the municipal level and the provincial level, and the spatial consistency of the economic development level and technology absorptive capacity with the centrality of REIN nodes differed significantly at different levels. In contrast, the differences in economic development level and technology absorptive capacity at the municipal level were small, which is conducive to reducing the centrality gap in the REIN at the municipal level in the future. The influence of local science and technology expenditure, the proportion of the tertiary industry output value, and the number of college and junior college graduates at the municipal level was more significant than those at the provincial level, indicating substantial differences in government leadership, industrial structure, and educational level within the municipal level, further widening the gap in the centrality of the REIN at the municipal level in the future. First, the uneven distribution of rare earths has led to significant variations in the formulation of relevant policies and research priorities on rare earths in different cities. For example, the city of Baotou boasts of a number of rare earth innovation platforms, such as the National Rare Earth Functional Material Innovation Center, Baotou Research Institute of Rare Earths, and Baotou Rare Earth R&D Center, the Chinese Academy of Sciences. The tertiary industry is more attractive than the primary and secondary industries for the generation and cultivation of rare earth innovations due to its accumulation of more highly educated talent. The same is true for areas with high education levels.
Table 5.
Results of the regression using the geographical detector method.
Conclusions and Policy Implications
Conclusions
To clearly describe the structural characteristics of China’s REIN, this study used data on China’s rare earth patents in the Incopat global patent database since 2001 to analyze the structural characteristics of China’s REIN between 2001 and 2020 from both the provincial and municipal perspectives using social network analysis.
The degree of connection and diversification of China’s REIN is gradually increasing. A few provinces and cities lead the REIN. The group differentiation of the network at the provincial level has decreased significantly, resulting in improved collaboration efficiency. However, the opposite trend is observed at the municipal level. The REIN exhibits a radial spatial pattern with Beijing as the center at both the provincial and municipal levels. Overall, the network is dense in the eastern regions and sparse in the western regions, indicating that the REIN has overcome the limitations of spatial and geographical distances.
The REIN exhibits distinct characteristics of coastal and resource agglomeration. Specifically, the provinces or cities in the first and second tiers for centrality are located in the eastern coastal areas of China, and those in the third tier are located in the central and eastern regions of China. Overall, not all provinces or nodes with high levels of economic development play leading roles in the REIN. Small and medium-sized cities with abundant rare earth resources also play important leading roles due to their high level of rare earth innovation. The REIN has four subgroups at both the provincial and municipal levels, and there is no significant factional diversity within these subgroups.
In terms of influencing factors, economic development level, technology absorptive capacity, innovation output level, infrastructure, and market leadership have significant impacts at the provincial and municipal levels. In addition, government leadership, industrial structure, and education level have significant impacts at the municipal level. At the provincial level, the core influencing factors include the innovation output level, infrastructure, and economic development level, and the secondary influencing factors include technology absorptive capacity and market leadership. At the municipal level, the core influencing factors include government leadership, innovation output level, and infrastructure, and the secondary influencing factors consist of other influencing factors.
Policy Implications
(1) Market leadership and government leadership should be combined. Government-led and market-led approaches play important roles in the development of rare earth innovation. However, it is necessary to be cautious of excessive government intervention and free market leadership. Only with proper regulation and balance between the two can efficient and sustainable collaboration in rare earth innovation be ensured.
(2) It is necessary to build a cross-city rare earth innovation platform. From the overall characteristics of the network, it can be found that the overall connection density of the REIN is low at the municipal level, necessitating urgent improvement in the overall connection level of the network. At the national level, it is necessary to establish a cross-city platform for the REIN, set up cross-city collaboration funds, improve policy support for cross-city collaboration, strengthen institutional supply, reduce the cost of rare earth innovation collaboration, and thereby lower the barriers to collaboration and innovation in the rare earth industry.
(3) It is necessary to improve regional technology absorptive capacity and education level. Technology absorptive capacity and education level are key capabilities that nodes in the REIN need to improve. Each region can achieve this by attracting talent to the rare earth sector, optimizing training mechanisms, increasing financial investment in education, and enhancing training efforts, particularly in higher education, which will subsequently enhance the region’s innovation and construction capabilities in the rare earth knowledge network. By strengthening innovation exchanges and collaboration with core regions such as Beijing, Shanghai, Xiamen, and Longyan, a region can enhance its capacity to absorb and transform rare earth knowledge.
Theoretical Contributions
(1) This study can be seen as a deepening of the study by [5]. This study investigates China’s REIN at two spatial scales, namely the provincial and municipal levels, and thus adds a new dimension to the previous innovation network research methods. The results reveal the pattern characteristics of the innovation network in different dimensions, break the limitation of traditional research on innovation networks from single dimensional perspectives, and enrich the theoretical system of innovation geography.
(2) This study integrates the content of the REIN into the existing regional innovation system theory, complex network theory, and collaborative innovation theor and examines the spatial patterns and influencing factors of China’s REIN from a dynamic perspective, enriching the relevant theories of the REIN and contributing to the theoretical innovation and practice of REIN research.
(3) This study explores the formation mechanism of the REIN at two spatial (provincial and municipal) levels. Using the geographical detector method, this study investigates various aspects such as economic development level, technology absorptive capacity, and government leadership, providing new ideas and approaches for innovation network research, and is of great reference significance for promoting the high-quality development of China’s rare earth industry [8, 21].
Research Limitations and Prospects
(1) In terms of research data, this study only uses patent collaboration data to illustrate the REIN, and the data source is relatively limited. In the future, comprehensive research can be conducted using sources such as co-authored papers, patent transfers, and parent-subsidiary company data to improve the scientific rigor and accuracy of the research.
(2) Regarding spatial scales, the characteristics of innovation networks differ across spatial scales due to the differences in the economic and social environments at different levels. This paper only examines the related issues of the REIN at the provincial and municipal levels. In the future, REINs across a broader range of spatial scales, such as global-local, city clusters, and county levels, should be analyzed.
(3) Research methods need to be further improved. Firstly, this study uses social network analysis to investigate China’s REIN using rare earth patent collaboration data. In a follow-up study, case studies and questionnaire interviews will be conducted to further examine rare earth innovation research. Secondly, this study uses the geographical detector method to analyze the factors which affecting the China’s REIN, and econometric method can be adopted in future research to discuss the influencing mechanism of REIN in China.

