

Introduction
As a key industry, logistics plays a crucial role in social production. In 2022, China's logistics industry was valued at 34.76 billion yuan, making up 14.7% of the nation's GDP. However, the growth of the industry has resulted in significant energy depletion and pollution of the environment. Carbon emissions from China's logistics sector increased from 6.3% of the national total in 2012 to 11% in 2021. Green innovation is vital because it encourages a balance between environmental preservation logistics[1-3]. Improving green innovation's effectiveness in the logistics industry is crucial to creating higher value with minimal cost and resources.
Efficiency in green innovation efficiency (GIE) is the degree to which innovation processes integrate ecological benefits and economic gains. Green innovation efficiency in the logistics industry refers to the efficiency of resource utilization in the innovation process of the logistics industry, especially innovation activities related to environmental protection and sustainable development. It involves the adoption of new technologies and methods by logistics enterprises in transport, warehousing, packaging, and distribution to reduce energy consumption, lower environmental pollution, and enhance the greening of logistics services while maintaining or improving the economic efficiency of logistics services [4]. Current research primarily focuses on quantitative measurement, using input-output indicators. Common measurement models include the Data Envelopment Analysis (DEA) model [5], the Malmquist model [6], and the modified gravity model [7]. Studies indicate that key areas of GIE are manufacturing [8], industrial [9], and high-tech industries [10], as well as various regional levels [11-13]. Teng Tang Wei et al. (2023) observed a fluctuating upward trend in the GIE of cities in the Yangtze River Delta, with noticeable regional variation, displaying a distribution structure that is high in the south and low in the north [14]. Lu Yan Wei (2023) found that the digital economy significantly boosts GIE, with noticeable spatial overflow effects and spatio-temporal heterogeneity in the effect of the digital economy on GIE [15]. Li et al. (2023) identified four primary routes of green innovation in cities, including the results-driven innovation road, the open inclusive culture path, the integrated creative innovation path, and the open participation innovation integration way [16]. Zhou et al. (2023) noted that while China has a low total effectiveness in green innovation, it is steadily growing, with significant provincial differences at various phases of excellent development [11]. Scholars also examine the qualitative measurement of spatio-temporal evolutionary patterns and factors affecting GIE.
Numerous studies have demonstrated that GIE exerts a significant regional spillover effect. Investigating GIE aids in enhancing it within neighboring areas [17- 19]. Commonly, researchers utilize Moran's index [20] and spatial measurement models [13] to analyze the spatial spillovers of GIE. For instance, Zhang Feng and colleagues (2023) observed a spatial correlation network in the equipment manufacturing industry along high-speed railways, characterized by a "dense at both ends and sparse in the middle" pattern, with fluctuating growth in network relationships and density, exhibiting a significant small-world network property[8]. Cao Zheng Xu and associates (2023) noted regional disparities in the industrial corporations' GIE, with "high R&D-high translation" provinces predominantly in the region of the east, while the western and central areas mainly feature "high R&D-low translation" or "low R&D-high translation" provinces, highlighting various stages of innovation shortcomings [9]. Wang Chuan Xu et al. (2016) discovered spatial spillover effects in the GIE of provincial high-tech industries, where indirect and total effects align with the direct effects' direction of impact on the high-tech industries' GIE [21]. Chang Zhe Ren and colleagues (2023) found that synergistic industrial agglomeration significantly boosts GIE in municipalities in an area and creates spatial spillover effects in adjacent areas [22], indicating diverse spatial evolution variations in GIE across industries.
Enhancements in GIE stem from several drivers, primarily categorized into immediate and circumstantial factors. Immediate factors include S&T R&D investment [23, 24], industrial structure [11, 25, 26], talent investment [27, 28], resource consumption structure [29, 30], and the technological innovation environment [31, 32]. Indirect factors encompass openness to the outside world [11, 26, 33], population size [34], market demand [32, 35], government policy support [25, 36, 37], and infrastructure development [38-40]. Studies reveal that the same factor has different effects on GIE across industries. For example, Zhang et al. (2023) found that policy factors significantly influence industrial GIE [41]. Ye et al. (2023) found that policy factors have a significant positive effect on GIE in the logistics industry [42]. Wang et al. (2023), but have no significant effect on manufacturing industry green development levels [43]. Wu Yu Meng and Wang Ting (2023) identified a positive association between the degree of economic growth and GIE in Chinese industry [26]. This underscores the importance of recognizing industry-specific differences when assessing how various aspects affect the effectiveness of green innovation. Li Gen et al. (2023) reported a negative impact of innovation economic inputs on industrial GIE in various regional contexts [44]. Wu Chuan Qing et al. (2022) found a significant negative impact of population size on manufacturing sector greening [45]. Yao Meng Chao and colleagues (2022) noted that governmental science and technology finance and informatization positively contribute to high-tech industries' GIE, whereas openness to the outside world has a dampening effect [46]. Wang et al. (2022) discovered that specialized agglomeration inhibits GIE in high-tech sectors in China, with the inhibitory effect intensifying with regional population size [47], highlighting the need for industry-specific factor analysis due to the differing effects across industries.
The growth of the logistics industry, with a focus on green and innovative practices, plays a vital function in shaping China's logistics sector. Current research primarily explores aspects of green efficiency and innovation. Zhao Jing Cheng and colleagues (2023) observed a positive spatial relevance in the efficiency of the logistics industry spanning 11 provinces and cities within the Yangtze River Economic Belt, noting an annual increase and a growing interconnectivity between these regions [48]. Yi Yan (2023) reported that the green efficiency of the logistics sector in the eastern region outperforms that of the western and central areas, highlighting a correlation between the green efficiency of the logistics sector in the western and central areas and the eastern region [49]. Hua Jun Nan and team (2024) discovered that the efficiency's spatial correlation effect of the logistics industry extends beyond geographical proximity, leading to a more stable yet dispersed spatial correlation network structure [50]. Sun Chun Xiao and colleagues (2021) found significant expansion in the spatial network scale of city logistics creativity in China from 2003 to 2018, with the network densifying and its scale-free characteristic diminishing [51].
Research across various industries, including manufacturing [8], industry [9], and high-tech industry [10], has demonstrated the strong spatial dependence of GIE. The establishment of logistics networks facilitates the interconnection of cross-regional economic activities, reinforcing the presence of spatial dependence in logistics efficiency studies. Green innovation in the logistics sector potentially creates spatial effects through its network, fostering a self-enhancing cycle of communication, knowledge sharing, technology diffusion, and resource sharing [52]. Hence, to offer more comprehensive and sustainable development recommendations for China's logistics sector, it is vital to consider the GIE. The Chinese government aims to explore policies for optimal resource allocation and sustainable development tailored to regional characteristics. However, the research in this domain remains insufficient, necessitating a spatial analysis of GIE in the logistics sector to better understand its impacts and potential.
This study significantly contributes to understanding the GIE of the logistics sector. (1) Previous research primarily focused on measuring and forecasting logistics efficiency indicators across various regions, lacking a comprehensive examination of greenness, innovation, and efficiency simultaneously. GIE is crucial for assessing the logistics industry's development in each region. This article develops a system of indexes for GIE in the logistics sector and quantifies it in 30 Chinese municipalities and provinces in recent years. (2) Prior studies have seldom explored GIE in the Chinese logistics sector, particularly considering spatial effects. This study investigates the spatial effect distribution law of GIE in the Chinese logistics sector, enhancing our understanding of its sustainable development. Earlier research has examined the drivers of logistics efficiency and innovation but has not adequately addressed the GIE of the logistics industry. (3) In previous studies, only the drivers of logistics efficiency and logistics innovation have been studied, and there is a dearth of studies on the drivers of GIE in the logistics sector. However, China has many provincial and municipal regions with varying degrees of development; particularly, variations in efficiency across provinces and municipalities have been brought about by the impact of drivers on green innovation efficacy in the logistics sector. Therefore, identifying the drivers of GIE in the logistics sector is important for the growth of the logistics industry.
Research on China's logistics industry should prioritize improving GIE. This involves addressing challenges such as reconciling industry development with environmental protection, leveraging geographical and resource advantages in different regions, and devising region-specific sustainable development policies. This study introduces the SBM super-efficiency model to gauge the GIE of the logistics sector in 30 provinces and cities in China from 2012 to 2021. It also employs social network analysis to outline the spatial distribution features and evolutionary trends of GIE. Additionally, the study uses QAP analysis to investigate drivers. These findings offer theoretical insights and policy guidelines for promoting the logistics industry's green development and its sustainable progression. Moreover, they provide model frameworks for researching GIE in other sectors.
The paper is structured as follows: Section 2 describes the research methodology used in this paper and the process of constructing and selecting green innovation efficiency indicators, as well as the relevant data sources. Section 3 analyzes the empirical results. Section 4 provides a discussion. Section 5 draws research conclusions and recommendations.
Methods and Data
Research Methods
Green Innovation Efficiency Measurement Model for the Logistics Industry
(1) Measurement methods
The GIE of China's logistics sector is assessed in this study using the SBM super-efficiency mode [53]. The dynamic changes in GIE within this industry are investigated through the application of the MI index approach.
While DEA is a widely accepted approach for efficiency measurement, traditional DEA models face challenges in addressing slackness in output and input factors, potentially compromising efficiency accuracy [54]. To overcome these limitations, the SBM super-efficiency model, introduced by Tone [55], is chosen for its capacity to simultaneously consider inputs, desired outputs, and undesired outputs. This model has gained popularity across various fields for its comprehensive analysis capabilities. Accordingly, the article adopts the SBM for assessing the GIE of China's logistics sector. The model's formula is outlined below:
(1)
The efficiency value is represented by ρSE, with x and y indicating the input and output elements, respectively. The model includes m input indicators and s output indicators, with i and j representing the decision-making units for inputs and outputs S+ and S⁻ denote the input and output slack, respectively. rj denotes the vector of weights.
Additionally, the study applies Malmquist index (MI) analysis to track the evolution of total factor productivity, focusing on addressing undesired output [56]. The MI is grounded in DEA models, and the core of the MI is to solve the problem of undesired output [54, 57]. Therefore, this study applied the MI analysis to analyze the dynamic variations in GIE in the Chinese logistics industry. This involves defining a directional distance function and constructing a global total factor productivity (MI) by integrating GIE measures specific to the logistics sector.
In the formula, Eg,t(xt, yt, zt) denotes the global efficiency value in period t, Eg,t+1(xt+1, yt+1, zt+1) denotes the global efficiency value in period t + 1, and MIt,t+1 denotes the total factor productivity index from period t to t + 1.
(2) Measurement indicators
The analysis categorizes GIE indicators into inputs and results measures. Input signals encompass investment expenditure [42], labor input [58], and energy input [4, 59]. Labor input is measured by the workforce size in transportation, storage, and postal services, while energy input is gauged by the sector's energy used by the industry. Because it is difficult to obtain direct data from Chinese yearbooks, the logistics sector's capital stock— which is determined using the "perpetual inventory method"—infers capital input, which is impossible to assess directly.
Where Κi,t and Κi,t-1 denote the capital stock of city i in year t and t − 1, respectively, Ii,t is the amount of fixed asset investment in city i in year t, and δ denotes the depreciation rate of fixed assets. After choosing a defined base period, the above equation is transformed by iteration, and its formula is as follows:
In Equation (5), it is critical to calculate the investment amount, base period stock, and the economic depreciation rate for year i. For the investment amount in year i, considering the references from prior research and data availability, this study chooses the fixed asset investment as the reference data. For determining the base period stock, this research refers to the initial stock proposed by Reindorf (2005), calculated using the following formula:
I0 signifies the constant price investment during the base period, g stands for the average annual growth rate under constant price investment, δ indicates the average capital depreciation rate (the growth rate of fixed asset investment in each province and city for the year 2006 was used for the 30 provinces and cities to determine this value) and the economic depreciation rate was calculated using a formula with a value of 9.6% [60].
Output metrics are categorized into desired and undesired outputs. Desired outputs are measured by freight turnover [58], the number of patents granted in the logistics sector [61], and the industry's value added; carbon dioxide emissions [3, 62] are identified as the undesired output, with fossil energy consumption used to estimate the carbon footprint of the logistics sector across 30 cities and provinces in China, calculated by the formula:
Ei is the total consumption of energy source i, NCVi is the average low level heating value of energy source i, CEFi is the carbon emission factor of energy source i, and COFi is the carbon oxidation factor.
The details of the variables that are entering and leaving to assess the efficiency of green innovation in China's logistics industry are presented in Table 1.
Spatial Effect Measurement Model of Green Innovation Efficiency in the Logistics Industry
The spatial network structure of GIE in China's logistics industry is examined in this study using social network analysis, and the position and function of every municipality and province within the spatial network are analyzed using the plate model.
(1) Social Network Structure
Table 1.
An Index System for Evaluating Green Innovation Efficiency in the Logistics Sector.
Social network analysis is utilized to depict cooperative relationships among nodes in urban network studies [63]. This study uses network density, network efficiency, and the degree of network level in social network analysis to explore the overall network characteristics of 30 provinces and cities, and employs point centrality, betweenness centrality, and closeness centrality to investigate the individual network features.
(2) Modified Gravity Model
Prior to conducting a social network study, a spatially related matrix is created. This is usually done by measuring the relationship strength and inherent connection mechanism of the spatial network connecting cities using the gravity model found in the literature [14]. The geographic relationship strength of innovative green efficiency in the logistics sector across 30 Chinese provinces and cities is measured in this study using a modified gravity model. The spatial relationship matrix is created using the following formula:
where S is the intensity of the spatial linkage of GIE in the logistics industry; Ei and Ej denote the GIE of the logistics industry in regions i and j, respectively; Dij denotes the distance between regions i and j, with specific data derived from ArcGIS software; Gi and Gj denote the total GDP of regions i and j, respectively; and gi and gj denote the gross regional product of regions i and j, respectively.
The values of linkage strength less than 100 are hidden due to the large extreme difference in the strength of the association measured by the modified gravity model; therefore, linkage strength greater than 100 is divided into four stages: the first stage, the second stage, the third stage, and the fourth stage.
(3) Overall Network Architecture
Network density reflects the compactness of a spatial network's structure. A higher network density indicates more interconnected nodes and a greater influence of resource flow within the network on individual nodes [64, 65]. In this study, network density is quantified by comparing the actual number of links within the network to the maximum possible connections across the entire network. This ratio, which falls between 0 and 1, is calculated as follows:
where n denotes the number of cities and n×(n − 1) is the maximum number of possible correlations.
Network efficiency is defined by the number of superfluous connections in a network relative to a specific number of network members [66]. A lower network efficiency value suggests an increase in spillover channels among node cities, thereby stabilizing the network trend. The network efficiency calculation formula is
where Κ is the number of excess lines, and max(K) is the maximum possible number of excess lines.
The network hierarchy indicates the rank of each node city or province within the network, denoting their importance and influence. A higher degree of network hierarchy enhances network accessibility and signifies a more stratified network structure. It is determined by the following formula:
where M denotes the number of symmetrically reachable member pairs in the network and max(M) denotes the maximum possible number of symmetrically reachable member pairs.
(4) Individual Network Structure
Table 2.
Specific categorization of the four sectors.
| Ratio of Inner Relations | Ratio for Accepted Connections | |
|---|---|---|
| ≈0 | >0 | |
| ≥(gk-1)/(g-1) | Bilateral overflow panels | Main Beneficiary Sectors |
| <(gk-1)/(g-1) | Main overflow boards | Brokerage Board |
Point degree centrality refers to the radiation and absorption capacity of a node, province, or city within a network. The number of direct links between nodes is how it is expressed. Point-degree centrality can be further classified into point-in and point-out. Point-in represents the number of connections accessing a node, province, or city, indicating the extent to which it is influenced by other nodes in the network. On the other hand, point-out denotes the number of relationships sent out, indicating the ability of the node, province, or city to impact other nodes [66].
The degree of intermediary centrality characterizes the node's, province's, or city's ability to control and regulate each resource in the network [14]. This is calculated using the following formula:
where gij is the number of associations that exist between regions i and j and gij(i) is the number of paths between i and j going through i
Proximity centrality measures the minimum distance between two cities or provinces, indicating the ease of resource transfer between provinces and municipalities [7]. It is determined by the following formula:
where dij is the straight-line distance between province and city i and province and city j is indicated.
(2) Plate Model
Plate modeling is a widely utilized method for analyzing spatial network structures through spatial clustering. It is crucial to clearly define the interconnections among locations within the plate structure during plate modeling [67]. These relationships can appear in four distinct forms. The first is the bilateral spillover plate, characterized by its dual role in both sending and receiving interactions with other plates, alongside maintaining numerous internal relationships. The second type is the main beneficiary sector, where the plate predominantly receives interactions, both internally and externally, rather than contributing spillover to other plates. The third form is the main overflow board, notable for its tendency to create more outgoing connections than it receives. The fourth type is the broker board, unique in its balance of incoming and outgoing links with a limited number of internal connections. This categorization led to the identification of four distinct segments, as detailed in Table 2.
Table 2 posits that block Gk includes city gk, the total number of potential relationships Gk within block is gk(gk − 1). Given that the spatial association network includes g cities; therefore, the number of possible relationships Gk in each block city is gk(g − 1) in the spatial association network, and the expected internal relationship ratio is gk(gk − 1)/gk(g − 1) − (gk − 1)/(g − 1) .
Logistics Green Innovation Efficiency Drivers Identification Model
(1) Measurement methods
The elements impacting the spatial network structure of GIE in the Chinese logistics sector are examined in this study using QAP analysis. QAP, a matrix algebra-based method, is adept at assessing the similarity and correlation between two matrices [68].
The QAP correlation analysis involves initially randomizing the relation matrix, then comparing the similarity between the two matrices, determining the number of relations, and conducting non-parametric testing. The process entails: 1) treating all matrix values as vectors to compute the relationship coefficient between both vectors, 2) randomly replacing one matrix, shuffling all its rows and columns, followed by computing and saving the relationship coefficients between the altered matrix and the original, 3) analyzing the distribution of correlation coefficients post-replacement to conduct QAP correlation.
Table 3.
Explanatory variables of the spatial relationship network for innovative green efficiency in logistics.
Table 4.
Regional division of 30 provinces and cities in China.
QAP regression goes deeper, analyzing and assessing the importance of the correlations between individual matrices and many matrices. It includes 1) conducting multiple regression analyses on all independent variable matrices against the elements of the dependent variable matrix, and 2) recalculating the regression after randomly rearranging the dependent variable matrix's rows and columns storing all of the obtained coefficient values.
(2) Measurement indicators
This study analyzes six dimensions: spatial proximity, extent of opening to the outside world, industrial structure, level of urbanization, degree of technological and scientific advancement, , and energy intensity. These dimensions are based on relevant studies by scholars [2, 39, 69]. The spatial matrix of innovative green efficiency in the logistics sector serves as an explanatory variable for data processing. The values of the indicators are represented as difference matrices, detailed in Table 3.
Study Area and Data Sources
Data collection for Tibet, Macau, Hong Kong, and Taiwan proved challenging, leading to their exclusion from this study. Therefore, the regional focus of this paper is outlined in Table 4. The Eastern, Central, and Western regions are used in this study's partition of 30 provinces and cities in order to investigate the spatial variability of GIE in the logistics sector. This classification is based on economic development tactics like "Western Creation", "Central China's Rise", and "Priority Development of Eastern China". The 30 provinces and cities mentioned above are divided into three regions, namely the Eastern, Central, and Western regions. The breakdown of these regions is shown in Table 4.
The GIE in the logistics sector in the previously specified regions is the subject of the research. The article examines the spatial network structure and determinants of GIE in the Chinese logistics sector using panel data collected between 2012 and 2021. National statistics do not clearly classify the logistics sector, so information from the "transport, storage, and postal services industry" is utilized as a stand-in. The China Statistical Yearbook, the China Energy Statistical Yearbook, the 2006 IPCC Guidelines for National Greenhouse Gas Inventories, and other provincial and city yearbooks from 2013 to 2022 are the data sources. Patent data in the logistics sector is sourced from the Key Industry Information Service Platform of the China Intellectual Property Office. For a small amount of missing and difficult-to-trace data, linear interpolation with averaging was used for smoothing to ensure data consistency and validity.
Results
Assessment Findings of the Logistics Sector's Green Innovation Efficiency Evaluation
The spatial distribution of GIE in the Chinese logistics sector for 2021 is depicted in Fig. 1. The logistics sector in eastern China has a higher total innovative green efficiency value in 2021, which is mostly spread in the two regions with darker hues. The map's darker colors represent the Eastern region, which exhibits the best efficiency. The region to the west has the smallest efficiency and is represented with the lightest hues, while the central region follows with lighter tones. The overall trend is East > Central > West.
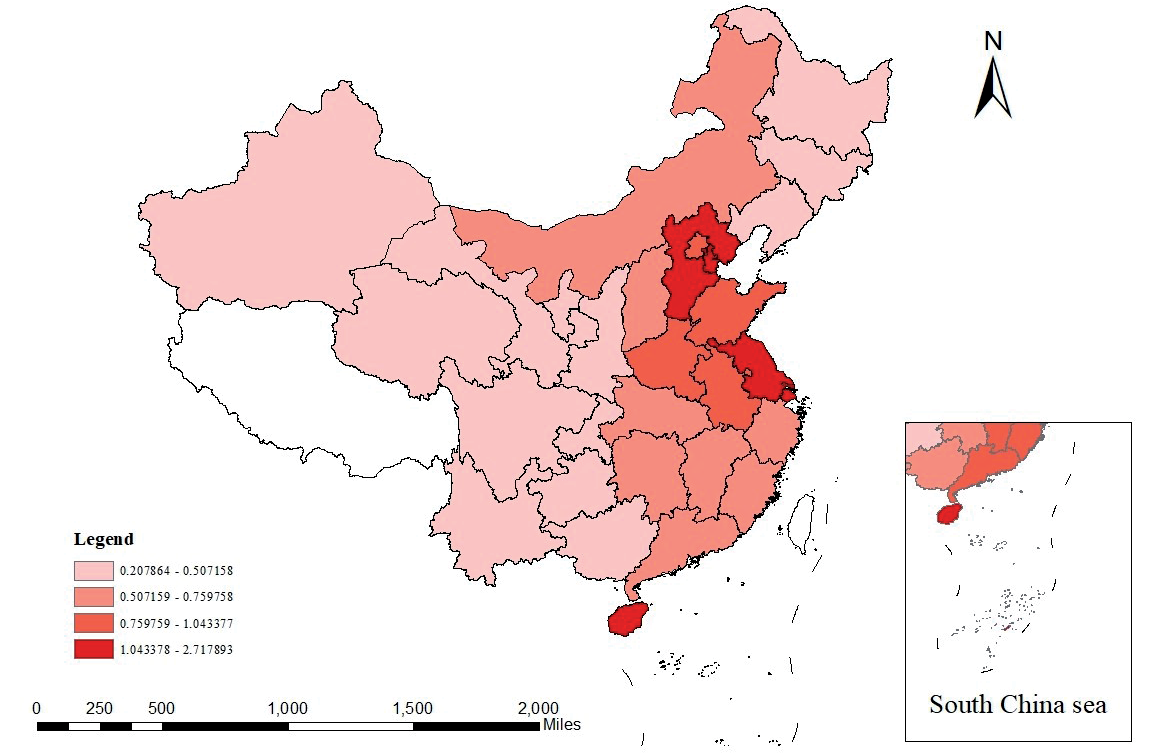
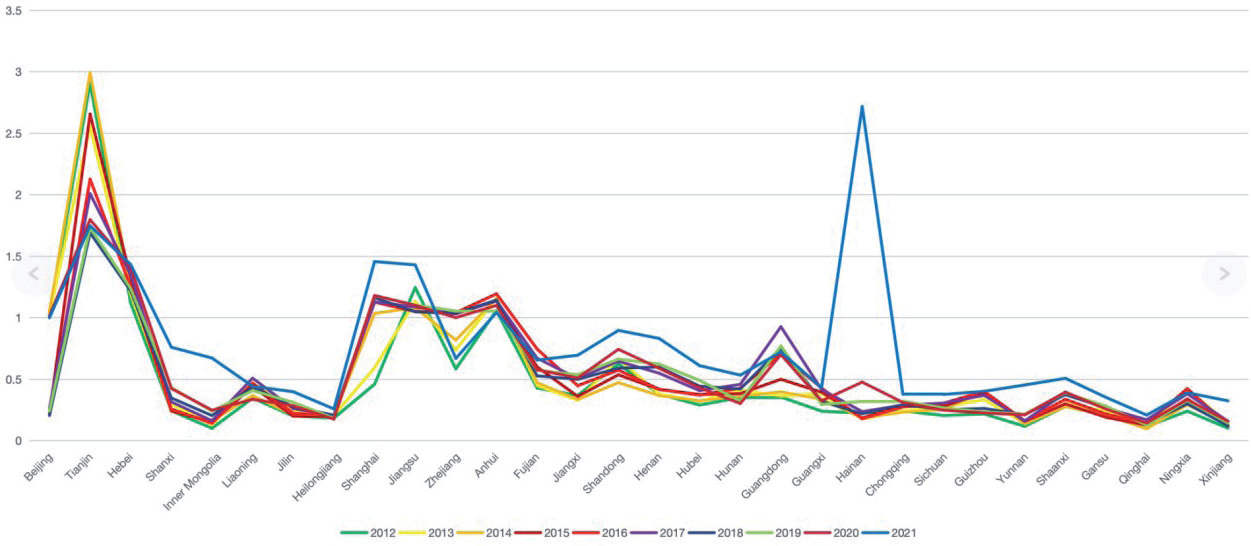
Fig. 2 shows the results of the research, which measured the GIE of the logistics sector in 30 Chinese municipalities and provinces between 2012 and 2021. The findings reveal an average innovative green efficiency value of 0.562, indicating generally low efficiency across the board. Additionally, the results highlight a significant variation in regional development levels, with Hebei, Tianjin, and Jiangsu provinces demonstrating efficiency values above 1, in contrast to Heilongjiang and Qinghai provinces, which consistently recorded values below 0.3.
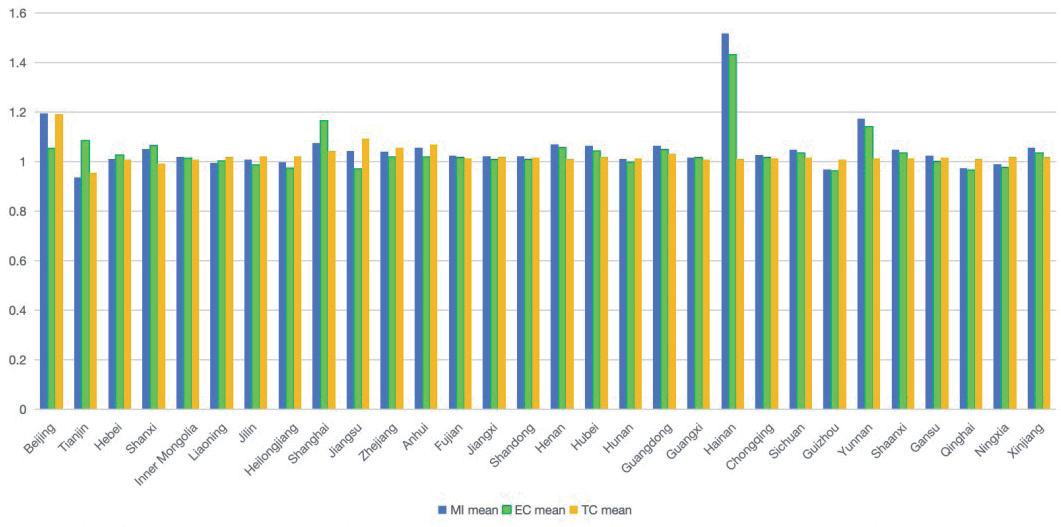
Fig. 3 shows more analysis of the mean amount for the GIE index for every province and municipality. Here, 24 provinces and cities scored a mean value of the MI index above 1, signifying positive progress in the GIE of the logistics sector within these regions. Hainan Province led with the highest MI index average of 1.518, followed by Beijing and Yunnan. Conversely, Tianjin recorded the lowest MI index average at 0.937. Nonetheless, it showed progress in technical efficiency with a mean EC index value of 1.085, but a decline in technical progress with a TC index value of 0.956.
Results of Measuring the Spatial Effects of Green Innovation Efficiency in the Logistics Industry
Overall Network Structure
This study examines the spatial network framework of innovative green efficiency in the Chinese logistics sector, treating each province and city as a network node and analyzing the connection strengths between them using ArcGIS tools. The results, illustrated in Fig. 4, reveal a considerable variance in the spatial network structure across the 30 provinces and cities studied. The overall spatial network displays an imbalanced distribution, with the eastern and central regions having lower levels of innovative green efficiency and the western regions having greater levels. The eastern region's network is anchored by the initial and second levels, while in the central region, the 3rd and 4th order links rely on a minimal presence of initial and second order links. The western region is characterized by a predominance of third and fourth level links, albeit with fewer connections overall. The majority of China's most connected provinces and cities are found in the country's east and center, while the majority of its least connected provinces and cities are found in the country's center and west, particularly in Xinjiang, Qinghai, and Ningxia.
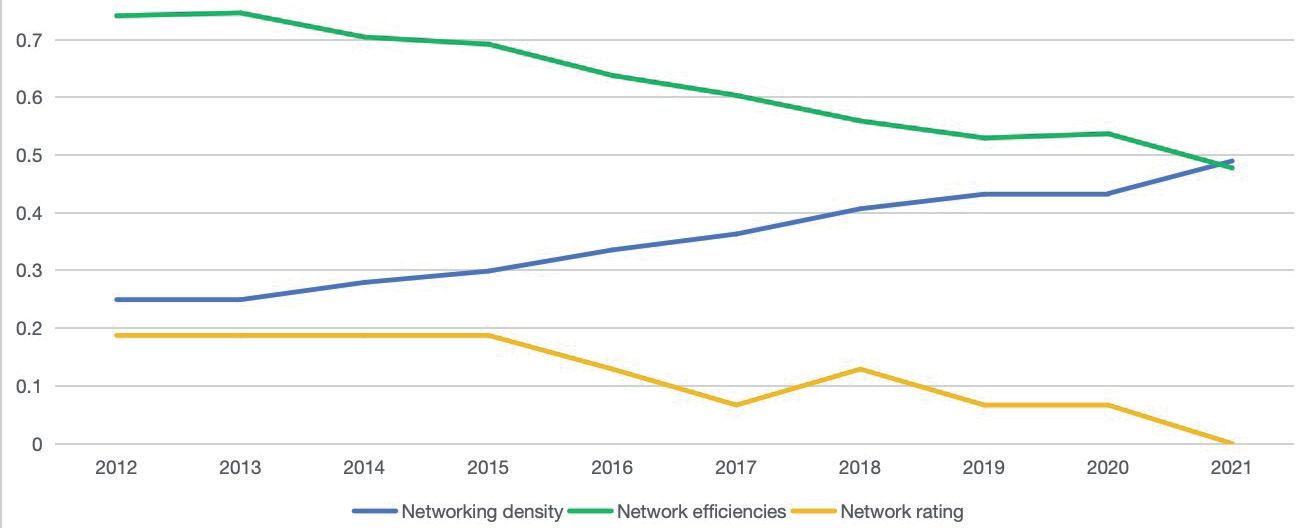
Fig. 5 displays the results of the study's computation of the network density, network efficiency, and network hierarchy of the spatial connection of innovative green efficiency in the logistics sector. It was observed that the network density increased gradually over the study period, peaking in 2021. In contrast, the overall network efficiency showed a declining tendency, with the highest efficiency recorded in 2012 and the lowest in 2021, averaging 0.623. Similarly, the network hierarchy decreased over time, with an average value of 0.1208.
Individual Network Structure
The spatial distribution of the point-entry degree in the GIE network within the logistics sector among 30 Chinese municipalities and provinces for the years 2012, 2017, and 2021 is depicted in Fig. 6. The areas with higher point-entry degrees are predominantly located in the eastern region. In 2012, Tianjin and Shanghai led the first tier, followed by Beijing, Jiangsu, and Guizhou in the second tier. Between 2012 and 2017, Beijing ascended to the first tier, with Fujian and Zhejiang provinces advancing to the second-highest value area. From 2017 to 2021, the second tier expanded westward around the first tier. Xinjiang consistently remained in the low-value tier, and in 2021, Qinghai Province moved up from the fourth to the third tier.
For the same set of cities and provinces in the same years, Fig. 7 shows the spatial distribution of the point-out degree in the GIE network. In 2012, the first tier included Tianjin, Jiangsu, Shanghai, and Beijing, while the second tier comprised Shandong and Zhejiang provinces. From 2012 to 2017, the first tier expanded, and the second tier spread southward, forming a cluster with Shandong, Jiangsu, Shanghai, Zhejiang, Fujian, Guangdong provinces, and Beijing and Tianjin municipalities as localized central hubs. Between 2017 and 2021, the first tier continued to grow, with Hubei Province and Chongqing Municipality rising to this tier, and several provinces moving from the third to the second tier. The fourth tier was mainly in western China.
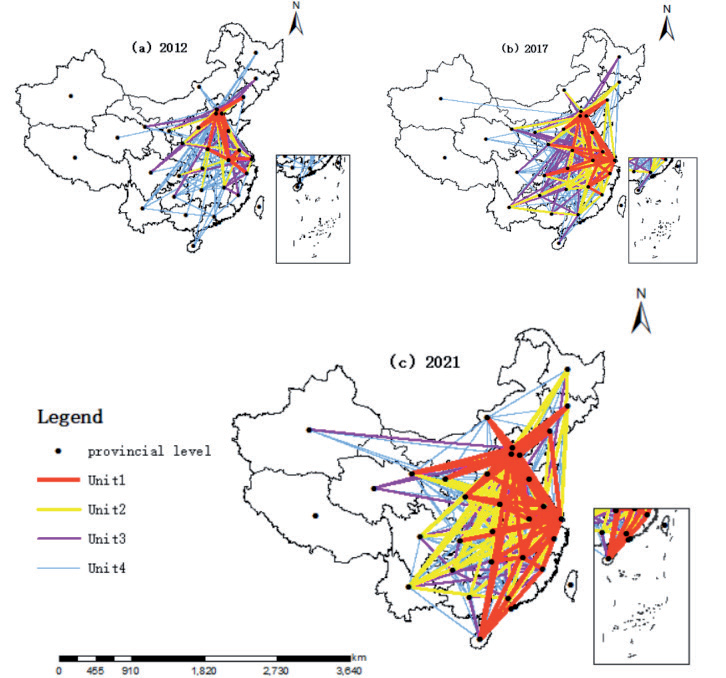
Fig. 5.
Network correlation of innovative green efficiency in the logistics sector from 2012 to 2021.
The analysis of both point-in and point-out degrees reveals a consistent correlation between the two, i.e., the high and low point-in rankings of provinces and cities are consistent with point-out. This indicates that there is a bidirectional link in innovative green efficiency within the logistics sector. Higher degrees in both metrics are typically associated with more sophisticated logistics in provinces and cities.
Fig. 8 displays the spatial distribution of the GIE network's mediating centrality degree. In 2012, Beijing, Tianjin, and Shanghai were in the first tier. By 2017, Jiangsu Province had moved up to the first tier, with Zhejiang and Fujian provinces advancing to the second tier and Jiangxi Province dropping to the third tier. By 2021, there was a general decline in mediating centrality values across most provinces and cities, with Hunan, Guizhou, and Guangxi falling to the fourth tier and diminishing their role as network bridges.
Fig. 6.
Spatial distribution of point penetration of an innovative green efficiency spatial connection network in the logistics industry.
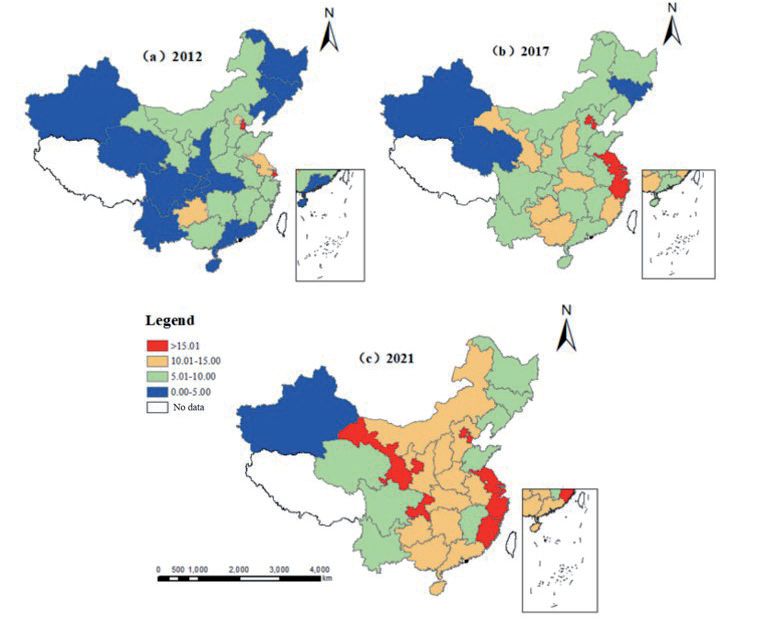
Fig. 7.
Spatial distribution of an innovative green efficiency spatial connection network in the logistics industry.
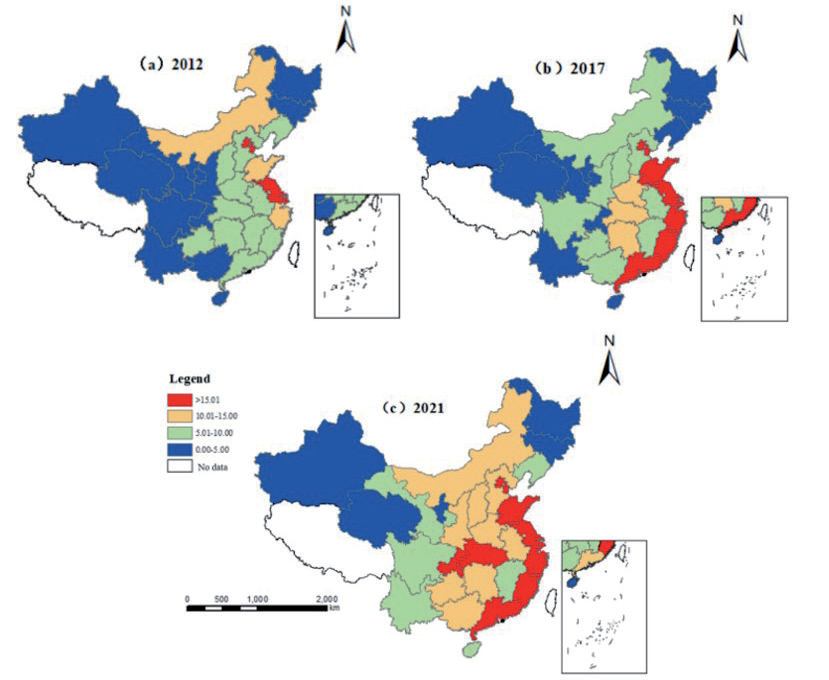
Fig. 8.
Spatial distribution of the mediated centrality of spatially relevant networks for green innovation efficiency in the logistics industry.
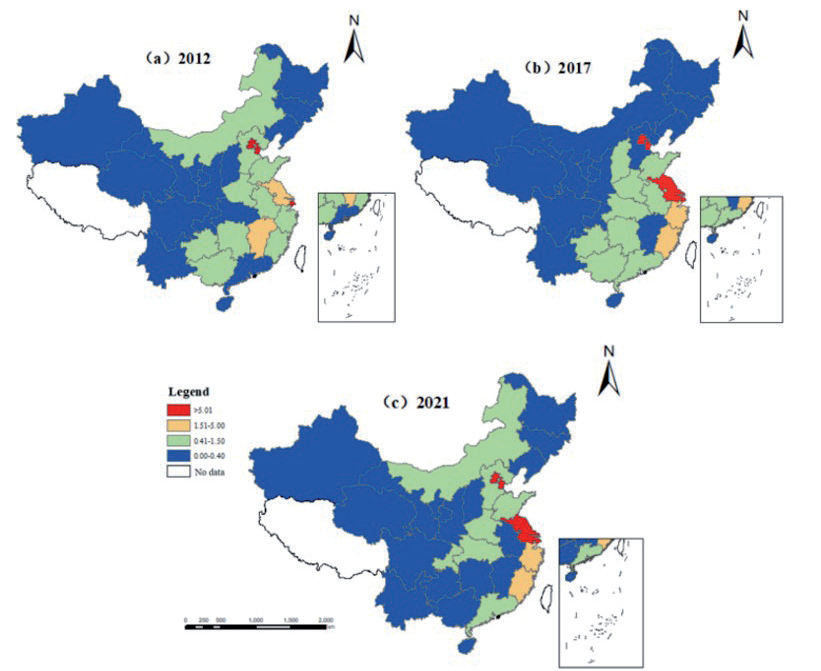
Fig. 9 shows the spatial distribution of proximity centrality from 2012 to 2021. Initially, the first tier included Tianjin and Shanghai, with Beijing and Guizhou in the second tier. By 2017, proximity centrality values had significantly increased across all regions, with all provinces and municipalities in the third tier or higher. In 2021, the trend continued, with Heilongjiang, Xinjiang, and Qinghai in the third tier, and the rest in the second tier or higher. The first tier mainly consists of economically advanced provinces and cities, which form the core of the network and can quickly establish connections with others, while the second tier includes peripheral regions, where geographical factors may limit interaction and depend on the development of central areas.
Plate Structure Analysis
These 30 cities are categorized into four segments, with the cities in each segment listed in Table 5. The spatial linkages and spillover effects among these segments are detailed in Table 9.
Table 6 reveals that out of 456 spatial correlations, 52 are within segments and 404 are between segments, accounting for 88.6% of inter-segment correlations. For the first segment, it receives 17 internal and 128 external relationships, with 113 spillovers coming from outside the segment. The anticipated internal relations ratio was 37.93%, but the actual figure was only 13.08%, indicating prevalent "two-way spillovers." In the second segment, there are 103 outside and 15 inner receiving relationships, with 60 spillovers from outside, leading to an actual internal relations ratio of 20% against a forecasted 27.59%, marking it as the "primary beneficiary effect." The third segment shows 15 internal and 95 external receiving relationships, with 150 external spillovers. Its internal relational rate was expected to be 17.24% but turned out to be 9.09%, classifying it as a "major spillover effect" area. The fourth segment has 5 internal and 78 external receiving relationships, with 81 external spillovers. Its internal relations ratio, projected at 6.9%, was actually 5.81%, making this segment a broker segment.
The density matrix between the segments is computed in this study in order to further investigate the correlation. The multivalued density is also converted into an image matrix. Taking the average spatial association network density of the study object, 0.4897, as a benchmark, values in the network density matrix greater than 0.4897 indicate a density level above the overall network level, denoted as 1; otherwise, it is denoted as 0. The distribution of GIE spillovers is demonstrated by the results, which are displayed in Table 7. In the density matrix, the magnitude and intensity of spillover impacts are directly correlated. The findings indicate spillovers from the first segment primarily affect the third and fourth segments. The second segment's spillover effects mainly impact the fourth segment, while the third and fourth segments influence all segments. In the image matrix, the first segment is a bi-directional spillover segment with a value of 1 with the third and fourth segments and a value of 0 with the others. The second segment, identified as the main beneficiary segment, has a value of 1 only with the fourth segment. Both the third and fourth segments have a value of 1 for all segments.
Fig. 9.
The spatial relationship network of green innovation efficiency in the logistics industry is close to the spatial distribution of centrality.
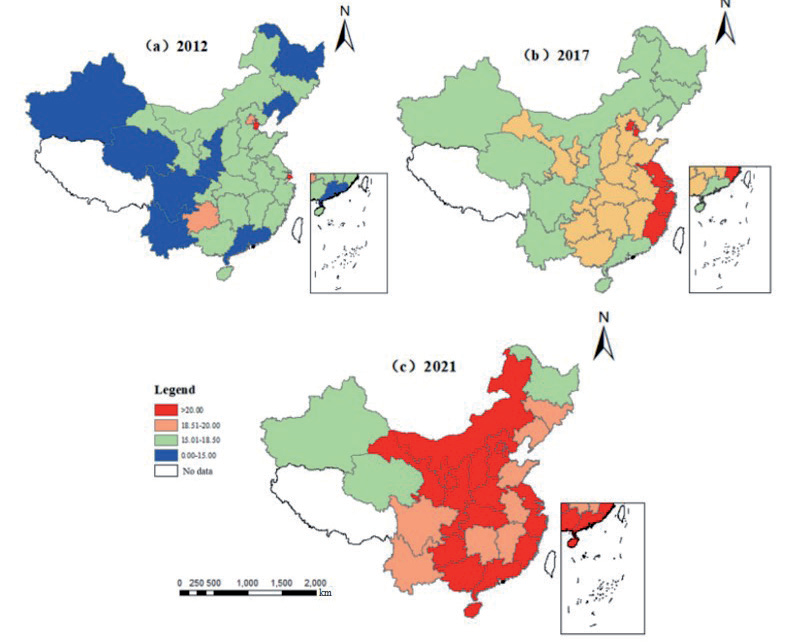
Table 5.
Distribution of cities in the four sectors.
The internal relationships between the various innovative green efficiency segments in the Chinese logistics sector are depicted in Fig. 10. The foremost segment acts as the primary driver of innovative green efficiency, while the fourth segment serves as a pivotal bridge in the transmission mechanism, highlighting a pronounced disparity between the GIE segments of the logistics sector.
Analysis of Drivers of Green Innovation Efficiency in the Logistics Sector
The analysis of drivers, as presented in Table 8, shows that all six elements passed the correlation test (P < 0.1). The openness to the outside world is not significant at the 10 percent level, according to the QAP regression analysis outcome, which is shown in Table 9. Consequently, the spatial network framework for GIE in the Chinese logistics sector is primarily influenced by five factors: spatial proximity, industrial structure, technological level, energy use rate, and urbanization level. Spatial proximity is positively correlated at the 1% level, indicating it is the largest driver. This suggests that closer geographical proximity between cities enhances spatial correlations and spillovers in the spatial network structure of GIE within the logistics sector across Chinese provinces and cities.
Table 6.
Spillover effects between the four sectors.
Discussion
Improving the efficiency of green innovation is the key to promoting the sustainable development of China's logistics industry. This paper uses the SBM super-efficiency model, social network analysis, and QAP to study the GIE of China's logistics industry, which enhances previous research in the field. The results of the study show that the overall GIE of China's logistics industry is on the rise from 2012 to 2021, which is similar to the results of Zhuang Hua et al.'s (2022) study on China's GIE. Although the GIE of China's logistics industry is improving, issues such as energy utilization and science and technology expenditure in the logistics industry have led to slow growth in GIE in most cities. Therefore, the pertinent agencies ought to pay more attention to the logistics sector, make better use of resources for green innovation, and quicken the process of increasing the sector's efficiency in green innovation.
At the provincial level, the study observes a gradual decline in the logistics industry's GIE from east to west, mirroring Yating Zhao's (2023) research on green technology innovation efficiency across Chinese provinces. Tianjin, Hebei, and Jiangsu provinces consistently lead in terms of GIE, indicating efficient use of logistics resources, higher levels of green development, and stronger innovation capabilities. Conversely, Qinghai, Gansu, and Xinjiang exhibit low GIE values because of their underdeveloped economies and minimal investment in capital, labor, and technology within the logistics sector. Therefore, by leveraging information technology through the development of logistics information platforms and other strategies, these areas can enhance logistics activity efficiency, accelerate logistics element transmission, and boost GIE in the logistics sector through increased investment in human and equipment resources.
Within the overall network structure, there is a trend showing that the GIE within the logistics industry across 30 Chinese provinces and cities is higher in the Middle East and lower in the West. This pattern matches the results of Cao Zheng Xu et al. (2023) on the GIE of industrial firms in China. The regions in the east and central enjoy higher efficiency due to their robust economic foundations and advanced technological capabilities. Conversely, the western region's geographical remoteness places it at a disadvantage in terms of GIE within the logistics sector. From an individual network structure perspective, municipalities and provinces in the eastern part of China, which have a high degree of connectivity, demonstrate strong absorptive capacities. They leverage logistics resources from associated regions to foster their economic development, resulting in a significant "siphon effect." Conversely, provinces and cities with extensive outreach are predominantly in China's more developed areas. They act as the "engine" of the spatial network structure for GIE in the logistics industry, driving development in neighboring cities. The intermediary centrality varies widely, with cities like Beijing, Tianjin, and Shanghai serving as "bridges" within the spatial network structure. In contrast, remote areas such as Hainan, Qinghai, and Xinjiang suffer from limited accessibility and a weak economic foundation, leading to minimal interactions with other regions. Establishing inter-regional green innovation cooperation networks could enhance the spatial network structure of GIE in China's logistics industry, promoting more effective and stable communication and cooperation.
Table 7.
Density matrix and image matrix.
Fig. 10.
Correlation between the four major segments of green innovation efficiency in the logistics sector.
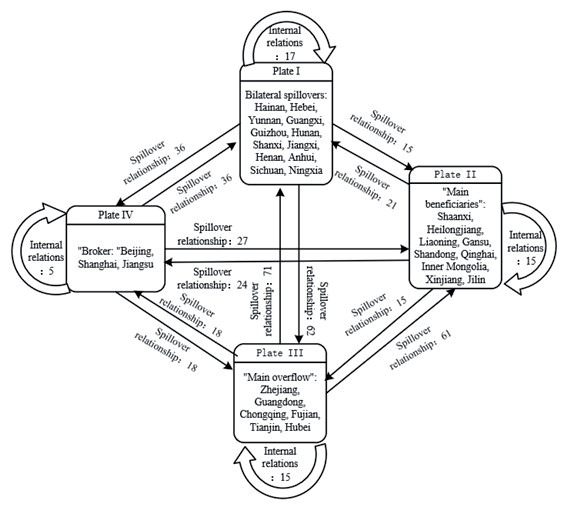
The spatial correlation among the four primary segments of GIE in the logistics industry reveals each segment's unique function within the spatial network structure. These segments collaborate, enhancing the network structure's connectivity. This observation is consistent with Wang et al.'s (2021) findings on the segment structure of GIE in China. The roles of Beijing, Shanghai, and Jiangsu as brokers are prominent, highlighting the importance of facilitating communication within the logistics industry's GIE segments. Enhancing interaction and information exchange among segments, fostering cooperation, and supporting the development of the western and central areas by the eastern areas are crucial. The "main beneficiary" segment should capitalize on the influence of other regions for high-quality development, while the "main overflow" segment needs to adhere strictly to green innovation and efficiency standards. For "bilateral spillover" segments, improving cooperation efficiency through resource and technology sharing is essential.
Table 8.
Analysis results of QAP correlation elements of the spatial correlation network of green innovation efficiency in the logistics industry.
Table 9.
Results of influencing elements of the spatial network structure of innovative green efficiency in the logistics industry.
At the 1% level, there is a considerable correlation between geographic closeness and the study of drivers. This correlation shows that spatial location proximity has a notable effect on the structure of the spatial network of green innovation within China's logistics industry. This result is consistent with the study done by Yao et al. (2022), which also noted how spatial closeness affects green innovation. The concept of node centrality within this context implies that nodes with higher centrality exert more influence and control. Regions with high centrality not only influence but also create spillover effects on adjacent provinces and cities. This phenomenon can be attributed to the advanced economic development of these central regions, which exerts a broader economic influence and propels economic activities in neighboring areas through various channels. Furthermore, distance plays a critical role in the effectiveness of these spillovers between nodes; closer proximity facilitates easier and more natural exchanges of information and economic resources. Consequently, enhancing cooperation and coordination in green logistics innovation across provinces and cities is essential for promoting sustainable green innovation in the logistics industry. By doing so, it is possible to share resources more effectively, optimize transportation routes, improve energy efficiency, and reduce carbon emissions.
This study, however, is not without its limitations. For instance, the selection of evaluation indicators for GIE lacks comprehensiveness, focusing mainly on scientific and technological levels and patent numbers. Future research should develop a more inclusive indicator system for GIE in the logistics industry from a broader perspective.
Conclusion
This paper examines the efficiency of green innovation within China's logistics industry across 30 provinces and cities from 2012 to 2021, analyzing its spatial distribution and determining factors. The study reveals spatial disparities in GIE across the nation. Regions with high efficiency, such as Tianjin, Hebei, and Jiangsu, are located in the eastern part of China. These areas benefit from advantageous geographic positions, advanced economic development, and superior logistics infrastructure. Conversely, regions like Xinjiang, Qinghai, and Heilongjiang in the west demonstrate lower efficiency, attributed to their vast geographic expanses, sparse population distribution, inadequate transportation facilities, and challenges in attracting skilled talent. As national science, technology, and economic levels advance, the GIE in China's logistics sector has shown consistent improvement, with a clear hierarchy of East > Central > West China. At the provincial level, significant disparities exist in GIE, highlighting pronounced regional differences and uneven development across various areas. Four key factors—spatial proximity, industrial structure, technological advancement, and energy utilization efficiency—significantly positively impact the sector's green innovation capabilities (P<0.05). Enhancing inter-regional cooperation, refining the industrial framework, advancing technology, and boosting energy efficiency are pivotal strategies for fostering the logistics industry's green and innovative growth in China.

