

Introduction
Sustainable development aims to achieve ecological health, social responsibility, and economic prosperity [1]. Given that agriculture forms the foundation of environmental, social, and economic well-being [2], it is crucial to explore sustainable agricultural practices. The United Nations made the 2030 Agenda Declaration for Sustainable Development, providing a shared framework for global peace and prosperity. The 17 Sustainable Development Goals form the core of this agenda, functioning as a global call to action for all nations, irrespective of their stage of development.
Currently, academic research is focused on defining “agricultural sustainable development”, quantitatively evaluating its progress, and identifying key influencing factors. The concept of sustainable agriculture is multifaceted, with varying interpretations among scholars [3, 4]. An instance is that of Roy and Chen defining sustainable agriculture, as the practices that satisfy essential criteria while maintaining ecological stability, economic viability, and social equity [5]. Cao and Solangi considered sustainable agriculture to boost agricultural prolificacy, distribute yield impartially, and conserve natural resources [6]. Diverse definitions and metrics of sustainable agriculture underscore its interdisciplinary nature and the necessity for comprehensive monitoring approaches. Researchers have identified indicators such as resource conservation [7], social economy [8], and environmental friendliness [9] to assess agricultural sustainability. By constructing a comprehensive evaluation index system for sustainable agriculture [10–13], researchers have measured and evaluated the SAD level in specific areas and researched the influence of factors such as the digital economy and environmental regulations on SAD by using intermediary effects models; threshold panel mod els; structural equation models and others [14–21].
Overall, the theoretical foundation and research methods in the existing studies on SAD are robust. However, the previous research on the evolution of SAD levels in China is insufficient, especially on the regional agglomeration effect and the spatiotemporal heterogeneity of driving factors. Therefore, this paper uses a variety of spatial econometric models to research the above problems. The main contribution of this paper lies in: (1) An innovative comprehensive index system constructed to measure SAD level, which introduces industry integration indicators; (2) Using Kernel Density Estimation to analyze the spatiotemporal differentiation and evolution of SAD;
(3) The Spatial Autocorrelation model is used to explore the regional agglomeration effect of SAD; (4) Based on the GTWR model, this paper innovatively explores the spatiotemporal heterogeneity of driving factors of SAD, providing new insights for the implementation path towards sustainable agriculture development.
The rest of the paper is arranged as follows: Section 2 outlines the methodological framework and processes underpinning the model construction, along with a detailed account of the data sources utilized in this study. Section 3 expounds on the empirical results and analysis. Section 4 is devoted to the conclusions. Section 5 presents the discussion.
Material and Methods
Construction of an Indicator System to Assess SAD Level
Building on the theoretical foundations of Sustainable Agricultural Development (SAD), this article develops an indicator system that assesses SAD levels in terms of Resource Conservation, Environmental Friendliness, and Production Efficiency. Resource Conservation is reflected in the protection and rational utilization of all kinds of resources in the process of agricultural production, improving resource utilization efficiency to reduce natural resource consumption. Four specific indicators are chosen, namely the water-saving irrigation rate, the cropland replanting rate, the intensity of agricultural electricity consumption, and the level of fiscal support for agriculture. Environmental Friendliness refers to reducing pollution levels in agricultural production for the ecological environment (including greenhouse gas emissions from agricultural production). Select six specific indicators, including fertilization intensity, pesticide usage, agricultural membrane usage, agricultural Chemical Oxygen Demand (COD) emissions, agricultural ammonia nitrogen emissions, and the crop disaster rate. Production Efficiency refers to the comprehensive improvement of economic, ecological, and social benefits. Six specific indicators are identified, encompassing unit grain sowing area yield, unit agricultural machinery power output value, labor productivity, land output rate, the structural composition of the agricultural industry, and the degree of industry integration.
Using the Panel Entropy Weighting Method to Weight the Indicators
The Shannon Entropy Weighting method is an objective technique used to assign weights to indicators based on the magnitude of their information entropy. In addition, panel data can offer additional insights into the dynamic behavior of the samples. When exploring the development of SAD, it is also crucial to investigate how SAD has evolved over time in response to various factors in different provinces. Consequently, the panel entropy method is used in this article as a weight indicator.
Table 1 shows various indicators and weights. The indicator attribute “positive” means the value increases with the indicator data; “negative” means the value decreases with the indicator data. According to the weights and values of indicators, the evaluation value y of SAD in the 31 provinces (excluding Hong Kong, Taiwan, and Macao) from 2013 to 2021 can be calculated.
Table 1.
Index system for sustainable development level of agriculture.
Using Kernel Density Estimation (KDE) to Explore the Evolution of SAD
We used the KDE method to fit the level of SAD in the 31 provinces from 2013 to 2021 to further explore its temporal evolution [25]. KDE is a non-parametric data distribution detection model that fits the distribution properties of the data [26]. As a statistical inference method based on data samples, Kernel Density Estimation does not need to make too many assumptions about the population distribution, so it can better reflect the actual situation of the data. The model form is as follows
where N = 31 is the sample size, yi is the level of SAD in the i-th province, K(∙) is kernel function, h is density estimation bandwidth. Given that the Epanechnikov Kernel is optimal in terms of minimizing mean square error when determining the optimal bandwidth, and considering its minimal efficiency loss, this study selects the Epanechnikov Kernel as the kernel function, as outlined below.
Exploring the Agglomeration Effect of the Spatial Autocorrelation Model
Spatial Autocorrelation analysis enables the identification of spatial correlation patterns in the Sustainable Agricultural Development (SAD) levels across the 31 provinces examined in this study. The Global Moran’s I is employed to assess the presence of spatial clustering phenomena, and its calculation formula is provided below.
where wij is the adjacency weight of the i-th and j-th provinces. If the i-th and j-th provinces are adjacent, then wij = 1, otherwise wij = 0. To meet the needs of the model, Hainan and Guangdong are defined as adjacent and specifies wij = 0, if i = j.
The null hypothesis can be rejected, as the significant p-value suggests that the feature is not randomly distributed in the study area. At this stage, Local Moran’s I can be applied to identify the location, extent, and significance of agglomeration, and its calculation formula is provided below.
If Ii > 0, represents the spatial pattern of high-level provinces gathering to form a high-high agglomeration zone or low-level provinces gathering to form a low-low agglomeration zone; Conversely, Ii < 0 reflects the formation of high-low or low-high patterns, where high-level and low-level provinces interact.
Constructing a GTWR Model to Explore the Driving Factors of Agricultural Sustainability
The degree of SAD varies amongst provinces due to variations in their natural environments, geographic locations, and socioeconomic developments. This paper begins by examining the relationship between humans and the environment and selects five indicators, including Economic Development Level, R&D Investment, Human Capital Education, Agricultural Socialized Services, and Openness Levels. Table 2 shows driving factors and selected indicators. The specific instructions are outlined below.
(1) Economic Development Level.
Areas with high levels of economic development have a relatively high input-output ratio for agricultural production, which is strong in favor of promoting SAD.
(2) R&D Investment.
Technological advancements are pivotal in driving agricultural progress, with R&D investment fostering innovation in agricultural technologies and promoting the sustainability of agricultural development [28].
(3) Human Capital Education.
Human Capital Education has been shown to increase the innovation and flexibility of agricultural producers [29], leading to improvements in the efficiency and quality of agricultural production. This also enhances the competitiveness and resilience of the agricultural sector.
(4) Agricultural Socialized Services.
By providing professional,scientific and efficient services, agricultural socialized service organizations play a crucial role in enhancing various aspects of agricultural supply,including guarantee capabilities, technological innovation capabilities, sustainable development capabilities and international competitiveness. These services facilitate the adoption of sustainable agricultural technologies by smallholders, thereby transitioning conventional agriculture towards sustainable practices [30].
(5) Openness Level.
Advancing the comprehensive internationalization of agricultural practices is crucial for mitigating domestic resource shortages, alleviating resource and environmental pressures, and fostering a conducive environment for Sustainable Agricultural Development (SAD)[31].
This paper uses the GTWR model to explore the impact of these driving factors on SAD. The GTWR model is a regression linear model that periphrastically reflects the spatiotemporal heterogeneity characteristics of the study data by calculating the trends for changes in parameters with time and space [32, 33]. Currently, this method is predominantly applied in analyzing the scale and intensity of carbon emissions, rural settlement patterns, urban planning, and the spread of epidemics. It is less applied to the field of influencing factors in agricultural development, especially the driving factors of sustainable agricultural development. This paper uses the spatiotemporal and geographical weighted regression model to analyze the influence of various factors on agricultural sustainable development from the perspective of time and space and provides theoretical support and empirical experience for formulating relevant policies to promote agricultural sustainable development. The model is structured as follows.
Table 2.
The driving factors of China’s sustainable agricultural development level.
where yi is the SAD level of the i-th province, xik is the observed value of the k-th driving factor in the i-th province, (ui, υi) is the spatial position coordinate of the i-th province, ti represents the corresponding time dimension, βk(ui, υi, ti) is the regression coefficient of the k-th driving factor in the i-th province, β0(ui, υi, ti) is the spatiotemporal intercept of the i-th province, and εi represents the random error. If βk > 0, then there is a positive correlation between the SAD and driving factors; otherwise, it is a negative correlation. The weighted least square method (WLS) is used to calibrate the GTWR model. The matrix expression of the estimated coefficients of the i-th province can be given as shown in formula (7).
Using the method of Huang et al. [33], the weight matrix is constructed based on adaptive bandwidth, Gaussian kernel function, and Euclidean distance.
Data Source and Processing
The data used in this study mainly comes from the China Statistical Yearbook, the China Statistical Yearbook on Environment, the China Agricultural Products Processing Yearbook, and the statistical yearbooks of provinces. Any missing data was completed using an interpolation method.
Results and Analysis
The Measurement Results of the SAD Level
This article used the panel Entropy Weight method to measure the evaluation index system of SAD [34] mentioned above and obtain the level values in 31 provinces in China from 2013 to 2021. Table 3 displays the results.
From a national perspective, the average level of SAD has been increasing year by year, from 0.326 in 2013 to 0.422 in 2021, with an average annual growth rate of 3.28%. This demonstrates China’s SAD is accelerating, and agriculture is transforming and upgrading. In addition, as can be seen from the measurement results, the level of SAD in China’s provinces from 2013 to 2021 showed significant spatial heterogeneity changes.
Table 3.
The level of sustainable agricultural development in 31 provinces of China.
Based on a comparative analysis across provinces, Shanghai (0.546), Beijing (0.516), and Tianjin (0.487) rank highest amongst the provinces in terms of average sustainable agricultural development from 2013 to 2021. These three provinces have strong capacities for innovation in agricultural technology, high levels of economic development, and conditional advantages in SAD. The bottom three provinces are Xizang (0.234), Qinghai (0.251), and Yunnan (0.270). These three areas face limitations in terms of local agricultural resources and technological advancements, resulting in a relatively underdeveloped state of SAD.
The top three provinces are Hainan (7.776%), Guizhou (6.766%), and Zhejiang (5.86%) in terms of the growth rate of SAD levels; Jilin (-1.55%), Liaoning (0.04%), and Inner Mongolia (0.77%) are the lowest three provinces.
The Spatiotemporal Evolution of SAD
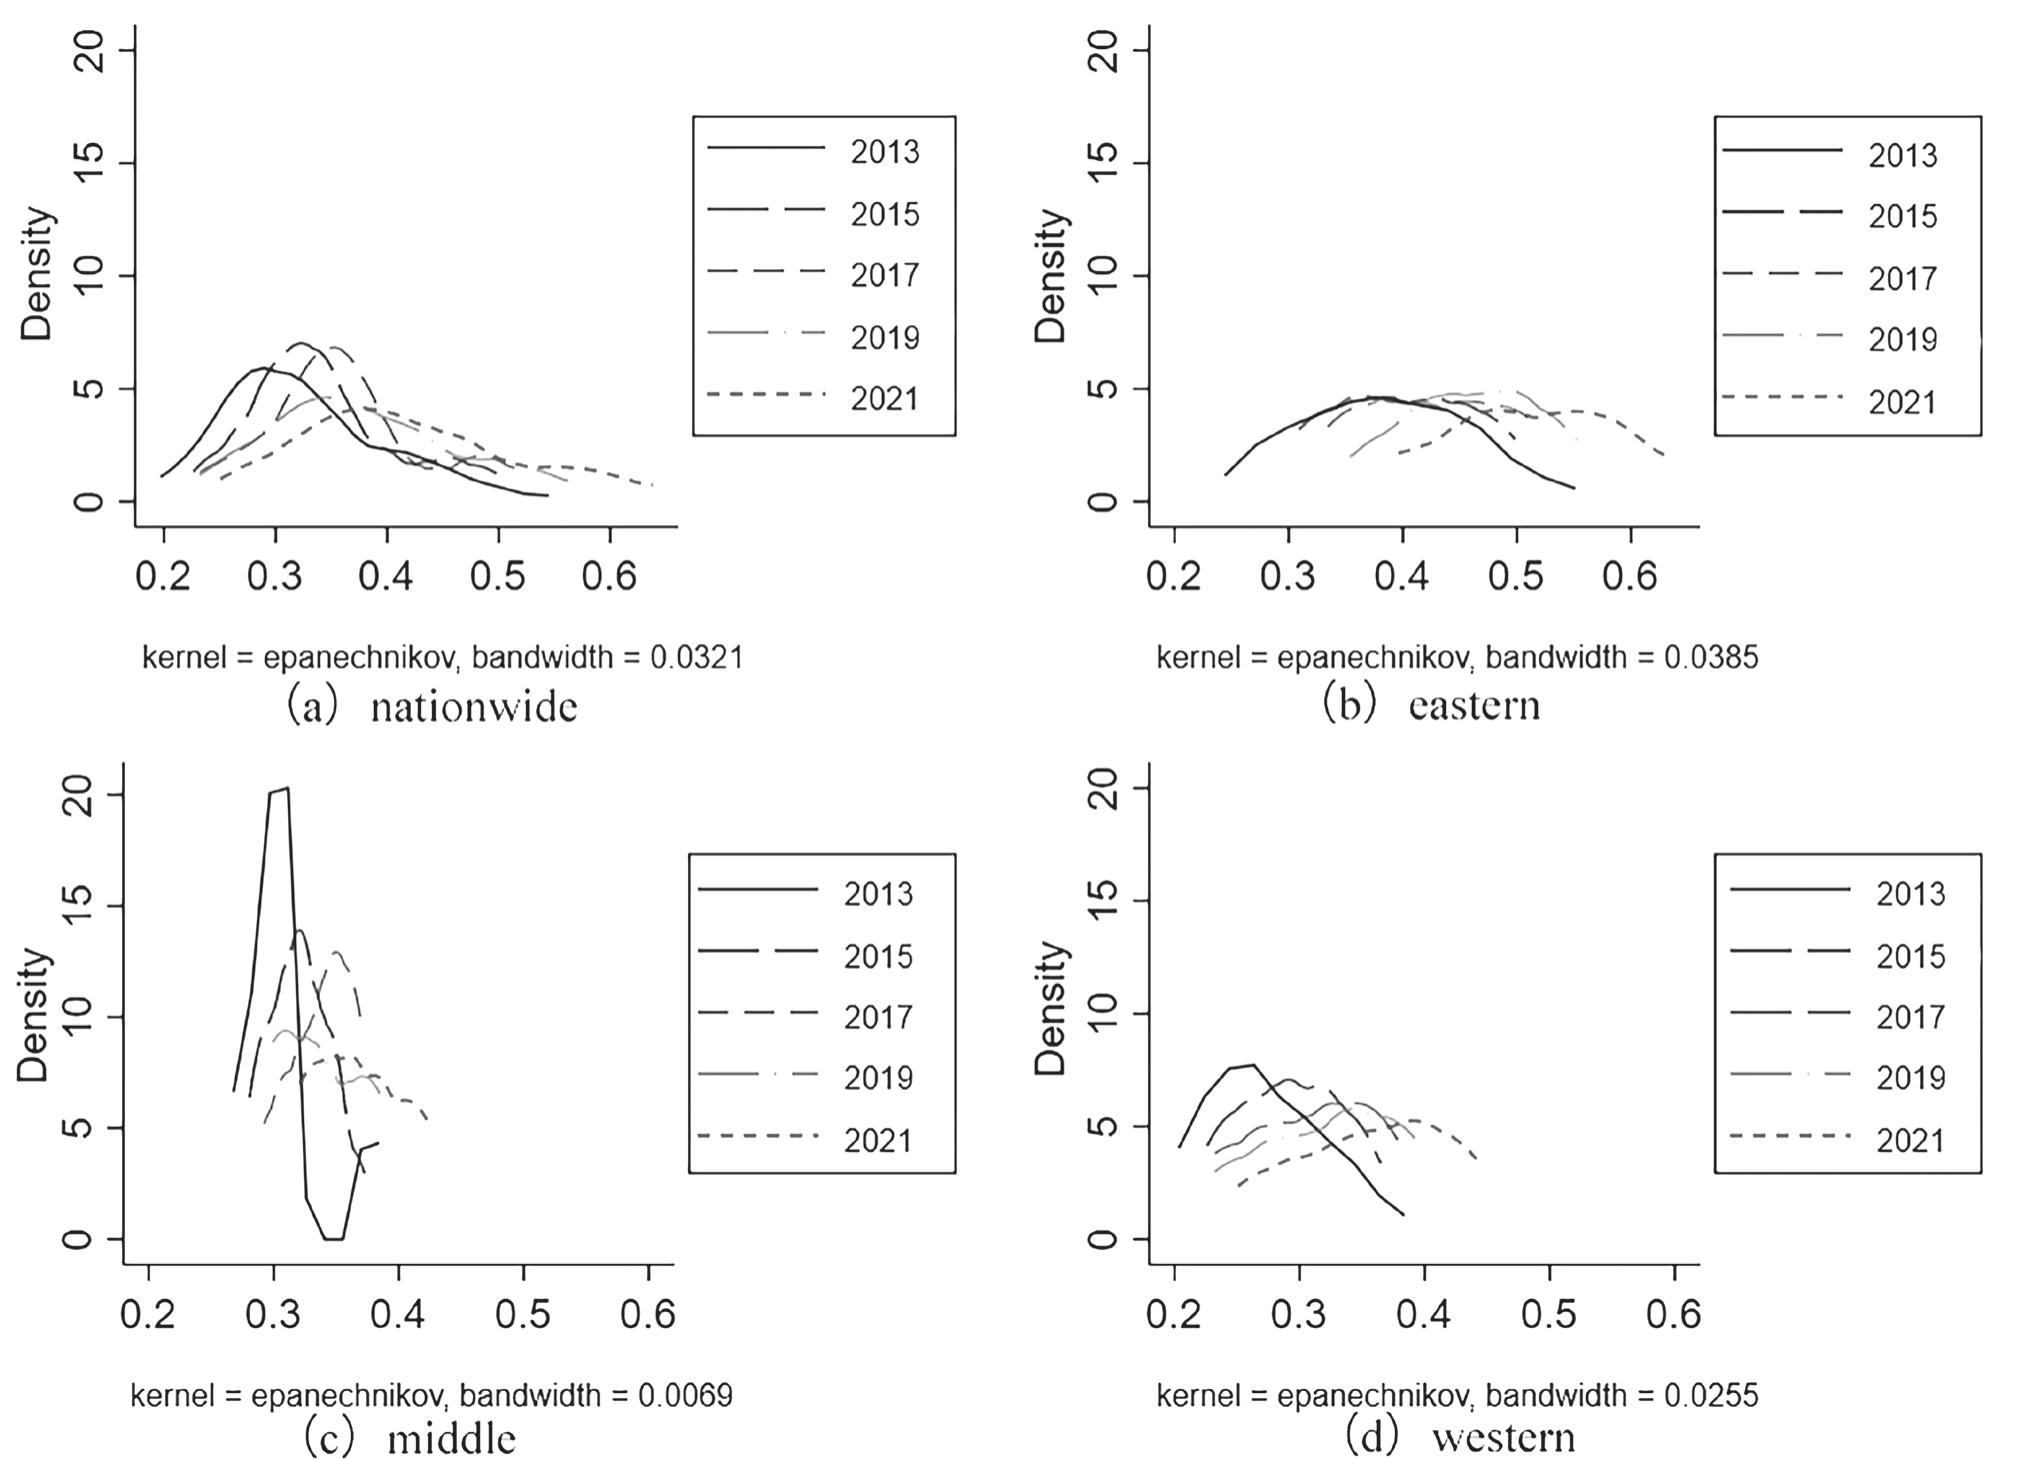
During the period of 2013 to 2021, the kernel density curves for SAD in different provinces, including the eastern, central, and western regions, all moved towards the right. This suggests that the level of SAD has progressively improved over time. There was a notable improvement in the degree of SAD in the eastern and western regions, as evidenced by the comparatively large changes observed in these regions, whereas the central region experienced relatively small changes (Fig. 1). The distribution pattern indicates that the primary peak of kernel density in the eastern region remains relatively stable, with an overall rightward shift in the estimated curve, indicating minimal internal variations within this region. However, in the central and western regions, there has been a consistent decrease in the main peak value of kernel density estimation each year, accompanied by an increase in bandwidth width. This suggests a widening gap in the levels of sustainable agricultural development among provinces in these regions. The maximum level of sustainable agricultural development at the national level experiences a rise followed by a decline, with the range of variation gradually expanding. The distribution shape indicates a “weak double peak” on the 2021 curve in the eastern region, but the difference in peak values is not statistically significant. Furthermore, the country’s overall curve displays a single peak and a gradually elongating right tail, suggesting that high-level provinces of SAD are emerging and the overall level of SAD is continuously improving.
Spatial Differentiation and Agglomeration Effect of SAD Level
Each province’s sustainable agricultural development level is categorized into four stages based on the maximum, minimum, and average levels of China’s SAD for each year: low level, medium-low level, medium-high level, and high level. A general improvement phenomenon of SAD was observed in different Chinese provinces between 2013 and 2021 (Fig. 2), and there was a significant overall spatial distribution heterogeneity, indicating a high level of development in the eastern coastal region and a low level in the western inland and northeastern regions. From the perspective of regional evolution types of SAD level, from 2013 to 2021, the proportion of low and medium-low level development cities gradually decreased from 38.71% in 2013 to 9.68% in 2021, and SAD in coastal provinces gradually entered a high level.
Using Stata17 software to calculate the Global Moran’s I index from 2013 to 2021. The results are shown in Table 4.
The Moran index exhibited a p value below 0.05 across all years, indicating statistical significance. The results indicate a significant positive relationship between the level of SAD across various provinces in China. Moreover, the global Moran index has shown a consistent increase each year, indicating a strengthening agglomeration effect of these trends within each province over time. This shows that the nation has advocated ecological construction and sustainable development since the 12th Five Year Plan, and several provinces have stepped up their efforts to enhance SAD. The agglomeration effect has been strengthened by neighboring provinces’ experience with and borrowing from sustainable agricultural development initiatives.
Draw Local Moran’s I scatter plots for 2013, 2017, and 2021 (Fig. 3), with the four quadrants corresponding to four types in turn: high-high agglomeration zone, low-high agglomeration zone, low-low agglomeration zone, and high-low agglomeration zone. A high-high agglomeration zone refers to a region where both the province itself and its neighboring provinces exhibit high levels of sustainable agricultural development (SAD). Similar interpretations apply to other agglomeration patterns in different regions.
High-high agglomeration zones are primarily found in China’s eastern regions, which include Beijing, Tianjin, Jiangsu, Shanghai, and Zhejiang, as Fig. 3 illustrates. Guangdong and Hainan also displayed a high-high agglomeration situation in 2021. In the meantime, the high-high agglomeration zones progressively moved from the northeast to the southeast over time. Western China is the primary location for low-low agglomeration zones. These regions include Yunnan, Xizang, Ningxia, Gansu, Qinghai, Guizhou, and Shanxi. It’s evident that there is an obvious spatial agglomeration in SAD across different provinces, which is constrained by things like the natural geographic setting and the economic climate.
Analysis of Driving Factors for SAD
Analysis of Basic Regression Results
Based on the global linear regression model, using R4.2.2 software (RStudio) to estimate the coefficients. Table 5 demonstrates that the Economic Development Level, R&D Investment, Human Capital Education, Agricultural Socialized Services, and Openness Level exhibit a positive impact on SAD, aligning with the anticipated findings. Furthermore, all statistical tests conducted met the criteria for statistical significance at a 5% level. From the diagnostic information of the global regression model, if the variance inflation factor (VIF) of each explanatory variable is less than 7.5, it can be considered that there is no significant multicollinearity between the explanatory variables. At the same time, it was found that the determinability coefficient of the model was relatively high (R2 = 0.8172), indicating a good fit of the global regression model and a strong explanatory power of the model.
Fig. 2.
The level and changes of sustainable agricultural development in various provinces of China in 2013, 2017, and 2021.
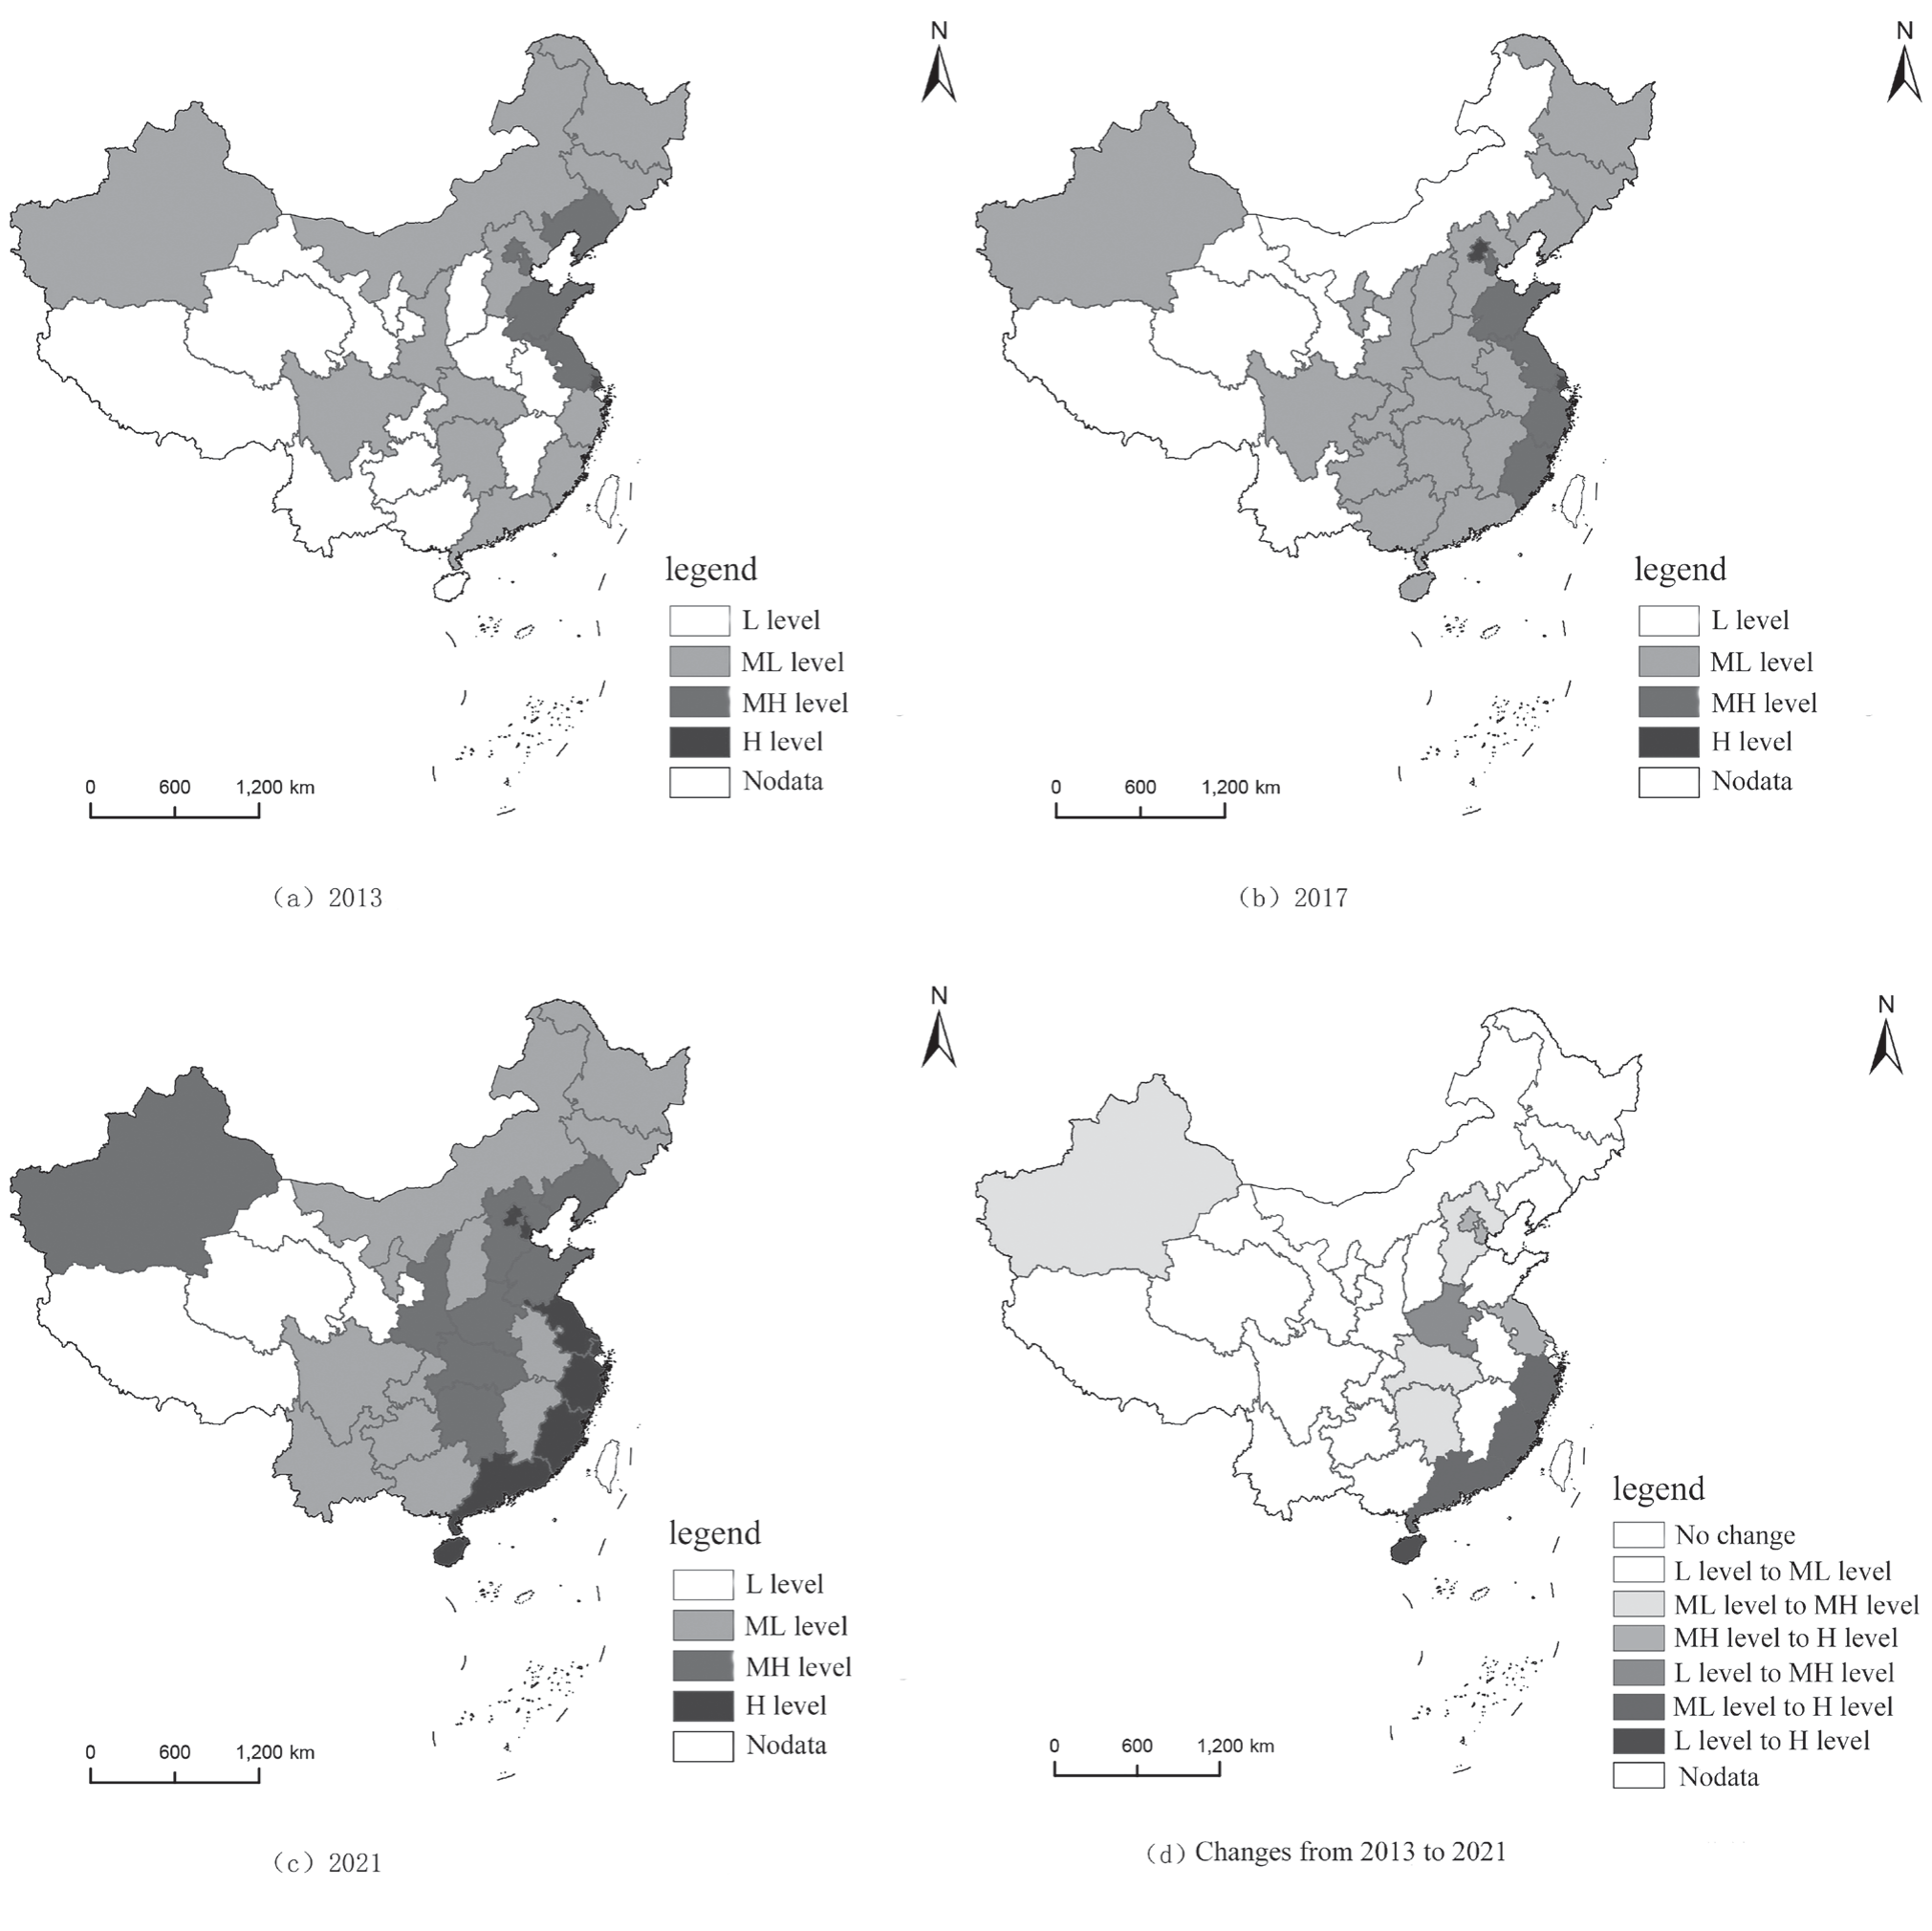
Table 4.
Global Moran’s I index of the level of sustainable development in agriculture.
Fig. 3.
Scatter plot of the Moran Index for the overall level of sustainable agricultural development in various provinces across China in 2013, 2017, and 2021.
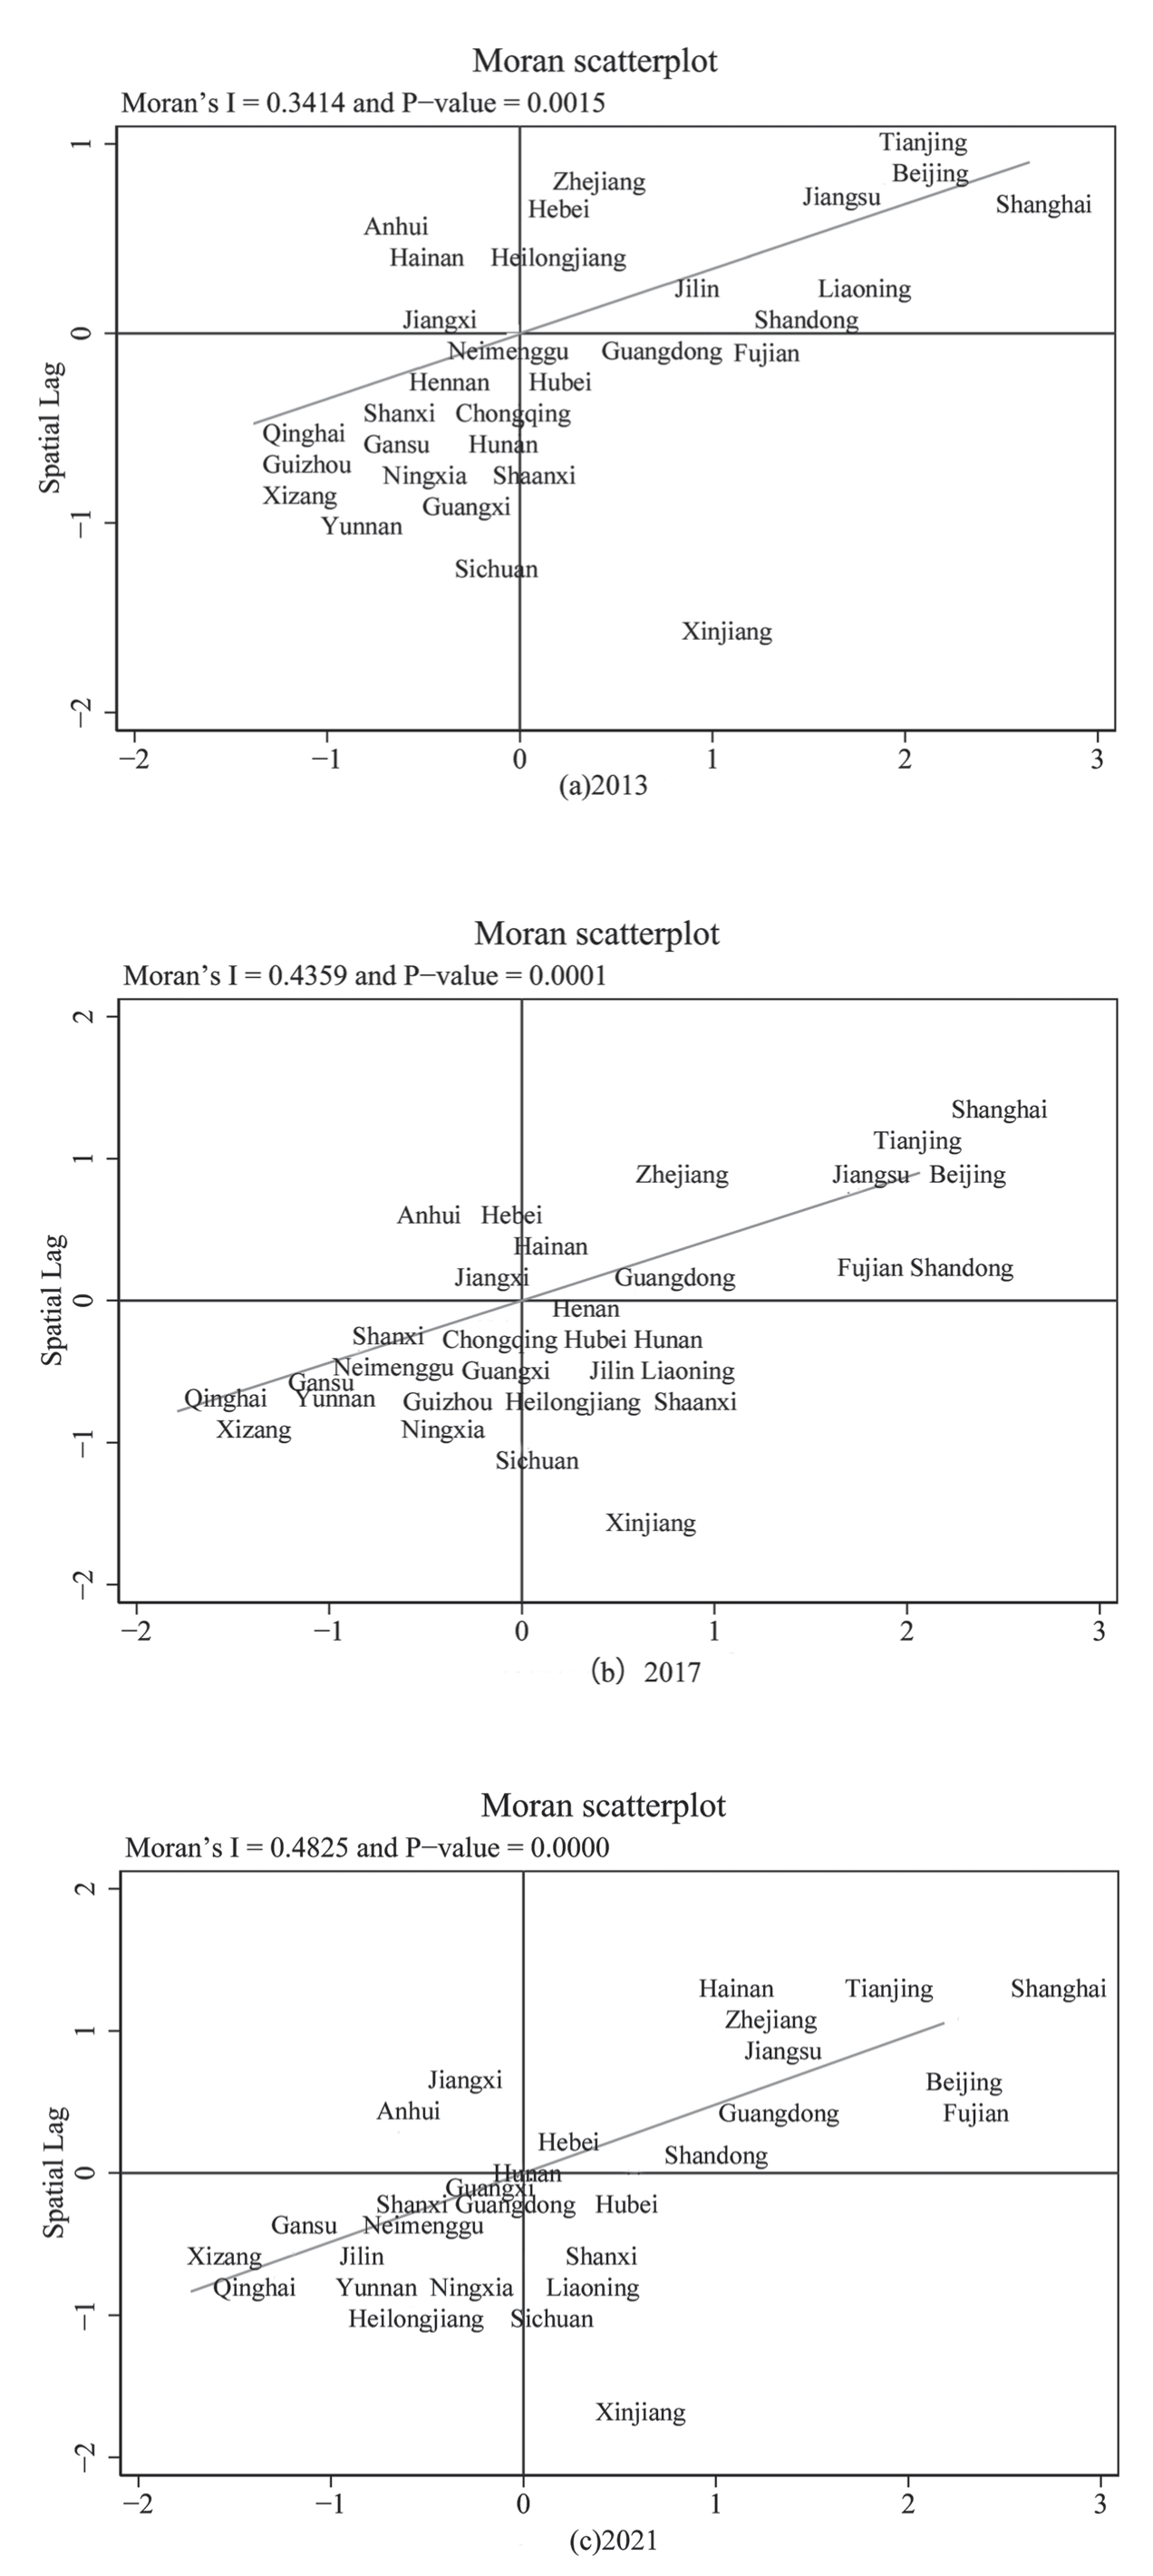
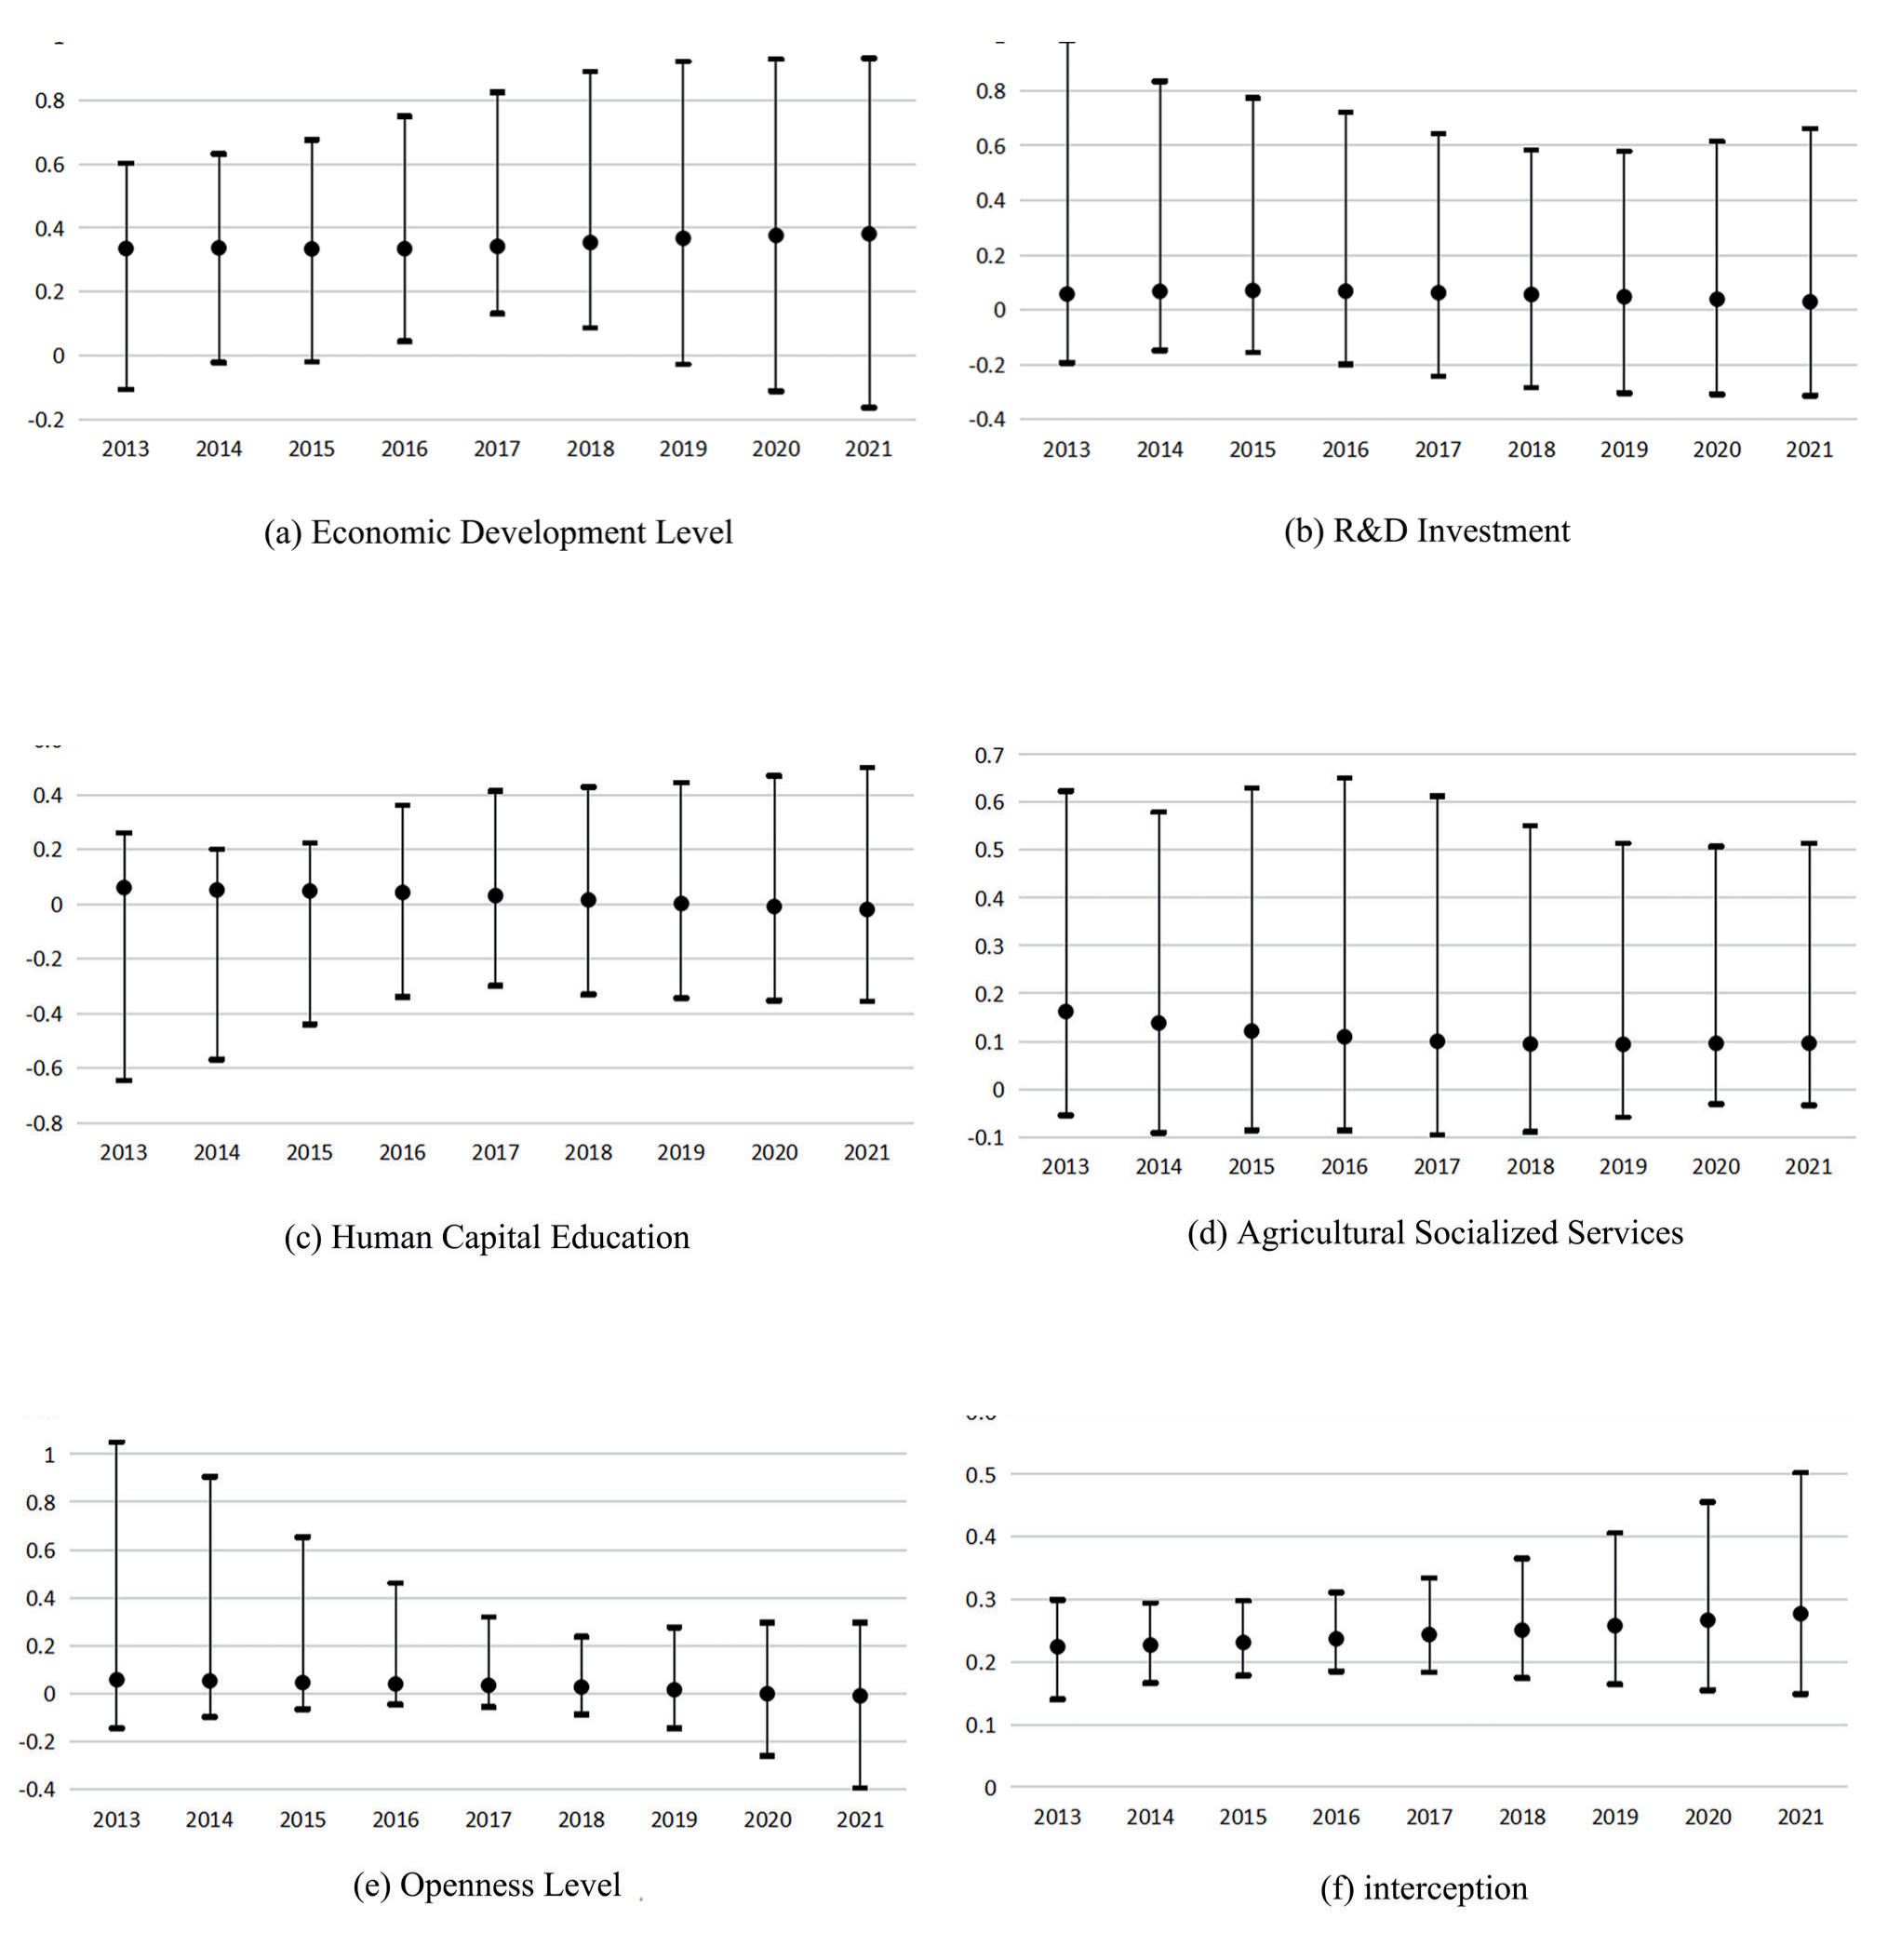
Table 5.
Basic linear regression results.
Analysis of GTWR Model Results
As mentioned above, the data is multicollinearity-free and passed the Moran test, satisfying the prerequisites for the GTWR model. Based on the GTWR module in ArcGIS 10.8 software, we conducted a regression on the driving factors of SAD in various provinces of China from 2013 to 2021. To further verify the spatiotemporal heterogeneity of driving factors in various provinces, this paper compared the fitting effects of different models. Compare the calculation results of Time Weighted Regression (TWR), Geographically Weighted Regression (GWR), and Geographically and Temporally weighted regression (GTWR) models. The result shows that the AICc of TWR is -1054.99, R2 = 0.819 and adjusted R2 = 0.816; the AICc of GWR is -1184.04, which R2 = 0.907 and adjusted R2 = 0.906; and the AICc of GTWR is -1395.39, R2 = 0.970 and adjusted R2 = 0.969. The fitting results of GTWR are significantly better than those of TWR and GWR.
The Influence of Driving Factors Presents Temporal Heterogeneity
Unlike OLS, GTWR gives the coefficients of each independent variable at different times and locations. If the coefficient is positive, it indicates that the driving factor has a positive effect on the dependent variable. On the other hand, if the coefficient is negative, the driving factor has an inhibitory effect on the dependent variable. The greater the absolute value of the coefficient, the stronger the effect. In general, the Economic Development Level, R&D Investment, and Agricultural Socialized Services work to support the SAD. The influence of Human Capital Education and Openness Level on SAD has gradually changed from being supportive to inhibitive (Fig. 4). Additionally, each explanatory variable’s influence shows time heterogeneity behavior.
According to Fig. 4 (a), the average regression coefficient of the Economic Development Level fluctuated from 0.335 (2013) to 0.381 (2021). This is because the nation first proposed the goal of “overall improvement of ecological environment quality” during the 13th Five Year Plan period, which forced provinces to deepen measures about SAD. Simultaneously, the establishment of the initial set of National Sustainable Agricultural Development Demonstration Zones, completed towards the close of 2017, additionally bolstered the stimulating influence of economic development on SAD.
Fig. 4(b) presents an inverted U-shaped feature where the average regression coefficient of R&D Investment gradually increased from 0.058 (2013) to 0.070 (2015) and then decreased to 0.029 (2021). This suggests that as time goes on, agricultural technology research and development has become more mature, while the factors driving the level of sustainable agricultural development are gradually diminishing.
The average Human Capital Education regression coefficient dropped from 0.061 (2013) to -0.019 (2021), as shown in Fig. 4(c). In contrast to technological investment, the current human capital aggregation resulting from SAD is predominantly low-level. Although it encourages economic growth in the short term, it also creates obstacles for the later stages of regional agriculture’s upgrading and transformation, which limits the advancement of SAD.
As shown in Fig. 4(d), the average regression coefficient of Agricultural Socialized Services decreased gradually from 0.162 (2013) to 0.0961 (2021). This is a result of the three industries’ ongoing promotion of rural integration, which raises the standard of Agricultural Socialized Services across different areas. The impact of Agricultural Socialized Services on Sustainable Agricultural Development (SAD) has progressively diminished in recent years compared to the early stages of development. This decline is attributed to the continuous advancements and improvements in various aspects of agricultural development, including material supply, technical services, information services, financial services, production services, insurance services, and agricultural product sales.
The average regression coefficient of the Openness Level has gradually dropped from 0.058 (2013) to -0.008 (2021), as shown in Fig. 4(e). This is due to the increasing caution in opening agricultural products to the international market, driven by the current complex global landscape and the need to safeguard national security. Consequently, the influence of openness on Sustainable Agricultural Development (SAD) has progressively diminished.
The Influence of Driving Factors Presents Spatial Heterogeneity
This study visualizes the regression coefficient intervals of each driving factor and investigates their spatial heterogeneity to intuitively describe the impact of various driving factors on SAD in various provinces. Using the natural breakpoint principle, we found the mean of the regression coefficients for each driving factor from 2013 to 2021, as indicated in Fig. 5.
The regression coefficient of the Economic Development Level from Fig. 5(a) demonstrates a trend of increasing from north to south. Economic Development in Guangdong, Guangxi, and Hainan provinces has a significant impact on SAD. This is attributed to the higher level of economic development in the southern region, where agricultural development initiated the green transformation earlier, providing substantial momentum for the sustainable development of agriculture. The northern and western regions are experiencing a slight slowdown in economic development, and there is little to no impact of this on SAD.
From Fig. 5(b), (c), and (d), we can observe that the regression coefficients for R&D Investment, Human Capital Education, and Agricultural Socialized Services all exhibit a consistent upward trend from the southeast to the northwest. This is due to the higher levels of R&D Investment, Human Capital Education, and Agricultural Socialized Services in the southeast, leading to a maturing and stabilizing impact on SAD. In contrast, the northwest is experiencing rapid growth in technology, human capital, and agricultural services for sustainable development in agriculture, resulting in a greater overall impact.
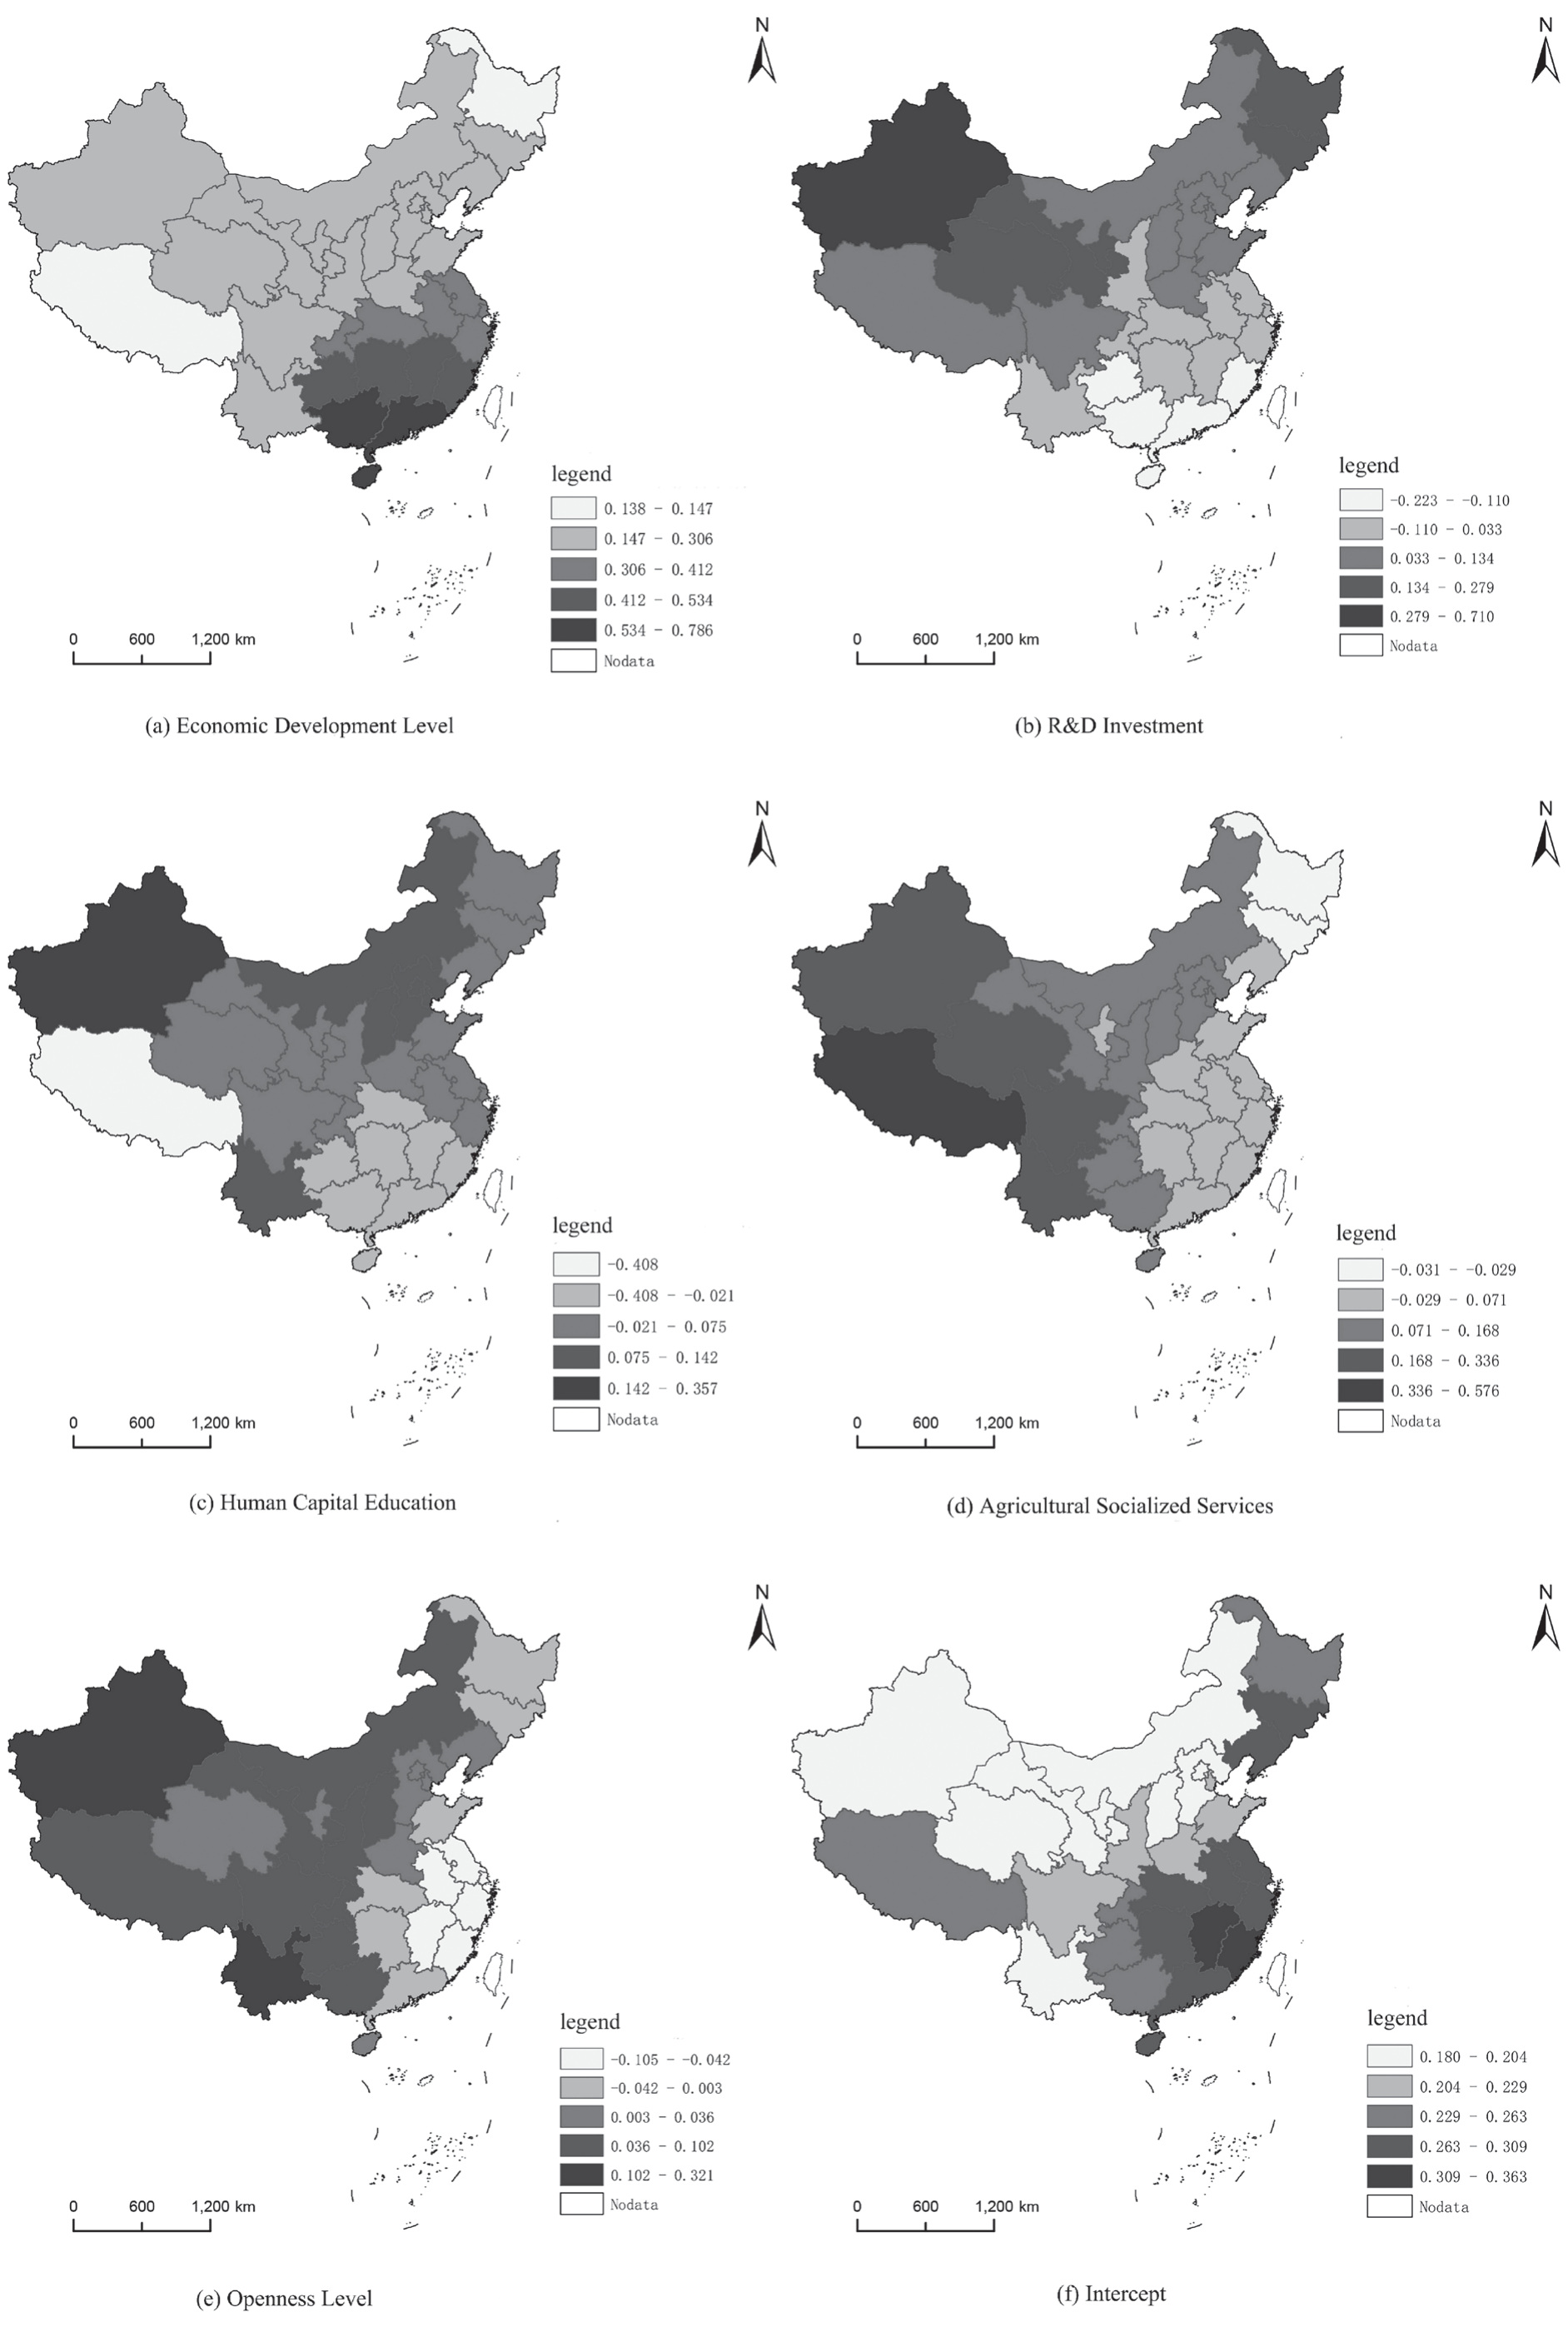
From Fig. 5(e), the regression coefficient of Openness Level shows an increasing trend from the eastern coastal areas to the western inland areas, indicating that Openness Level in the eastern coastal areas is relatively high. As the level of Sustainable Agricultural Development (SAD) continues to improve, its impact has gradually diminished. However, in recent years, with the persistent advancement of international trade initiatives such as the Belt and Road Initiative, the openness level of the western inland regions has progressively increased, resulting in a greater influence on SAD.
From the above analysis, the impact of various driving factors on the level of SAD shows spatial heterogeneity.
Conclusions
This article uses various econometric methods such as panel Entropy Weight method, Kernel Density Estimation, Spatial Autocorrelation analysis, and GTWR model to comprehensively measure the level of SAD in 31 provinces in China from 2013 to 2021 and analyze their spatiotemporal evolution and driving factors. The main conclusions are as follows.
Between 2013 and 2021, the level of SAD in China’s provinces increased annually. It exhibits significant spatial heterogeneity. The southeastern coastal areas had high levels of SAD, while the western inland areas and northeastern regions had low levels of the same development.
The level of Sustainable Agricultural Development (SAD) across Chinese provinces from 2013 to 2021 demonstrates a strong positive correlation, with the agglomeration effect in individual provinces intensifying over time. The majority of the high-high agglomeration zones are found in China’s eastern provinces, including Beijing, Tianjin, Jiangsu, Shanghai, and Zhejiang. Low-low agglomeration zones are mostly found in western China, primarily in the provinces of Yunnan, Xizang, Ningxia, Gansu, Qinghai, Guizhou, and Shanxi. Over time, the high-high agglomeration zones progressively move from the northeast to the southeast.
Overall, the Economic Development Level, R&D Investment, and Agricultural Socialized Services have a positive promoting effect on SAD. The impact of Human Capital Education and the Openness Level on SAD has gradually shifted from positive promotion to negative inhibition. The influence of each explanatory variable exhibits temporal and spatial heterogeneity.
Discussion
For the establishment of the indicator system for SAD, some scholars have examined the entire life cycle of agricultural production by integrating the developmental process from input, through production to output [35, 36]. Several scholars have measured Sustainable Agricultural Development (SAD) across three dimensions, namely the economy, society, and environment [37, 38]. Building upon these three levels — Resource Conservation, Environmental Protection, and Efficient Production — this study introduces two additional indicators, the Structural Form of Agricultural Industry and the Level of Industrial Integration. The rationale for this inclusion is that the advancement of industrial integration supports environmental conservation and ecological sustainability [39, 40]. For example, ecological agriculture combines the principles of traditional farming with modern agricultural technologies and auxiliary activities. This not only optimizes the efficient use of agricultural resources, but also emphasizes the scientific preservation and restoration of agricultural ecosystems [41]. On the other hand, industrial integration can promote rural and social sustainable development [42]. The government will also introduce various favorable policies and measures to attract the young and middle-aged labor force, college students, and others to return to their hometowns for entrepreneurship or employment, fully utilize various rural resources, and stimulate new vitality in SAD.
To enhance the SAD in China, it is imperative to address the disparity in levels of development between the southeastern and western inland regions and the northeastern regions. Each province and region should leverage its distinct resources to strategically develop and utilize a range of natural resources. Furthermore, they should leverage their strengths to foster the growth of environmentally friendly and sustainable agricultural practices and harness agglomeration effects to facilitate the inter-regional exchange of capital, technology, and resources.
There are still some shortcomings in this paper that need further refinement in subsequent research. In future studies, the possible interaction between various factors and indirect effects can be further considered. For example, environmental regulation [43], digital construction [44], and energy security [45] may affect economic growth and then influence sustainable agricultural development levels. Besides, considering that some data were missing due to inconsistent implementation of agricultural development policies in various provinces, we did not include policy factors in the driving factors, which may affect the accuracy of the model. We will continue to pay attention to the policy effect and incorporate it into the model as a possible driving factor after data becomes available in the future.

