

Introduction
Data collected by WRI over the past 30 years indicate that economically developed nations have been more successful in managing and stringently controlling carbon emissions compared to other countries [1]. After the turn of the 21st century, developing countries like China emitted far more carbon. China overtook the US as the world’s greatest carbon emitter in 2004. And it’s top three carbon emitters were Jiangsu, Hebei, and Shandong in 2011, surpassing Texas. Nine of the top ten US and Chinese carbon-emitting provinces were in China the same year [2-4]. The interconnected planet and the common destiny of its inhabitants make rising carbon emissions a significant issue for both domestic and international states. China’s carbon emission reduction is challenging; therefore, action should be taken on time.
Hence, the Chinese government suggested a “dual carbon” plan at the 2020 UN General Assembly, aiming to peak China’s carbon emissions by 2030 and become carbon neutral by 2060 [5]. China’s 2020 carbon emissions were 48.4% lower than in 2005 and 3.4% higher than expected, easing pressure on global carbon emissions and contributing to the world’s carbon emissions, demonstrating China’s spirit of responsibility as a responsible great nation and cooperation, according to China’s 2021 white paper, “China’s Policies and Actions to Address Climate Change.” It shows China’s responsibility and cooperation with other nations [6]. China’s economy has grown since opening, and the population’s outlook has changed. However, to achieve green and low-carbon development, society must find ways to promote economic growth while safeguarding the environment from industrialized production processes that use fossil fuels [7]. The effect of the real economy is greatly influenced by financial development, which is a crucial part of the process of actual economic development [8]. On one hand, finance, as a critical factor in production, plays a pivotal role in adjusting industrial structures, promoting the research and development of green technologies, and facilitating the green transformation of industries. On the other hand, the advancement of financial development could potentially lower financing thresholds, exacerbating the issues of regulatory oversight in small and medium-sized enterprises, which may in turn lead to intensified environmental pollution. Additionally, financial development and carbon dioxide emissions each exhibit spatial spillover effects, and disparities in the level of financial development across regions may affect the geographical distribution of carbon emissions. Thus, a thorough investigation into the relationship between financial development and carbon emissions holds significant theoretical and practical implications for steering financial resources to support sustainable, low-carbon development.
Currently, research on the impact of financial development on carbon emissions has not yet reached a consensus. Some studies show that financial development reduces carbon emissions. Financial development promotes technological advancement and resource efficiency, which conserves energy and reduces emissions. Tamazian et al. [9] found that financial liberalization and openness reduced carbon emissions in the BRICS countries from 1992 to 2004. In Australia and Brazil, financial development has reduced carbon emissions [10]. However, some studies have found that financial development increases carbon emissions. Financial development promotes corporate expansion, which increases energy consumption and carbon emissions. Shahbaz et al. [11] claimed Pakistan’s financial development increased carbon dioxide emissions. Khan et al. [12] examined carbon emissions, tourism, and the financial development index in 34 high-income Asian, European, and American countries. They found that financial development increases energy use and carbon emissions. The expansion of the tourism industry has led to increased trade openness, resulting in a rise in carbon emissions. However, some researchers have found a nonlinear relationship between financial development and carbon emissions, meaning that its effects vary depending on the situation or other factors. They argued that financial development increases short-term carbon emissions but decreases long-term ones [13]. According to Zafar et al. [14], banking development reduces carbon emissions in G7 countries but increases them in N11 countries. In G7 and N11 countries, stock market development indices have the opposite effect on carbon emissions.
Finance plays a pivotal role in environmental protection and the transformation of development modes within market economies [12]. Theoretically, financial institutions can promote the adoption of clean energy and efficient technologies through funding and credit support, thereby reducing carbon emissions; however, if financial resources predominantly flow towards high-pollution industries, they may exacerbate carbon emissions [15]. Thus, examining the spatial correlation between finance and carbon emissions is crucial for precise policy formulation. In practice, regional disparities in China’s financial activities lead to uneven carbon emissions, and these disparities may cause spatial imbalances in carbon emission distribution. Researching this spatial spillover effect can help identify regions that may suffer from heightened carbon emission pressures due to uneven financial development, which is significant for achieving balanced regional development and sustainable national progress. The majority of the existing literature has not considered the spatial correlation between carbon emissions and financial development. There is a lack of research focusing on the regional context of China, which overlooks the spillover effects between financial development and carbon emissions. Therefore, a deeper understanding of the relationship between financial development and carbon emissions in China can provide valuable insights for other nations, especially developing countries striving to balance economic growth with environmental protection.
This study comprises five sections for analysis. “Introduction” section thoroughly reviews relevant literature to elucidate the status of carbon emissions in China and the implementation of carbon reduction policies. “Theoretical analysis” section, drawing on previous scholars’ research, propose hypotheses regarding the impact of financial development on carbon emissions and examine the rationale behind its mechanisms. “Experimental Procedures” section outlines the research design, focusing on establishing variables and models aligned with the study objectives. “Results and Discussion” section presents empirical analysis, exploring the direct effects of financial development on carbon emissions, spatial spillover effects, regional heterogeneity, and threshold effects. Furthermore, robustness tests are conducted to assess the reliability of the research findings. Finally, “Conclusions” section summarizes the research findings and provides practical recommendations for government and business entities.
Theoretical Analysis
Numerous researchers have explored the impact mechanisms among financial development levels, economic growth, and environmental pollution indicators from the perspective of econometric models [16]. Empirical results suggest that the effects of financial development on environmental pollution may be dualistic. Some studies posit that financial development, by expanding financial scale and technological advancement, facilitates shifts in lifestyles, thereby leading to an increase in carbon emissions [17, 18]. Technological progress has facilitated the convergence of finance with digital technology, leading to the emergence of online consumer platforms such as WeChat, mobile banking applications, and Alipay. These platforms have removed temporal and spatial constraints on transactions, streamlining consumers’ transactional processes and lifestyles [19, 20]. Pradeepta Sethi et al. [21] argued that while economic performance is enhanced, the increased levels of globalization and financial development are detrimental to environmental sustainability. In the short term, globalization, economic growth, and increased energy consumption directly lead to environmental degradation. The development of the banking sector negatively impacts sustainable environmental development through the economic growth channel. Khan et al. [22] empirically demonstrated that the interplay between financial development, economic growth, energy consumption, and carbon emissions is accompanied by the spread of high pollution, with energy consumption inhibiting economic growth. Additionally, financial development eases financial constraints by providing online lending services, stimulating consumer spending, and thereby stabilizing market demand [23]. The symbiotic relationship between financial institutions and consumers is crucial for rapid and stable economic growth [24]. Financial development not only raises consumption standards but also spurs economic growth and enriches social activities, which may positively impact carbon emissions [25].
However, some studies claim that financial development can alleviate environmental pressure by influencing industrial structures. Shahbaz et al. [26] validated the Environmental Kuznets Curve (EKC) through empirical analysis of relevant data from France, demonstrating that financial development reduced carbon emissions and thereby improved France’s environmental quality. Furthermore, they argue that financial stability is a necessary condition for improving environmental quality. Wei et al. [27] constructed a panel data model to analyze the relationship between wastewater emissions and regional financial development in China, suggesting that financial development has an inverted U-shaped impact on environmental pollution over a certain period. The research by Hussein et al. suggests a close connection between China’s natural resource exploitation and the rapid development of finance [28]. Higher levels of financial development can steer capital from industries with low efficiency and high costs to emerging industries with high efficiency and low costs, thereby reducing carbon emissions. Nevertheless, due to varying regional development levels, financial resources in less developed areas might prioritize sectors that bolster economic development or are resource-intensive [21]. Based on the above analysis, this paper proposes the following hypothesis:
H1: The impact of carbon emissions is significantly influenced by financial development, i.e., higher levels of financial development encourage higher carbon emissions.
Due to the relative economic, political, technological, and industrial interdependence between neighboring regions, capital and technology investment promote regional interconnection, especially in surrounding areas. First, open and accessible information facilitates cross-regional learning and exchange. The financial field has promoted technological progress through institutional innovation and technological innovation. In particular, with the strengthening of online consumption skills and payment infrastructure in various places, e-commerce habits such as e-commerce are extending to neighboring areas [29, 30]. Secondly, with the improvement of the level of financial development, banks and other financial institutions have expanded credit business across regions and industries, promoting an increase in social activities and consumption, and lending activities can stimulate an increase in the level of excessive consumption in nearby or other areas [31]. In addition, from the perspective of corporate financing, as the level of financial development increases, companies have wider choices when seeking investment, with initial public offerings (IPOs) and bond issuance being the most common methods [32]. Increased business investment opportunities increase demand for capital accumulation and industrial expansion. This growth manifests in the specified region and adjacent areas, where industries with higher levels of capital accumulation yield greater output. In previous research, Zhou et al. [33] empirically examined the relationship between energy consumption and financial development by using data from 30 provinces in China from 2007-2017, which showed that financial development has a significant spillover effect on energy consumption. This enhances the financial sector’s influence on energy consumption, thereby promoting low-carbon growth in China’s economy, which may affect carbon emissions in the region. As a result, the paper’s second hypothesis can be derived:
H2: There are significant spatial spillovers in the impact of financial development on carbon emissions.
Regional differences in development policies, resource endowments, technological levels, and population structures affect the carbon emissions benefits of financial development [34]. Firstly, Lee et al. [35] used the DID model to examine how the 2007 Green Credit Policy affected enterprises’ carbon emission intensity. They found that state-owned heavy-polluting enterprises, capital-intensive enterprises, financial heavy-polluting enterprises, and provinces with higher financial development and marketization suffered more from the policy. China’s rapid and stable economic growth has advanced financial development. To support the financial industry and real economic growth, China has implemented incentive and credit constraint policies for small and micro-enterprises [36]. Due to policy scope and implementation, the breadth and depth of financial development promote carbon emission efficiency differently across regions [37]. Secondly, each city and region has its own financial infrastructure, production materials, ecological environment, and natural resources, which affect carbon emissions and financial development in social and production activities [38]. Digitalization has made financial development easier, which is essential for pragmatic and rapid modern finance [39]. Different levels of technological progress affect the spatial integration of finance and technology, which affects how financial development affects carbon emissions in different regions [40]. Thirdly, human societal activities directly increase carbon emissions in an area due to demographic statistics. Because of differences in concentration and financial infrastructure, economic growth, transportation convenience, living conditions, and other factors affect urban attractiveness, which affects financial development [41, 42]. In conclusion, it is feasible to deduce hypothesis 3 as presented in this scholarly article.
H3: There is regional heterogeneity in the impact of financial development on carbon emissions.
As shown above, the rapid development of digital technology and its increasing use in the financial industry and the rise of online consumption and payment methods greatly simplify people’s daily lives, boost consumption, and improve social activities and interactions, reducing carbon emissions [43]. Higher economic growth is associated with more significant population agglomeration, greater demand for social activities and consumption in regions with a significant population base, and a greater need to travel, increasing carbon emissions [44, 45]. In conclusion, economic expansion may raise a city’s carbon emissions. China’s FDI (Foreign Direct Investment) and export potential increase with financial infrastructure. FDI can boost the economy by bringing in skilled individuals and cutting-edge technology, making it more challenging for indigenous enterprises to compete. Local firms need excellent scientific and technological innovation capabilities and processes to grow and succeed. Invention and innovation in the sciences can improve the quality of producers and means of production, resource efficiency, labor productivity, and carbon emission reduction efforts [46]. At the same time, advancements in science and technology facilitate adjusting the industrial structure, which will indirectly reduce carbon emissions. Furthermore, a higher level of financial development can integrate and rationally exploit some unsystematic resource endowments, play to the full potential of resource allocation, boost the growth of green finance, and ultimately lead to lower carbon emissions [30]. In conclusion, there may be both enabling and damping effects, depending on the level of financial development. Feng et al. [19] argue that bridging the digital divide improves environmental constraints and government digital governance capacity, which in turn mitigates the ecological impact effect of digital finance, i.e., the threshold effect of the impact of digital finance on the ecosystem. As a result, the paper’s fourth hypothesis can be derived:
H4: There is a threshold effect of financial development on carbon emissions, with R&D intensity and level of technological development as threshold variables.
Experimental Procedures
Variable Selection and Measurement
Dependent Variable Carbon Emissions
Since carbon emissions are a worldwide issue in ecological and environmental governance, understanding their causes and effects is of great theoretical and practical importance for China at its current stage of carbon emission governance and in reaching its carbon peak and carbon-neutral goals. Therefore, this work uses carbon emission as the explanatory variable, and the quantity of carbon emission is quantified by calculating the carbon emission divided by gross domestic product (GDP) using the formula: carbon emission divided by GDP = carbon emission/GDP [47].
Independent Variable Financial Development
The independent variable, financial development, is chosen considering the study’s stated goals and assumptions. Traditional academic assessments of financial advancement have focused on three dimensions: broad financial development, financial development structure, and financial development efficiency [48, 49]. This paper uses this information as a foundation for choosing which of the ten indicators for financial development to use in constructing an indicator system and then detailing the details of that system’s construction and its indicators’ calculations (as shown in Table 1).
Threshold Variables
This research uses the threshold effect model to examine the potential for a non-linear link between financial development and carbon emissions. Investigations of the threshold effect between the two have shown that [50]. Investment in the technology market is expected to rise with rising incomes, creating a solid foundation for technological advancement in the business world and fueling a never-ending improvement cycle. Market rivalry is rising, and businesses that wish to stay afloat need to increase their innovation capacity and R&D (Research and Development) intensity while also making steady technological advances. As a result, this paper employs the ratio of technology market turnover to GDP and the ratio of internal expenditure of R&D funds to GDP as the threshold variables, respectively, to determine the level of development of the technology market and the level of R&D intensity [51].
Table 1.
Financial development indicator system.
Control Variables
Beginning with the current situation regarding the effect of financial development on carbon emissions, this study reveals that many other factors, in addition to the influence of financial development, will alter the impact of carbon emissions. As a result, this paper chooses the levels of economic development, industrialization, human capital, and science and technology as the model’s control variables, with economic development measured by the price deflator of the per capita GDP index [52], industrialization measured by the ratio of industrial added value to regional GDP, and human capital measured by the ratio of human capital to the regional GDP [53]. The proportion of science and technology expenditures to GDP and the percentage of the population enrolled in postsecondary institutions are indicators of a country’s degree of human capital and scientific and technological development, respectively [51, 54].
This study selects annual data from 30 provinces in China from 2012 to 2021. Tibet, as well as the regions of Hong Kong, Macau, and Taiwan, have been excluded from the sample due to significant data gaps. The sources of the data are the “China Statistical Yearbook,” “China Financial Yearbook,” “China Energy Statistical Yearbook,” “China Science and Technology Statistical Yearbook,” and the “IPCC Guidelines for National Greenhouse Gas Inventories.”
Research Methodology
Spatial Measurement Models
Local variables and the production and living conditions of neighboring regions may influence the level of carbon emissions. This influence effect may be more blatant in the information age. Hence, analyzing the direct effect of financial development and carbon emissions and the possibility of a spatial spillover effect between the variables is essential. Therefore, the geographical Durbin model is used to determine if there is a spillover effect in this section:
In the above equation, Ceit represents the level of carbon emissions, Findit stands for financial development, Xit is the control variable, W is the spatial weight matrix, W×Ceit represents the spatial lag variable for carbon emissions, W×Findit represents the spatially lagged variable of financial development, W×Xit stands for control variable spatial lagged variable, εit stands for the spatial lag error term.
Threshold Regression Model
The linear relationship between the effects must be analyzed. However, it must also be thoroughly studied to determine whether a linear relationship is displayed in the effects of the dependent and independent variables. In regression analysis, a threshold effect model helps figure out if a cutoff value exists; if so, the relationship between the independent and dependent variables can be expressed as a segmented function. Therefore, by looking for relevant literature, this article analyzes the impact of financial development on carbon emissions at varying stages of technical market growth and R&D intensity. This study utilizes two threshold variables, respectively, the sophistication of the technological market and the intensity of research and development, to investigate the non-linear relationship between financial development and carbon emissions.
The following formula is used when using the level of technology market development as the threshold variable for this study:
The following formula is used when using R&D intensity as the threshold variable for this study:
In Equations (2) and (3), I denotes the indicative function; The subscripts i and t represent regions and years, respectively; Ceit represents the level of carbon emissions in area i in year t; Fdit represents the level of financial development of area i in year t. Temdlit denotes the level of technology market development in region i in year t, Rdiit denotes the R&D intensity of region i in year t; γ1 represents the threshold estimate; Xit denotes the control variable of the paper, including four kinds of economic development level, industrialization level, human capital level, and science and technology; εit denotes the random interference term.
Results and Discussion
Spatial Autocorrelation Test
Global Moran’s I
Financial development and carbon emissions were first tested for autocorrelation using the global Moran index [29]. Table 2 displays the outcomes of a spatial autocorrelation test applied to the worldwide Moran index. The data in the table shows that economic growth and carbon emissions exhibit substantial regional autocorrelation. There is a strong positive spatial association between financial development and carbon emissions, as indicated by the fact that the global Moran index I for both lies within the interval [0, 1]. Carbon emissions have a rising Moran index I value over time, suggesting an improvement in their spatial autocorrelation, while financial development’s Moran index I value shows no discernible trend over time but consistently higher spatial autocorrelation.
Table 2.
Spatial autocorrelation test.
Partial Moran’s I
This analysis shows that the explanatory variables chosen for this paper have a positive spatial correlation, so we map China’s 30 provinces and cities’ financial development indexes over four time periods (2012, 2015, 2018, and 2021), as shown in Fig. 1. In Fig. 1, regions categorized as high-high indicate areas with a high index of financial development, which is also mirrored by the surrounding areas, thus exhibiting a clustering of high values in spatial terms. Conversely, low-low value areas demonstrate a spatial clustering of low values. High-low value areas represent regions where the financial development index is high, but neighboring provinces exhibit a low index, presenting as high-value islands. Similarly, low-high areas are characterized as low-value islands.
A time series analysis shows that six Chinese provinces and cities will have high agglomeration economic growth in 2021, up from three in 2012. In 2012, 2015, 2018, and 2021, Tianjin, Zhejiang Province, and Shanghai Municipality had high agglomeration, indicating developed economies. At each of the time points observed, these regions consistently appear as clusters of financial development. In contrast, the inland provinces, particularly those in the western and some central regions, display low values of spatial clustering. China has fewer provinces and cities with low economic agglomeration, from 19 in 2014 to 17 in 2021. Although there are fewer low-low agglomeration provinces and cities, their footprints are larger and have moved northwest. A region with low economic development compared to its neighbors is low-high agglomerated, while one with high economic development is high-low. Overall, high- and low-agglomeration zones will decrease between 2012 and 2021. These trends suggest China’s urban-rural economic development gaps are closing.
China’s northeast, southwest, and northwest have the fewest provinces and cities per unit area, while the eastern coastal region and Bohai Rim have the most. Due to its status as a central international trade hub and the rapid economic growth along the eastern seaboard and Bohai Rim, provinces and cities in the agglomeration can easily achieve high financial development. This loss of intellectual capital has slowed scientific and technological progress and slowed Northwest and Northeast economic growth in recent years. The characteristics of low-high concentration and high-low concentration regions shift from the northwest to the south, suggesting that some areas of China still have significant spatial differences and regional heterogeneity in financial development and that global carbon emissions management policies should be implemented.
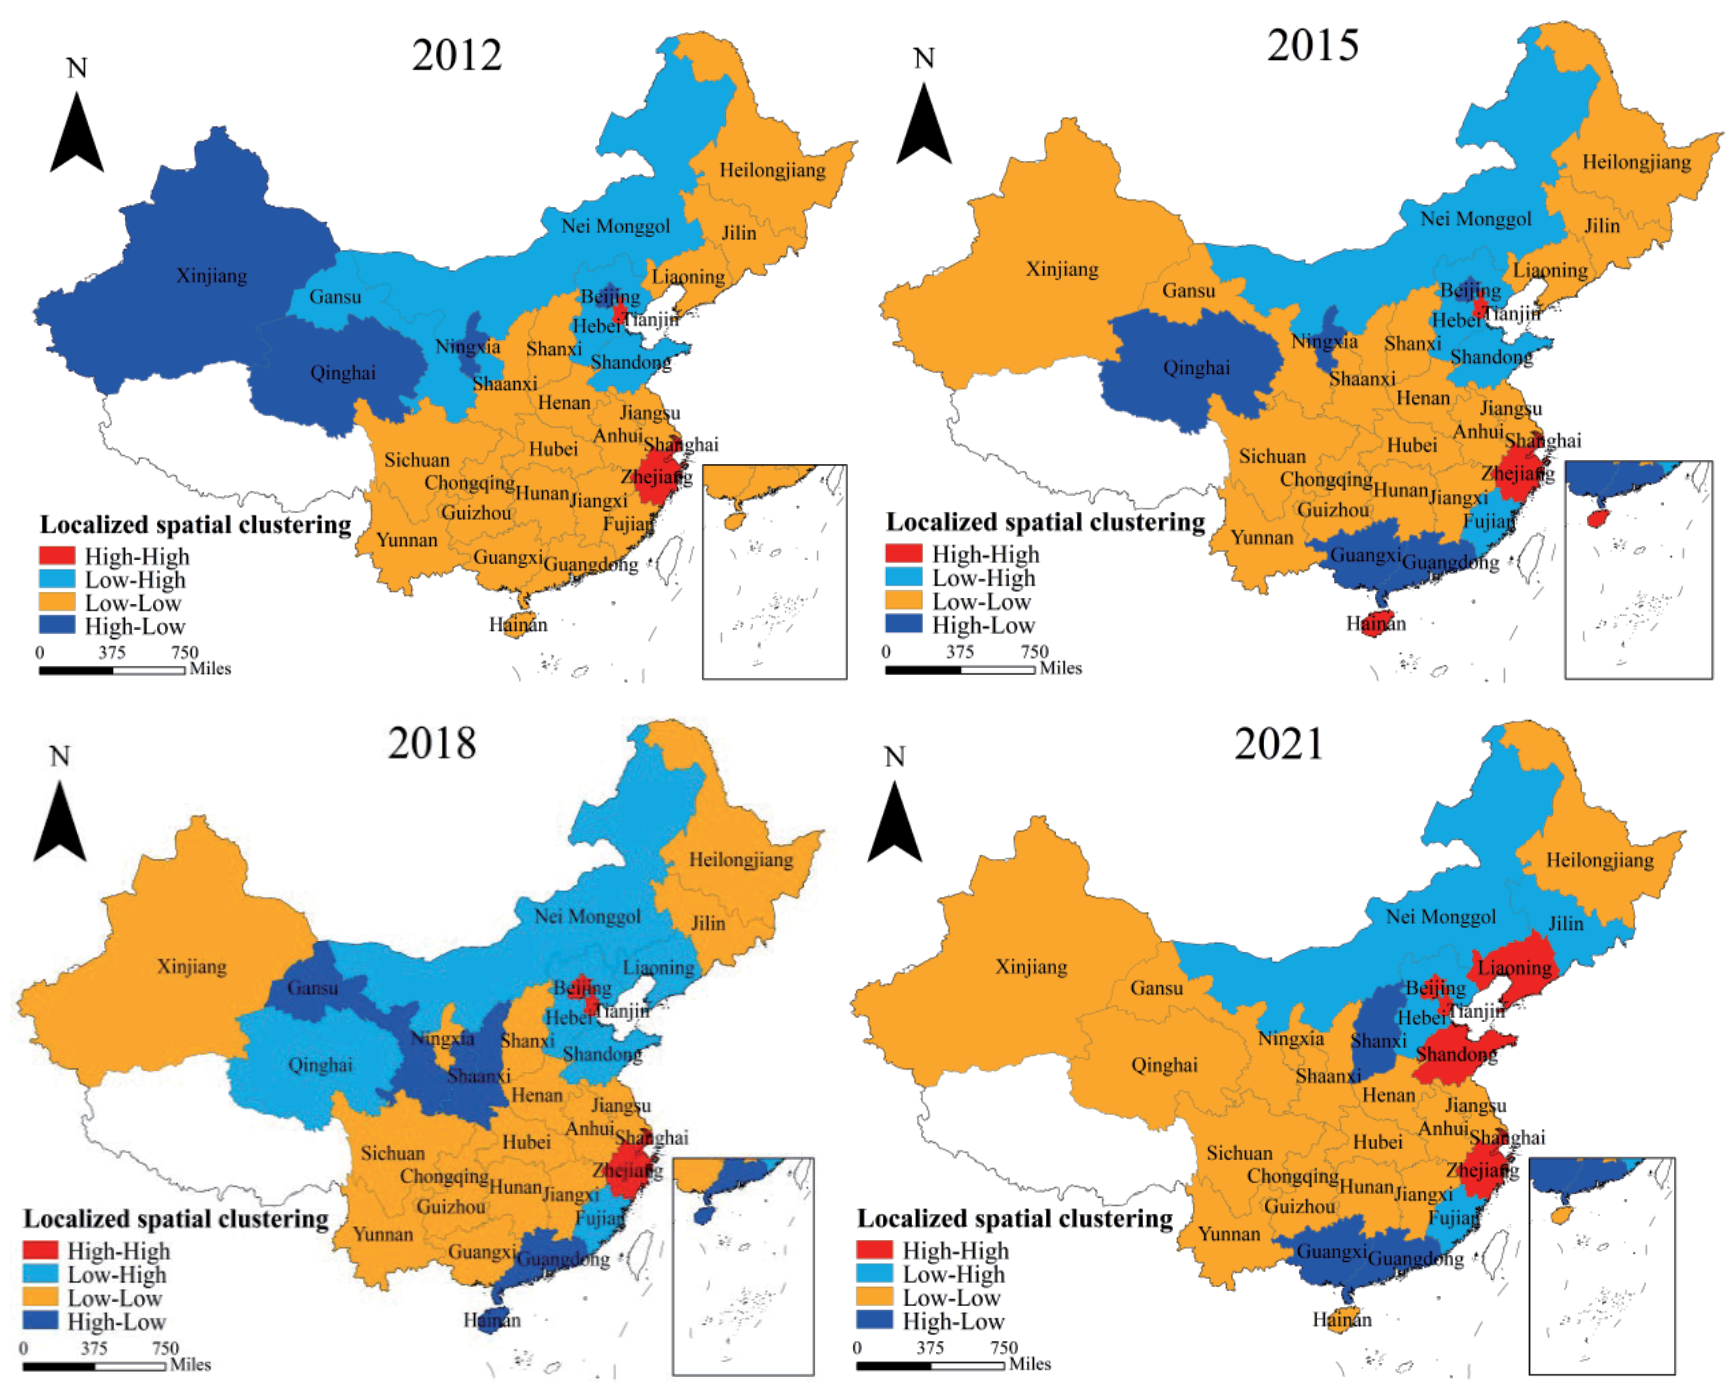
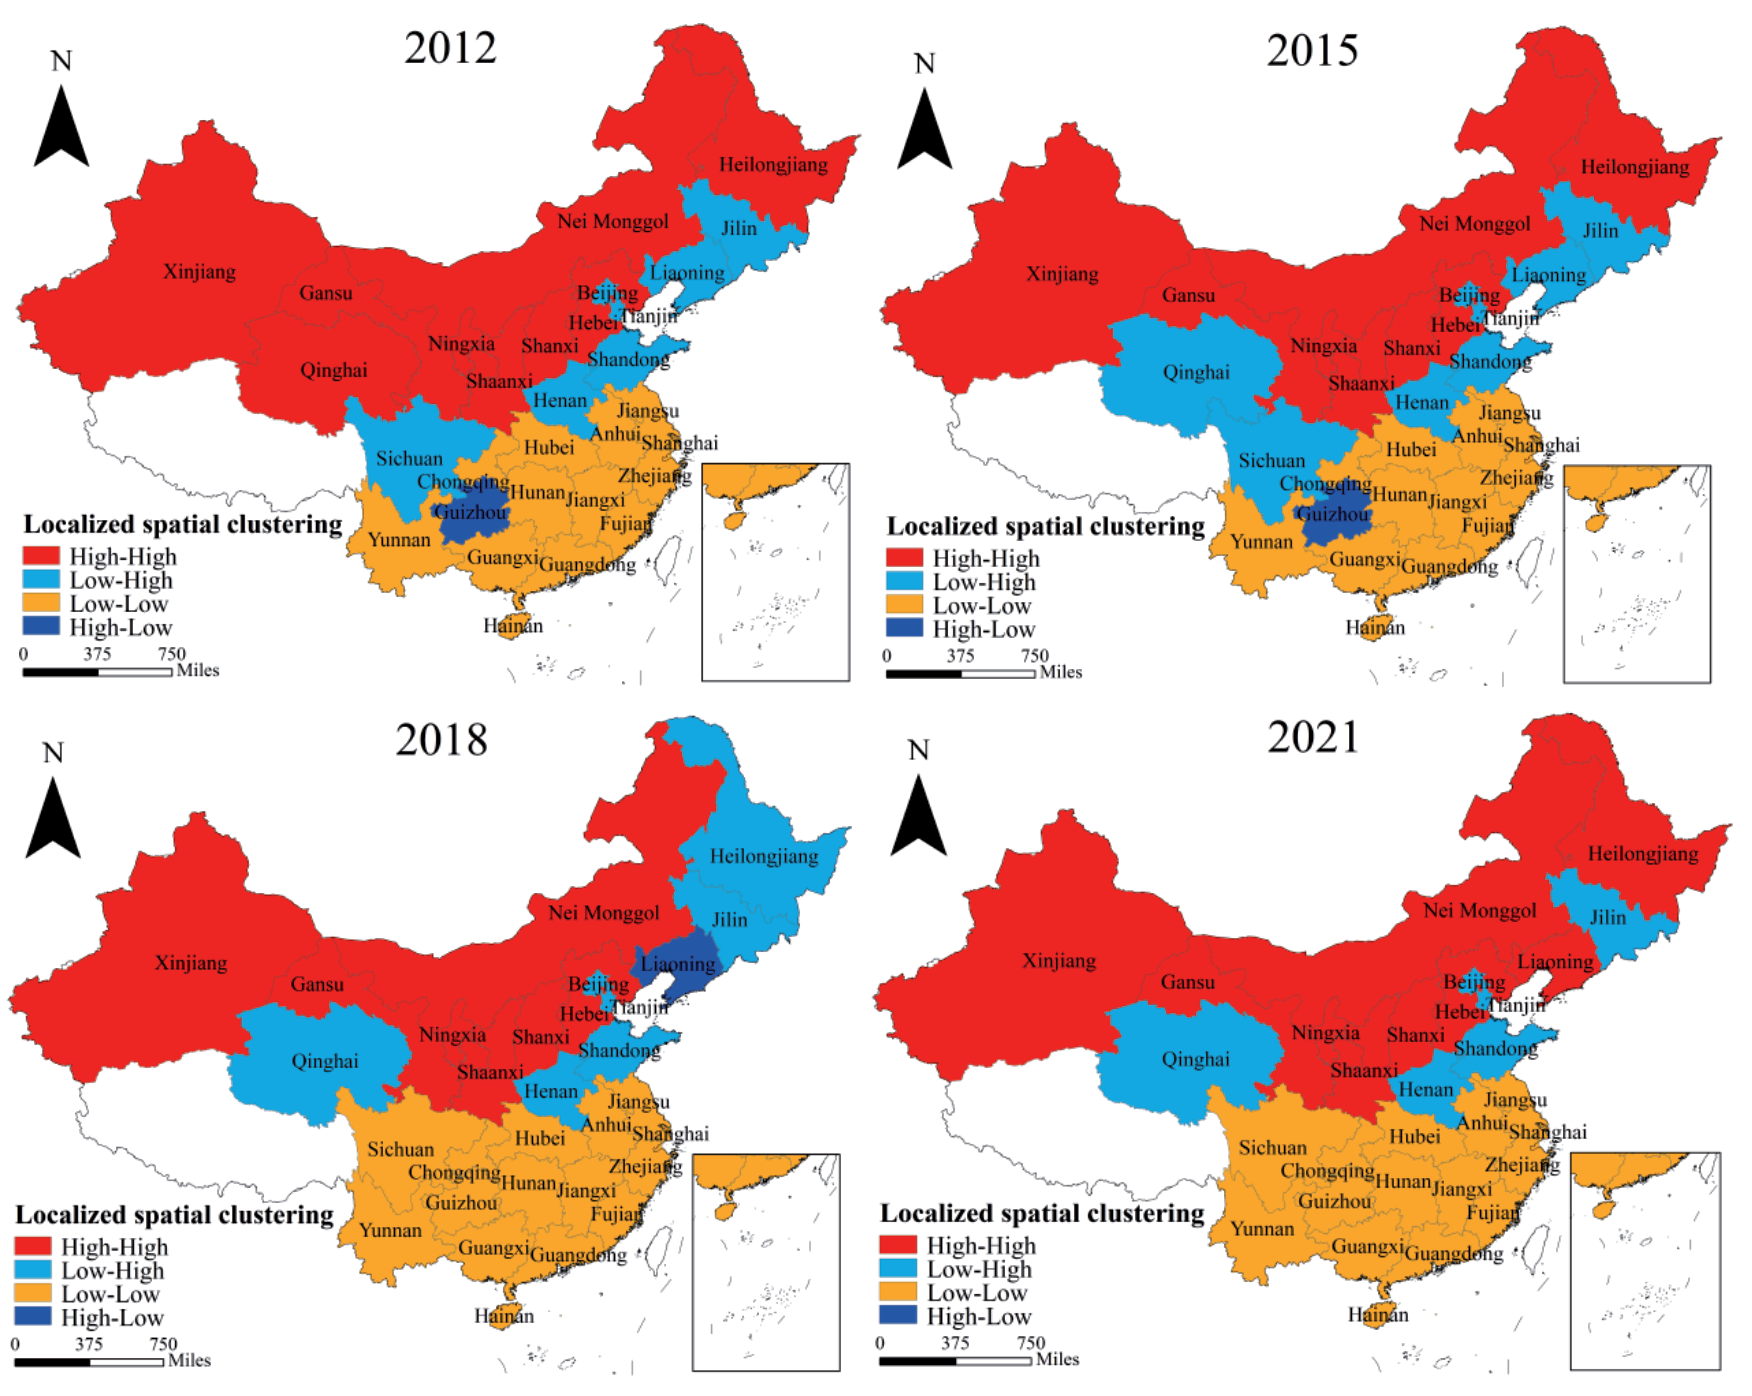
Fig. 2 shows a scatter plot of 30 Chinese provinces and cities’ 2012, 2015, 2018, and 2021 carbon emission indices.
Qinghai changed from a high-high agglomeration state in 2012 to a low-high one in 2021, while Liaoning changed from low-high to high-high. Historically, low-low agglomeration has increased, as in Sichuan Province, Chongqing Municipality, and Guizhou Municipality. Over time, high-low and low-high agglomeration areas decline. This shows that China’s carbon emissions are still unfavorable, that progress toward carbon peak and carbon neutrality is slow, that regional carbon emission variations are decreasing, and that spillover effects are evident.
Spatial change shows that China’s northwestern and northeastern regions pollute the most. Most of these high carbon emitting regions are concentrated in industrialized provinces with high energy production and consumption, such as Hebei and Shanxi in the north, as well as Inner Mongolia and Xinjiang in the center-west. This is because these regions are the most industrialized provinces in China with high energy production and consumption, furthermore, these places lack effective carbon emission regulation and high social production digitization. Low-low agglomeration states are mostly in the southern and eastern coastal regions, giving them an advantage for foreign investment and trade. The economic structure of these provinces is dominated by services or agriculture. The region’s digital technological innovation increases production efficiency and reduces carbon emissions by digitizing the manufacturing process. The regions above have different carbon emission levels due to their locations and the Beijing-Tianjin-Hebei Metropolitan Area (BTHMA), the world’s most densely populated metropolitan area. Chinese “double carbon” goals depend on solving the region’s carbon emission crisis.
Benchmark Regression Analysis
Spatial Econometric Modeling Tests
The above study suggests a regional autocorrelation between China’s economic level and carbon emissions. This section primarily uses the correlation test to determine the spatial econometric model that should be selected for this study; the specific test methods and results are shown in Table 3. Spatial econometric models are needed to specifically analyze the role of the level of financial development on carbon emissions.
A spatially fixed, chronologically fixed, or two-way fixed model can be chosen with the LR test; a linear mixed model (LM) model can be chosen with the LM test; and a random effects or fixed effects model can be chosen with the Hausmann test. Table data shows that the geographical effect of financial development on carbon emissions is statistically significant at the 10% level (P = 0.099). The Lagrange Multiplier lag test (LM-lag) is used to detect spatial autocorrelation within a spatial lag model, akin to the LM-error test which is for spatial error models. A statistic value of 17.860 with a p-value of 0.000 indicates the presence of significant spatial lag within the model. The Robust LM-lag statistic, at 2.739 with a p-value of 0.098, suggests spatial lag effects are present at the 10% significance level. The Likelihood Ratio test for SDM against SAR (LR SDM-SAR) compares the Spatial Durbin Model (SDM) with the Spatial Autoregressive Model (SAR). With a statistic of 13.07 and a p-value of 0.070, this indicates that the SDM is more appropriate than the SAR model at the 10% significance level. The LR test for SDM against SEM (LR SDM-SEM) compares the SDM with the Spatial Error Model (SEM). The statistic of 12.26 and a p-value of 0.092 imply that the SDM is preferred over the SEM model at the 10% significance level. These results collectively suggest that the Spatial Durbin Model (SDM) is more suitable for capturing both the spatial lag and error terms compared to the alternative models, which are essential for accurately estimating the effects of financial development on carbon emissions considering the spatial dependencies. Given that the spatial econometric model used in this study has both a lag term and a spatial correlation term, this paper uses the spatial Durbin model to explore the geographical influence of financial development on carbon emissions.
With a p-value of 0.036 (5% significance level), the Hausman test indicates that the fixed effects model should be used. If the spatial Durbin model degenerates into a spatial error or spatial lag model, the LR test must be run on the finalized model to determine this. These tests are statistically significant at the 10% level, as their respective P-values are 0.070 and 0.092. To analyze how economic expansion affects carbon emissions in various regions, the spatial Durbin model is used under the fixed effect condition.
Benchmark Regression Results
Table 4 presents the baseline regression outcomes of the Spatial Durbin Model (SDM) regarding the impact of financial development on carbon emissions. The interpretation of these results can be approached from two angles: the main effect and the spatial spillover effect. With a regression result of 0.190 at the 1% significance level, the main effect of financial development on carbon emissions shows that financial development increases carbon emissions by 0.19% per unit. Significant at the 10% level, the -0.202 spatial spillover effect of financial development on carbon emissions regression results show that financial development will increase carbon emissions in neighboring areas, causing a more pronounced adverse effect and that every unit of increase will increase carbon emissions. Increasing financial development in the region promotes financial agglomeration, which increases pollution in neighboring regions.
Regression analysis shows that economic development, industrialization, and human capital all positively affect carbon emissions, except for the level of human capital and the spatial spillover effect of the level of industrialization, both of which failed the test of significance. The other elements are all important as well, but to varying degrees; this indicates that they all contribute to the carbon emissions of the local and neighboring regions, albeit in different ways. For the following reasons, the variables mentioned above might influence regional carbon emissions: The rise in carbon emissions is a direct result of the intertwined processes of economic growth and industrial activity, with rapidly developing regions often setting the pace and serving as a sort of “demonstration effect” for their less developed neighbors. The negative and statistically significant main impact regression results for R&D intensity, science and technology, and the amount of technical progress on carbon emissions all indicate that all three factors hinder carbon emissions to differing degrees. Additionally, the regression results for the spatial spillover impact on the development of the technological market and the intensity of R&D are negative.
Table 3.
Results of spatial econometric modelling tests.
| Model testing | Statistic | P value |
|---|---|---|
| LM-error | 17.828 | 0.000 |
| Robust LM-error | 2.708 | 0.099 |
| LM-lag | 17.860 | 0.000 |
| Robust LM-lag | 2.739 | 0.098 |
| LR SDM-SAR | 13.07 | 0.070 |
| LR SDM-SEM | 12.26 | 0.092 |
| Hausman | 13.53 | 0.036 |
Table 4.
Benchmark regression results for SDM model.
In contrast, the regression results for spatial spillover efficacy are uniformly positive. Different weights depend on the context. The development of science and technology will likely result in the emergence of technological monopolies, the flow of human capital to the region, and a high level of technological development. The effect will be a rise in local carbon emissions.
Spatial Spillover Effects
To further investigate the spatial effects of financial development and carbon emissions, this study selects the partial differential decomposition method to decompose the spatial spillover effect into direct and indirect effects for regression analyses again, and the regression results are shown in Table 5.
The result shows that financial development directly affects carbon emissions with a regression coefficient of 0.191, which is significant at the 1% level of analysis – every unit of economic progress increases carbon emissions by 0.191%. Increased local environmental damage from carbon emissions should reduce carbon emissions by 0.224 per unit increase in financial development. The effect of economic growth on carbon emissions was indirect, as regression results were null. The regression results, which are statistically significant at the 5% level, indicate that economic development has a negative impact on regional carbon emissions.
Table 5.
SDM model effect decomposition results.
Only the economic development level is significant at 10%, and the rest fail the significance test, but the indirect effects are positive. The direct effects of economic development, industrialization, and human capital on carbon emissions are all positive, with economic development and industrialization being significant at 1% and human capital failing the significance test. The decomposition results of the variables above have a positive effect on carbon emissions, except for industrialization, which fails the significance test. Economic development and human capital are significant under different conditions. The following research shows that boosting economic development, industrialization, and human capital levels in a region has varied positive effects on the region, its neighbors, and its total carbon emissions. Increases in the variables above will significantly reduce local and regional carbon emissions. Irrespective of the direct, indirect, or cumulative impacts of the growth of technology markets and R&D on carbon emissions, this statement remains accurate. Science and technology directly affect carbon emissions by -1.94 at 10% significance.
Conversely, indirect and overall effects are positive. Local businesses will reduce their carbon footprint by improving their energy efficiency as they learn more about scientific and technological advances, which are the best indicators of productive force growth. Innovative companies often prevent competitors from using cutting-edge technologies, creating a technical monopoly that drains nearby manufacturing and human capital. This reduces the region’s carbon footprint and population growth.
Table 6.
Robustness test results.
Table 7.
Results of heterogeneity test.
Robustness Check
Assuring the validity of the study findings and increasing their impact can be achieved through the robustness test. Here, we perform the robustness test in three ways: by swapping out the spatial adjacency matrix, the second-order inverse distance matrix, and the spatial lag term and tabulating the results in Table 6.
Incorporating the three-robustness mentioned (Table 6), the results show that the test coefficients of financial development on carbon emissions are all positive and significant at the 1% level; that is, the effect of financial development on carbon emissions persists even after the spatial matrix is switched. Economic development, industrialization, and human capital levels all had positive and statistically significant regression results on carbon emissions after the spatial matrix was replaced and a lag term was added. Less specific is the relationship between carbon emissions and the three factors of technological market maturity, scientific maturity, and academic research maturity. The fact that the regression findings are still negative after replacing the geographical matrix and adding the lag term and that the total results are significant at the 1% level demonstrates that the growth of the components, as mentioned above, has a significant inhibiting effect on carbon emissions. Table 4 displays the results of the tests and comparisons with the benchmark regression analysis, demonstrating that the study’s conclusions are compatible with those of the benchmark regression analysis.
Heterogeneity Analysis
There may be some regional variation in the effects of economic growth on carbon emissions due to differences in development policies, resource endowment, scientific and technological level, and demographic structure. This paper divides China into five regions (east, central, west, south, and north) to examine the varying effects of economic growth on carbon emissions across the country (hence, hypothesis 3), with the results tabulated in Table 7.
The experimental findings show that in the eastern and southern regions, financial development has a greater positive effect on carbon emissions than in the other four. Due to their high financial growth, eastern and southern regions may benefit more from encouraging carbon emissions. East, Central, and Southern economic development test coefficients are all negative and statistically significant, indicating that higher economic development reduces carbon emissions. This is likely because as the region’s standard of living rises, its residents are becoming more spiritual than material, and its industrial structure is shifting toward the knowledge economy. Industrial and manufacturing growth in the north and west disproportionately affects carbon emissions. This is because these areas are developed. Industrialization in the south affects carbon emissions less than in the east and north. Industrial energy consumption may be more efficient in the South due to the widespread adoption of digital information technology. Industrialization increases carbon emissions. Industrial informatization in the central and western regions needs improvement, and digital technology use needs to be higher. Human capital impacts carbon emissions more in the east than in the west due to the rapid economic development of eastern coastal towns.
Both regions have high consumption and travel needs. Carbon emissions rise with human capital due to higher consumption and mobility. Technology market growth encourages or discourages carbon emissions in different regions. As the economy grows, companies may share their manufacturing and management expertise, allowing underdeveloped regions to benefit from cutting-edge carbon-reduction techniques. Technology and science reduce carbon emissions less in the north than elsewhere. In the West and South, increased R&D activity has a negligible positive effect on carbon emissions. Carbon emission reduction may have needed to be more effective due to rising northern and southern costs of living or the effect of R&D intensity on the west and south.
Threshold Effect Analysis
Threshold Estimates
This section analyzes the causal relationship between financial development and carbon emissions, with the technological market’s development level and the intensity of R&D serving as the threshold factors. This influence effect can be broken down into phases using the threshold variable, which allows for a more nuanced expression of the influence law between the variables. Table 8 displays the test results to determine whether a threshold effect exists, using regressed measures of R&D intensity and the maturity of the technological market as the threshold factors.
Given that the table indicates that the P-value for the regression of R&D intensity as a threshold variable will be significant at a single threshold and that the P-value for the regression of the level of technological market development as a threshold variable will be significant at a double threshold, the present study employs the former and the latter.
Threshold Effects Analysis
Table 9 shows simple regression results for R&D activity. Tables 8 and 9 show that the test coefficient for R&D intensity as a threshold variable is 0.083, which is significant at 10%. We split the impact of economic development on carbon emissions into two periods with a cutoff of 0.083. The regression coefficient of financial development on carbon emissions is 0.679 at 1% significance, suggesting that increasing financial development at this stage can significantly increase regional carbon emissions. Economic growth and carbon emissions correlate greater than 0.083, but the regression coefficient is 0.064, indicating no statistical significance. The initial positive effect of economic growth on regional carbon emissions fades after a certain level of development. Increased research and development benefits human consumption and production.
Table 8.
Threshold effect self-sampling test results.
Table 9.
Panel threshold model estimation results (R&D intensity).
Table 10.
Panel threshold model estimation results (level of technology market development).
In contrast, the early stages of financial development may enrich human consumption forms, stimulate the enhancement of the level and expansion of the scope of consumption, and play a significant role in promoting carbon emissions. Increased investment in R&D will pay off with technologies that facilitate the digitalization of finance once the economy achieves a certain degree of development, mitigating the effect of economic expansion on carbon emissions from rising human consumption. As seen in Table 10, the findings of a double-threshold regression analysis done on the level of technological market development reveal a three-stage promotion of the influence of financial development on carbon emissions. In the early stages of development, the degree of application needs to be deeper because different enterprises need to fully understand the technology level of other industries. This means that financial development is still in the stage of a less obvious promotion of carbon neutrality. As long as people continue to employ production equipment in industries and factories, they will continue contributing to global warming by releasing carbon dioxide and other pollutants into the air. The demand for production and life, and the connection between economic expansion and carbon emissions, are increasing as this technology spreads.
Conclusions
Studying the effect of financial development on carbon emissions is crucial for both the nation and individuals to meet carbon reduction targets in today’s rapidly changing society characterized by advanced technology and digital information. Studying the relationship between financial development and carbon emissions is a crucial basis for future research in the field and holds significant practical importance for individuals and organizations striving to achieve carbon emission reduction goals. This study employs the geographic Durbin and threshold effect models to examine how financial development affects carbon emissions in 30 provinces and cities in China from 2012 to 2021.
(1) The Moran index tests show a geographical relationship between China’s economic growth and carbon dioxide emissions; this relationship is most substantial in the Bohai Rim and the eastern coastal regions, and the regional heterogeneity of these two regions’ economic growth is also relatively straightforward. In contrast, the central and western regions’ economic growth is less clear. Like the United States, China’s high-level carbon emission regions are concentrated in the northwest and most of the northeast, while the low-level regions are concentrated in the south. Neither the high-level nor the low-level regions show regional heterogeneity, exhibiting either high-high or low-low agglomeration.
(2) The spatial spillover effects regression analysis shows that a rise in financial development has a positive impact on carbon emissions in the immediate area, a negative impact on emissions in neighboring regions, and a negative impact on emissions across the region. This is true regardless of the level of economic development or industrialization. The level of economic development, industrialization, and human capital all have a positive effect on regional carbon emissions. In contrast, the level of the technical market, science and technology, and R&D intensity all have a negative effect.
(3) The heterogeneity test shows that the promotion effect of increasing financial development on carbon emissions varies across regions. In contrast, the promotion effect of other variables on carbon emissions is significantly higher in the north-west region.
(4) Regression results of the threshold effect show that early-stage financial development may positively affect regional carbon emissions when R&D intensity is used as the threshold variable, but that this promotion effect on carbon emissions gradually becomes less evident as financial development continues. There have been three phases to the influence of financial development on carbon emissions when the amount of technological market development is utilized as the threshold variable: no effect, a significant promotion, and no effect.
Recommendations
(1) Considering the high level of financial development, the low level of carbon emissions, and the significant regional heterogeneity in the Bohai Rim and Eastern Coastal regions, policymakers should encourage financial institutions within these regions to invest in green finance projects and environmentally friendly enterprises to promote regional low-carbon economic development. Additionally, financial innovation, such as green bonds and funds, is essential to financing environmental projects and reducing high-carbon industry financing. Second, to attract financial resources to the financially underdeveloped Central and Western regions, governments should provide policy support. To offer more financing options to businesses and green industries, the financial sector would need to be more inclusive. Thirdly, because the Northwest and Northeast have higher carbon emissions, policymakers should encourage the upgrade of traditional industries, the development and use of new energy sources, and the shift toward high-tech industries.
(2) In light of the spatial spillover effects of financial development on carbon emissions, it is imperative to reinforce inter-regional financial cooperation to maintain the dual objectives of financial development and carbon emission reduction. Moreover, increasing investment in education and scientific research is essential to elevating the level of human capital and the capacity for technological innovation, thus facilitating the transformation of production methods and enhancing energy use efficiency. Concurrently, other cities with low financial development and high carbon emissions will be encouraged to reform and develop through the spillover effect of technology and human capital, speeding up the implementation of their carbon emission reduction strategies and the process of industrialization.
(3) Financial policies must be tightly interwoven with environmental policies, undergoing dynamic adjustments in line with the maturity of financial markets and the evolution of technology markets. Particularly in the early stages of financial development, it is vital to enforce environmental regulations and standards to restrict the flow of financial capital towards high-carbon emission industries. As financial development progresses, there should be a gradual increase in support for low-carbon technologies and industries, steering the economy towards a low-carbon transformation.

