

Introduction
In recent decades, amid rapid economic growth, global environmental deterioration, and climate warming, there has been a worldwide focus on controlling greenhouse gas emissions [1]. A crucial metric for assessing a region’s overall strength is the logistics industry (LN), which is a fundamental, strategic, and leading sector that supports the growth of the national economy [2]. However, although LN encourages economic growth, its energy use, environmental pollution, and social impacts are also increasing annually [3]. China, with the second-largest economy globally, has placed a high value on LN in recent times. Its GDP has tripled in the past decade, while the carbon emissions from the petrochemical energy consumed by LN have become increasingly serious [3].
To achieve global sustainable development (SP), it is critical to understand how to enhance the carbon emission efficiency of the logistics industry (LCEY) from the standpoints of environmental protection, social advancement, and economic development. Currently, the following research issues require immediate attention: (1) how to thoroughly measure and assess LCEY in light of SP; (2) how to analyze the complex relationship structure of LCEY and comprehensively investigate its spatial network characteristics; and (3) how to propose targeted suggestions for the government and employees. China’s LN must consider economic development, environmental protection, and social impact and minimize the emission of environmental pollutants while promoting economic development, that is, achieving higher carbon emission efficiency.
Numerous scholars believe that, with rapid economic development, enhancing carbon emission efficiency (CEY) will advance the development of a low-carbon economy. In this study, we combined the literature into the following three aspects:
The first is the measurement and evaluation of the LCEY. The input and output perspectives are primarily used to construct an evaluation index system (EIS). Input indicators include human, financial, and material factors, while output indicators include economic output and carbon emissions [4]. The methods used to measure the CEY mainly include the life cycle method, energy analysis [5], stochastic frontier method, and data envelopment analysis [6]. Among them, for its advantages, data envelopment analysis (DEA) is widely used by scholars [7]. However, the traditional DEA models (CCR and BBC models) are radial models, have a certain bias in dealing with non-desired outputs, and are prone to inaccurate evaluation results in the actual measurement [8]; therefore, a more scientific model must be used to measure LCEY.
The second is the evolution mechanism of the LCEY. Based on measurements, scholars have mostly evaluated the LCEY in terms of time and space dimensions.
In the time dimension, DEA, Malmquist index, and kernel density estimation are combined to analyze the law and trend of the evolution of LCEY with time [9, 10], where the spatial autocorrelation model and synthetic control method are often used to analyze the spatial evolution properties of LCEY [11, 12]. However, most studies used “attribute data” to examine the spatial pattern properties of LCEY. Although some studies are based on geographical or economic proximity, analyzing the spatial network relationships of the LCEY among distant municipalities is impossible [13]. Therefore, this study focuses on the comprehensive and objective construction of the EIS of the LCEY and a more scientific method for analyzing its evolution mechanism.
The third consists of countermeasures to improve the LCEY. Specific countermeasures and suggestions include developing economies, optimizing the layout of LN, strengthening the training of logistics talent, improving the level of logistics informatization, strengthening government investment, and optimizing the energy structure [14]. These recommendations and countermeasures are mostly used by linked businesses, sectors, governments, and other domains and have achieved certain results in practice. However, there are few countermeasures and suggestions from the perspective of spatial networks in existing research; consequently, it is necessary to formulate corresponding countermeasures to improve the spatial network characteristics of the LCEY.
Scholars have made considerable progress and valuable achievements in research on LCEY, but the following research gaps remain:
(1) Increasingly close inter-regional logistics activities gradually present complex spatial network characteristics, and it has become a new trend to reexamine logistics activities from the perspective of complex networks. Almost all the studies of LCEY are based on “attribute data” and described by a spatial econometric model. However, “attribute data” cannot accurately reflect the spatial network characteristics of LCEY. The social network analysis (SNA) approach is an effective tool for analyzing the overall state of “relational data.” It has been in use for a long time but has rarely been applied to the study of LCEY.
(2) Most existing studies promote countermeasures and suggestions based on the influencing factors, and the LCEY presents different spatial network characteristics in different periods. Thus, the SP of the regional LD must be advanced, as must the global SP goals.
This study builds the LCEY’s EIS, measures the LCEY using the Super-SBM model, creates a spatial network matrix using the updated gravity model, examines the LCEY’s spatial network properties using the SNA technique. The contributions of this study are as follows:
(1) This study constructs LCEY’s EIS based on the sustainability perspective, establishes the Super-SBM model of LCEY, and achieves scientific assessment and measurement of the efficiency level.
(2) The LCEY study employs the SNA method. A modified gravity model is used to build the spatial network matrix of the LCEY. The “attribute data” of LCEY is converted into “relational data,” and both the overall and individual network characteristics are examined. The study also provides a new perspective on the study of LCEY.
(3) Based on analyzing the spatial network characteristics of LCEY, this study proposes more scientific and targeted countermeasures to improve LCEY. This will guide the government in the effective direction of the development of LN. It will also help the government direct pertinent practitioners.
Material and Methods
Materials
Study Area
Anhui Province is the docking zone for numerous significant domestic economic plates and is the key center of China’s economic development. China’s three major strategies – the integrated development of the Yangtze River Delta, the development of the Yangtze River Economic Belt, and the high-quality development of the central region – are superimposed in this province. By 2021, the total output value of Anhui Province was 4,295.918 billion yuan, of which the output value of LN was 205.695 billion yuan, representing 4.8% of the total output value of Anhui. Anhui Province, a major energy-consuming province in central China, has experienced rapid growth in LN energy consumption in recent years. Anhui’s overall energy consumption climbed from 105.7023 million tons of standard coal in 2011 to 153.4263 million tons in 2021. Currently, the logistics industry in Anhui Province is in the stage of expansion and development; specialization is low, socialization is low, and energy consumption is large, followed by a significant increase in LCEY [13]. In light of this, this study measures the LCEY, examines the spatial network characteristics of the LCEY in 16 Anhui Province cities, and proposes countermeasures and recommendations to enhance the LCEY.
Data and Variables
The EIS of the LCEY is indicated in Table 1, based on available data, scientific and quantitative index construction principles, and information from prior research [14, 15]. The input indicators of this evaluation index system consider human, financial, and material inputs, as well as energy consumption in the logistics industry, including the desired and undesired outputs, which can comprehensively and objectively evaluate LCEY.
The data source and calculation are explained as follows:
As a new industry in China, LN is not included in China’s industrial classification system. Through a study of the relevant literature, since over 85% of the added value of LN is derived from the transportation, warehousing, and postal sectors, it is defined as LN [16]. This study selected 16 cities in Anhui Province as research objects, and the data span was 2012-2021. The primary sources of statistical data were the China Energy Statistical Yearbook, Anhui Statistical Yearbook, and the statistical yearbooks between 2013 and 2022. Because of the lack of LCEY in various cities in Anhui Province, it was estimated by multiplying the total LCEY in Anhui Province by the proportion of the city’s GDP to the GDP of Anhui Province. The value-added of LN, fixed asset investment, and price-related factors were transformed into real values based on 2012 data to remove the impact of price changes.
Methods
Unexpected Super-SBM Model
Tone (2001) proposed the SBM model, which compensates for neglecting slack variables in the efficiency assessment of radial models. In addition, the SBM model is characterized as non-radial, non-angular, and non-dimensional. It can avoid assessment bias caused by differences in the selection of indicator dimensions and angles [8]. Therefore, this study builds on the Super-SBM model by considering unexpected outputs based on non-oriented and continuous returns to scale. This is the formula:
(1)
where θ is the LCEY value. When the efficiency value reaches one, it indicates the efficiency has reached the optimal frontier. Compared to the traditional data envelopment analysis model, the super-efficiency model can distinguish effective decision-making units, and the efficiency value can be greater than one. The efficiency increases with the value of θ; K = 1... n, where n represents the total number of decision units; m, q1, and q2 represent the numbers of input, expected output, and unexpected output elements present in each decision-making unit. xik, yrkg, and yrkb represent the input vector, expected output vector, and unexpected output vector of the decision-making unit; X, Yg, and Yb represent the input, expected output, and unexpected output matrices, respectively; λ is a column vector; s–, sg, and sb are relaxation variables for the input, expected output, and unexpected output, respectively.
Modified Gravitational Model
The spatial network matrix is a prerequisite for SNA, and the gravity model and VAR Granger causality test are commonly used to determine the association matrix. Based on the law of gravity, the gravity model can not only comprehensively consider economic and geographical distance factors but also reveal the evolutionary characteristics of spatial correlations, which have been widely used in sociology, behavioral science, engineering, and other fields [17, 18]. Combined with the data characteristics of this study, this study revises the typical gravity formula, assuming that there are two different places i, j, and the gravity formula of the LCEY between them is as follows:
where, Yij is the correlation intensity of the LCEY between regions i, j, Kij is the gravitational coefficient; Ei, Ej are the values of the LCEY in regions i, j respectively; Dij is the spherical distance between i, j; gi, gj is the GDP per capita; and (gi – gj) are the economic distances between i, j. The correlation strength between i and j is calculated according to Equation (2), the correlation strength between i, j is calculated, and a correlation strength matrix is constructed. The threshold is determined by calculating the mean value of each row of the matrix. Each row’s gravitational value is recorded as 1 if it exceeds this threshold, showing that the LCEY has a correlation between i, j, and vice versa; it is recorded as 0.
SNA
SNA can effectively overcome the limitations of “attribute data” and globally analyze “relational data” [19], based on “relational data,” using mathematical statistics, graph theory, and other techniques to describe the relationship between samples. The overall network properties, individual network characteristics, and geographical clustering structural characteristics of the LCEY were analyzed using the SNA approach. See [19] for specific formulas and methods.
(1) Overall network characteristics
Commonly used indicators to depict overall network structure characteristics include network density, network correlation degree, network grade degree, and network efficiency. This study used these four indicators to depict the overall network structure characteristics of the LCEY.
Assuming that the number of members in the spatial network is N and the number of relations is R, and the theoretical maximum number is N(N – 1), the network density is:
Assuming that the number of unreachable points is U, the network correlation is:
Assuming the number of symmetrically reachable pairs of points is V and the maximum number is Max(V), the network hierarchy degree is:
Assuming Z is the number of redundant lines and Max(Z) is the maximum possible number, the network efficiency is:
(2) Individual network characteristics
Three indicators are frequently employed to characterize the features of each network structure: intermediate, proximity, and point centrality. These three indicators were used to characterize the different aspects of the LCEY network structure. The detailed formula and interpretation of each indicator are as follows [19]:
Degree centrality represents how a node is connected to other nodes in a connected network. The absolute point centrality Cr(oi) of a node oi is:
Betweenness centrality reflects the control effect of one node on other nodes in an associated network. Assuming that there are gjk shortcuts between points j, k and the ability of point i to control the interaction of j, k is j, bjk(i) = gjk(i)/gjk. The absolute betweenness centrality of point i is
Closeness centrality reflects the autonomy and independence of nodes in an associated network. The absolute centrality of a point is:
(3) Structural characteristics of spatial clustering
Block model analysis was first proposed by White in 1976 [20]. It can explore the internal structural state of the network, specifically investigate the ways of sending and receiving information between each plate, and conduct descriptive analysis. The plate division is shown in Table 2, where bs is the number of provinces within a certain plate, and b is the number of all provinces in the entire association network [21, 22].
Table 2.
Spatial Association Network Plate Division Basis.
The first is the role of net benefits. The participants who played this role had more internal than external relationships on the plate. In extreme cases, they only send relationships to internal members and accept spillover relationships from other plate subjects, but do not send spillover relationships to other plate subjects. The second is the net spillover role, in which members who play this role send more relationships to other plate members and receive fewer external relationships. The third factor was the two-way spillover effect. Members who play this role can not only send out more relationships but also produce more relationships within the plate; however, they receive fewer external relationships. The fourth is the broker role: the members who play this role not only send and receive external relations but also have a small proportion of internal relations in the plate and play an “intermediary” role in the spatial spillover effect [23].
Results and Discussion
Results
LCEY Measurement Results
Using MaxDEA9Ultra software, the LCEY was calculated, considering unexpected output (Table 3).
Table 3 shows that the average value of the LCEY in Anhui Province grew from 0.3851 in 2012 to 0.7371 in 2021, exhibiting a fluctuation trend of first lowering and then increasing. The Anhui Province’s LCEY has significantly improved in 2018, which may be connected to the promotion of the transportation ecological civilization’s construction in 2017 and the complete implementation of the logistics industry’s green development in 2018.
At the city level, the LCEY in various cities showed an upward trend to different degrees; however, there were notable variations among the cities. Among them, Hefei, Wuhu, Tongling, Xuancheng, Huangshan, and Huaibei had higher efficiency values, and the efficiency values have almost exceeded 1 in the last three years, which is at the forefront. Fuyang, Bengbu, and Suzhou have low efficiency values, which indicates that these cities still have arduous tasks on the road of logistics transformation and upgrading, and they are areas that Anhui Province should focus on and develop.
Table 3.
Calculation results of LCEY in Anhui Province from 2012 to 2021.
Overall Network Characteristics
Ucinet 6.0 software was used to calculate the overall network structure characteristic indices from 2012 to 2021, namely No. for ties, density, connectedness, hierarchy, and efficiency (Table 4).
Table 4 shows that, (1) from 2012 to 2021, the number of ties showed a fluctuating upward trend, and the total number increased from 58 in 2012 to 69 in 2021. The density value also showed the same pattern, from 0.242 in 2012 to 0.287 in 2021, indicating that the spatial correlation of LCEY in Anhui Province gradually increased. (2) The connectedness is always 1 from 2012 to 2021, which indicates that there is direct or indirect correlation between all cities, there is no “isolated point,” and the network accessibility is good. (3) From 2012 to 2021, the hierarchy revealed a pattern of initially declining and then increasing, from 0.5 in 2012 to 0.125 in 2017, and then rising to 0.4103 in 2021, but it was always at a low level. This indicates that the LCEY in 16 cities in Anhui Province had a strong mutual influence, there was no strict rating structure, and the network structure was good. (4) From 2012 to 2021, efficiency showed a slight downward trend, from 0.7619 in 2012 to 0.6857, indicating that there were more connections and more spatial spillover paths, and the stability of the network structure was improved. The LN in Anhui Province should continue to strengthen regional coordination and cooperation to bring the advanced technology, capital, and other factors in southern Anhui closer to northern Anhui, promote the rational allocation of factors, and narrow regional differences.
Individual Network Characteristics
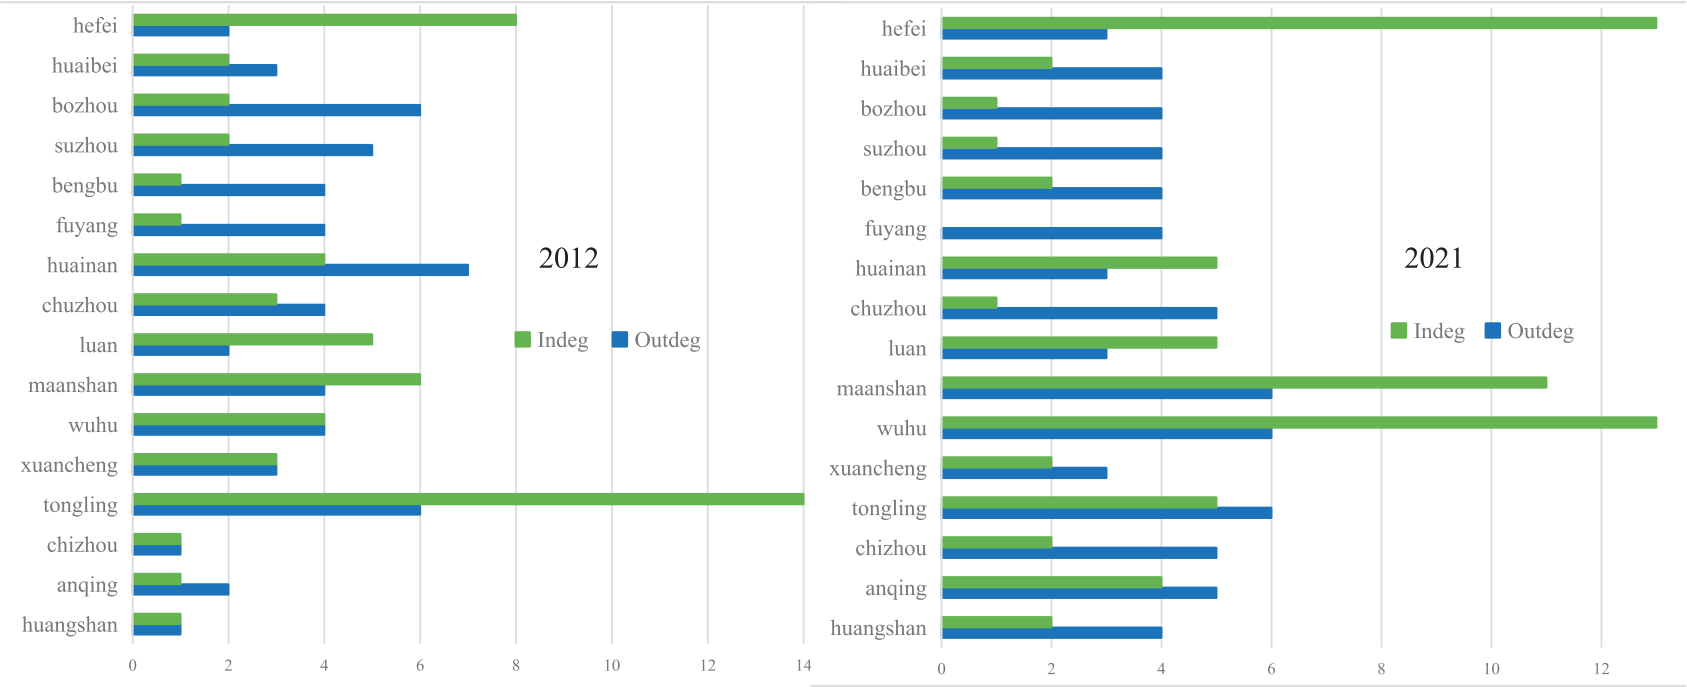
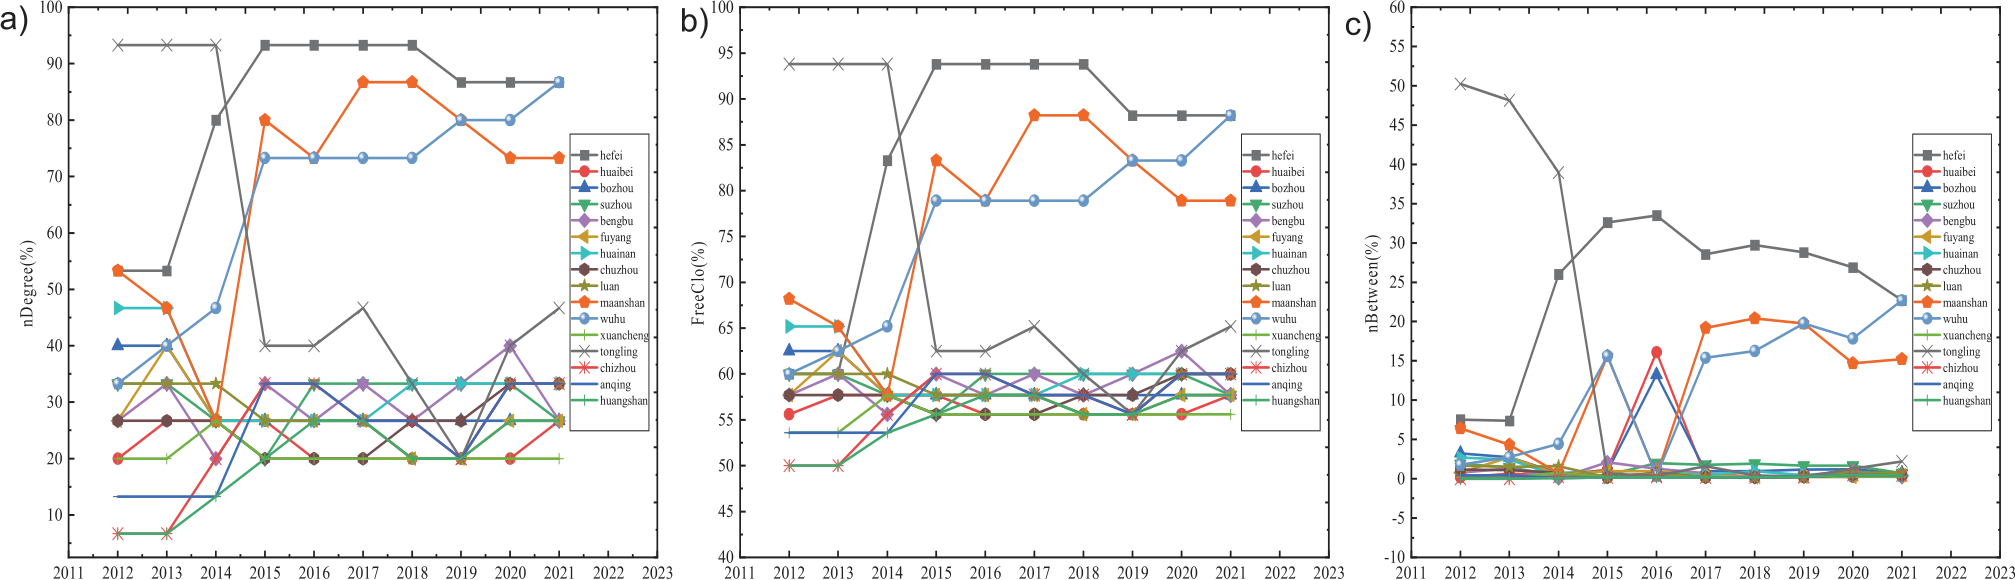
Individual network characteristics, including the point-in and point-out degrees (Table 5 and Fig. 1), degree centrality (nDegree) (Fig. 2a), proximity centrality (FreeClo) (Fig. 2b), and intermediate centrality (nBetween) (Fig. 2c) of each city were calculated.
(1) The relationship between spillover and benefits
Table 5 and Fig. 1 show that, in 2021, the point-in degree of Hefei, Lu’an, Ma’anshan, and Wuhu is higher than the point-out degree. This indicates that these areas benefit more than spillover relationships in the spatial network and have a siphon effect on other areas. The point-out degree of Huaibei, Bozhou, Suzhou, and Fuyang is higher than the point-in degree. This shows that the spillover relation number is greater than the benefit relation number, and the spillover effect is obvious. The point-out degree of others, such as Tongling and Xuancheng, was approximately equal to the point-in degree, indicating that the spillover and benefit relationships were equivalent in these areas. During the development of LN, Hefei, the provincial capital city, and its surrounding cities absorbed talent, resources, and other elements from other regions and are in a state of benefit, with less spillover effect on other regions. This is contrary to people’s cognition and is an interesting discovery that shows that developed cities should export advanced technologies, resources, and other advantages to underdeveloped cities.
(2) Degree centrality
Fig. 2a illustrates that the average value of nDegree increased from 33.33 to 40% during 2012- 2021, exhibiting a varying increasing trend and an increase in the level of network agglomeration. In 2021, the average value of degree centrality was 40, and the degree centrality of Hefei, Ma’anshan, and Wuhu was undoubtedly greater than the mean value; they were in the center position, which is very important for the stability of the spatial network structure. Cities with a degree of centrality lower than average mainly include Chizhou, Anqing, Huaibei, and Huangshan. These cities exhibit weak control and are marginal. The degree of centrality in most cities fluctuated and rose, whereas that of Tongling dropped sharply in 2016 and lost its central position.
Table 4.
Overall network characteristics of LCEY.
Table 5.
Spatial network centrality of LCEY in Anhui Province from 2012 to 2021.
(3) Proximity centrality
As shown in Fig. 2b), proximity centrality can be used to judge whether each city in Anhui Province is easily associated with other cities. In 2021, the average proximity centrality of 16 cities in Anhui Province was 63.89, among which the proximity centrality of Hefei, Ma’anshan, and Wuhu was higher than the average. This suggests that it is simple to connect these cities to other cities in the LCEY spatial network and cannot be easily controlled by other cities. These cities have a strong ability to gather resources, sophisticated transportation networks, and a high degree of economic growth. The low proximity centrality in other cities indicates that the regional gap in LCEY in Anhui Province is too large, which limits the LCEY in Anhui Province. Compared to the change in proximity centrality between 2012 and 2021, except for Tongling, which declined in 2015, the other cities changed little and increased steadily, indicating that the LCEY in Anhui Province was stable.
(4) Intermediate centrality
Fig. 2c) shows that the average intermediate centrality in 2021 is 4.29, and the intermediate centrality of Hefei, Ma’anshan, and Wuhu is higher than the mean. This indicates that these cities have strong control over resources related to logistics carbon emission efficiency and play the roles of intermediaries and bridges. The intermediate centrality of other cities is far lower than the average, and the spatial correlation between cities is not close, which is in a “dominated” role. Compared with the change in intermediate centrality between 2012 and 2021, except for Tongling, which declined in 2015, there was no obvious difference in other cities, and it steadily increased.
Generally, the Matthew effect of the LCEY in Anhui Province is obvious and is characterized by a serious range and uneven spatial distribution. From 2012 to 2021, Hefei, Ma’anshan, and Wuhu ranked first, indicating that these three cities were at the center of Anhui Province, controlling most resources and having a linkage effect with other cities. Affected by geographical conditions, economic levels, and other factors, other cities have a relatively weak attraction to the resource elements of the LCEY. They are frequently passive members of the spatial network who are unable to establish friendly interactions with other cities, especially in northern Anhui.
Block Module and Clustering Feature Analysis
Cluster analysis and plate division were performed using a block model analysis (Fig. 3 and Table 6).
According to the division results of Fig. 3, in 2012, Hefei, Ma’anshan, Wuhu, and Tongling belonged to the first plate; Huaibei and Huainan belonged to the second plate; Bozhou, Suzhou, Bengbu, and Fuyang belonged to the third plate; and Chuzhou, Lu’an, Xuancheng, Chizhou, Anqing, and Huangshan belonged to the fourth plate. Compared with 2012, Ma’anshan and Tongling in the first plate withdrew in 2021; Ma’anshan entered the second plate; and Tongling entered the fourth plate. Huaibei and Huainan changed from II to III; Fuyang changed from IV to III; and Chuzhou, Lu’an, and Xuancheng changed from IV to II. Generally, the first and second plates were mostly the provincial capital cities of Hefei and its surrounding cities, whereas the third and fourth plates were mostly northern Anhui and its surrounding cities.
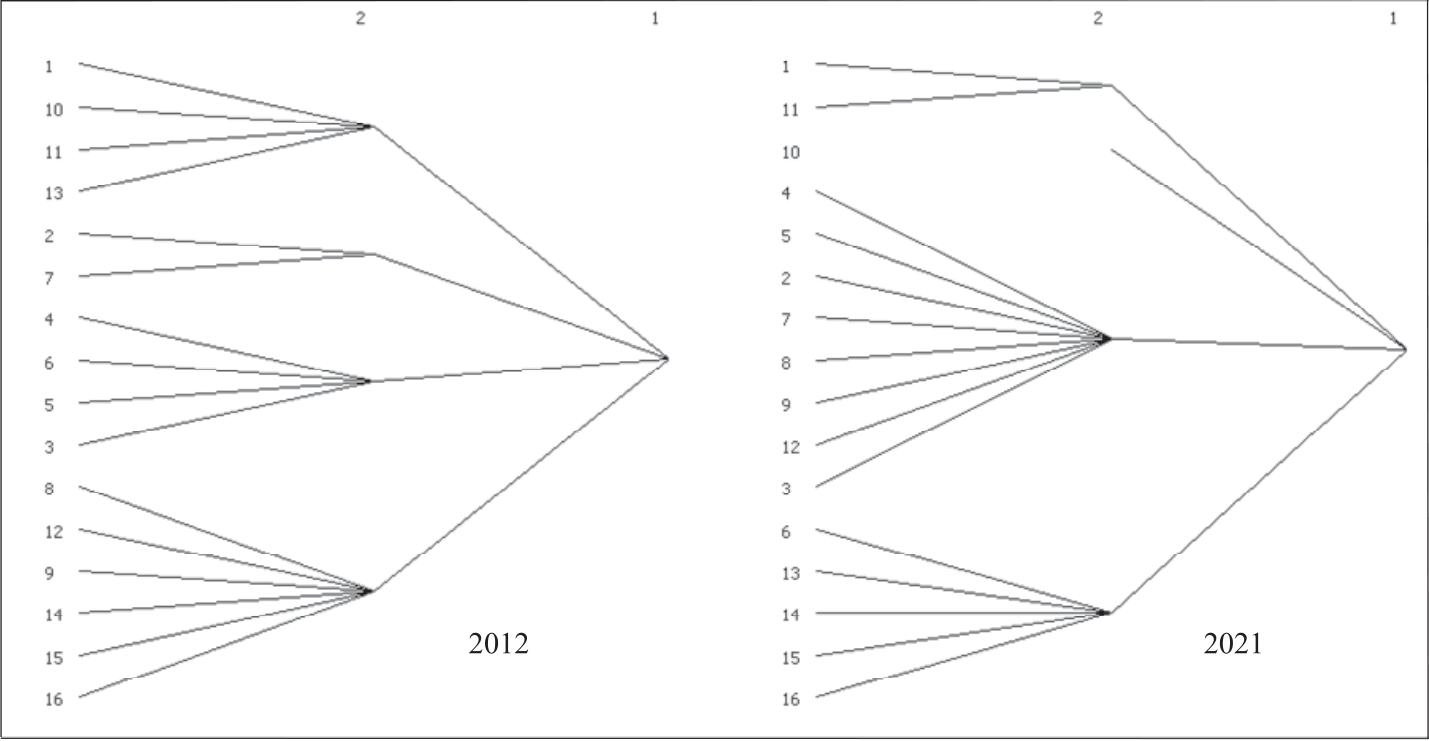
There were 58 correlation numbers in the spatial network of LCEY in Anhui Province in 2012, including three internal plate correlation numbers and 55 out-of-plate correlation numbers. In 2021, the correlation number increased to 69, the internal plate correlation number was 4, and the out-plate correlation number was 60, which indicated that the LCEY between plates was mainly a spatial spillover effect, and the correlation degree of members within plates showed an upward trend with time. In particular, in 2012, plates I, II, III, and IV were part of the “net spillover,” “broker,” “net benefit,” and “net spillover” plates, respectively. In 2021, the receiving correlation number of plate I changed from 29 to 26, and the benefit in the related network decreased. The reception relation number of plate II increases, and the reception and spillover relation numbers are close, which functions as a “broker” plate in the association network by acting as a “bridge” and an “intermediary.” Plates III and IV’s spillover correlation figures clearly increased.
Table 6.
Spatial network division of LCEY in Anhui Province.
Table 7.
Density matrix and image matrix.
To further reveal the spatial correlation between plates, a plate density matrix was constructed (Table 7).
Table 7 illustrates that the first plate is the net benefit plate, the second plate transfers cash and technology associated with LN development, and the third and fourth plates exhibit spillovers to the other plates. The first plate’s cities are situated in and around Anhui Province’s main cities, which serve as the province’s hub for economic development.
Discussion
Enlightenment
As we have shown, spatial network research on the LCEY is still in its early stages, and we have made some contributions to this research. Although we studied the LCEY, our research results have certain reference values for other industries and enterprises. The main innovations include: (1) The SNA method is applied to the research of LCEY, and the spatial network matrix of LCEY is constructed by using the modified gravity model, and the “attribute data” of LCEY is converted into “relational data,” and its overall network and individual network characteristics are analyzed.
(2) By analyzing the spatial network characteristics of the LCEY, this paper proposes more scientific and targeted countermeasures to improve the LCEY.
When the aforementioned findings and studies are considered, we could obtain the following managerial insights:
(1) The LCEY is a major statistic for gauging the logistics industry’s SP. Improving LCEY and reducing carbon emissions while maintaining economic growth is one of the most important ways to improve environmental quality in Anhui Province and is a direction for future development.
(2) Applying the SNA method to LCEY management can reveal the characteristics of the spatial network structure of the LCEY in Anhui Province, as well as the positions and roles of each of the 16 municipalities in the network, which can strengthen cooperation and communication between the municipalities from the perspective of complex relationships and ultimately realize the coordinated win-win development of the logistics system of each municipality and provide intelligent decision-making for the improvement of LCEY.
(3) Vigorously developing economies, strengthening scientific and technological innovation, increasing government investment, and implementing environmental regulation linkages are the main countermeasures to promote the LCEY network structure. should exploit their unique geographic advantages, resources, science, and technology and carry out regional differentiation and linkage development.
Recommendations
The above research conclusions show that the overall level of LCEY in Anhui Province is unbalanced, and the association network between cities presents significant regional differences. To further enhance and stabilize the LCEY in Anhui Province and narrow the development differences among regions, we make the following recommendations:
(1) Cities with high economic levels should increase support for economically underdeveloped areas. Network efficiency decreased from 0.7619 to 0.6857 during the study period. Individual network indicators in cities such as Hefei and Wuhu have almost always been above average, belonging to the net gain segment, which has been acquiring resources from other cities to expand its logistics strength while ignoring its own spillover effects of support and influence on other cities. Therefore, these cities should further strengthen cooperation and exchange in the logistics industry and use their solid economic foundations and advanced scientific and technological levels to drive the low-carbon development of LN in other places. Huaibei, Huainan, and other cities should play the role of “middlemen,” strive for the input of logistics resources to Hefei, Wuhu, and other cities, and drive the development of LN in other cities.
(2) All plates and cities should strengthen their exchanges and interactions during LN development. In 2021, only the image matrices of plates I and III, I and IV, and IV and IV were 1, whereas the rest were 0. The correlation densities between most plates were lower than the overall network density. Therefore, cities should further promote the cross-city flow of logistics elements, such as people, finances, and materials; strengthen cooperation between cities within and between plates; and enhance their density. It is necessary to correctly understand the position and role of cities in the spatial network, improve the regional coordinated development mechanism, vigorously stimulate the radiation-leading role of Hefei, Wuhu, and other cities, and strengthen cooperation with marginal cities such as northern Anhui.
(3) Improve economic levels and establish environmental control mechanisms. Suzhou, Huaibei, and other northern Anhui municipalities have been on the net overflow plate. Therefore, to return to the provinces and cities with poor economies, it is necessary to continuously improve the economic development level, narrow the gap in economic development, increase the network density, bolster the development of transportation infrastructure, provide sufficient financial support to the north of Anhui, guarantee the welfare of scientific and technological personnel, and narrow the difference in science and technology levels between cities. Boost spending on reducing environmental pollution, and strive to achieve balanced development between cities.
Conclusions
Compared to the existing literature, this study has the following advantages: First, the LCEY model is constructed from the perspective of sustainable development, which provides theoretical support for evaluating the sustainable development capability of the logistics industry. Second, the application of the SNA method provides a new perspective for studying LCEY. This study offers a fresh perspective on the evolution of LN by examining the traits and variables that have shaped the spatial network structure of LCEY in Anhui Province from the perspective of complex relationships. However, this study has the following shortcomings: first, it lacks the combined use of relational and attribute data in the LCEY; SNA and traditional econometric models have their own advantages and disadvantages; and comparative studies can be conducted to bring together their strengths and study the spatial relationship between any two places and better promote the SP of LN; second, the sample size and time span can be expanded. This study only examined the spatial network of LCEY in Anhui Province from 2012 to 2021. In the future, we will explore the dynamic correlation and spillover effects of the LCEY in other provinces and cities by refining the research scope and time span.

