

Introduction
As one of the leading economies, China has an obligation to reduce carbon emissions and has set phased emission reduction targets of lowering carbon emission intensity by 40-45% by 2020 [1], peaking carbon dioxide emissions by 2030 [2], and achieving carbon neutrality by 2060 [3]. To realize these targets, China has been focusing on addressing ongoing urbanization, rising energy consumption, and carbon emissions from cities. Increasing the proportion of clean energy supplies and improving energy efficiency are the two main approaches to reducing fossil fuel consumption and emissions. Because it is difficult to change the energy supply structure in the short term, energy efficiency improvement is a more effective channel [4].
To recognize the potential for local leaders to take significant climate action, China has established initiatives in climate-smart, innovative, and low-carbon cities since 2008. China launched the low-carbon city (LCC) pilots in 2010, 2012, and 2017, respectively [5]. The low-carbon city pilot policy aimed at reducing carbon emissions by increasing the proportion of industries with lower carbon emissions, developing clean energy transportation systems, and advocating green lifestyles. These measures are helpful in improving energy efficiency.
Meanwhile, China launched a smart city (SC) pilot policy in 2012 and expanded pilot cities in 2013 and 2014. Smart city pilots were selected for the application and evaluation. The SC pilots covered 287 cities (districts and towns) in total [6]. Smart city construction utilizes information technology to integrate and analyze big data through cloud platforms. Real-time information on resource utilization can help policymakers make optimized decisions to utilize resources and abate environmental pollution.
Moreover, a national innovative city (NIC) pilot policy was implemented to pursue innovative, coordinated, green, open, and shared development. The NIC pilot began in 2008, and 44 cities were approved as national innovation city pilots in 2010. From 2011 to 2013, 16 more cities were supported as national innovative city pilot projects. The number of national innovative city pilots expanded in 2018 and 2022. By the end of 2022, 103 cities had been included in the pilot list. Pilot cities have formulated various policies as well as monitoring and evaluation mechanisms to support innovative national city construction [7]. According to the evaluation criteria, national innovative city pilots should focus on increasing R&D expenditures, the development of high-tech firms, and improvements in energy efficiency.
Previous studies have investigated the influence of each pilot policy, such as the effect of LCC pilot construction on energy efficiency [8] and energy transition [9], the effects of SC pilot construction on digital transformation and environmental pollution [10], and the impact of the NIC pilot policy on energy productivity [11]. A few studies have explored the dual influence of the NIC and LCC pilot policies on residents’ green lifestyles [12] and the collaborative effects of LCC and SC pilot policies [13]. The LCC pilot policy has been proven to have positive impacts on various aspects of cities, corporations, and households. At the city level, the LCC pilot policy can improve urban energy efficiency, promote energy transition, facilitate low-carbon innovation [14], and improve total-factor carbon emission efficiency [15]. These improvements could reduce urban carbon emissions [16] and carbon intensity [17, 18]. At the corporate level, the LCC pilot policy promotes entrepreneurial activity [19], increases corporate energy efficiency, promotes corporate green innovation [20, 21], improves corporate environmental performance [22], and reduces corporate carbon emissions and pollution [23]. Moreover, the LCC pilot policy can increase corporate labor demand [24] and financialization [25] and promote smart manufacturing practices [26]. However, the LCC pilot policy was also found to reduce corporate environmental expenditures [27]. At the household level, the LCC pilot policy has been found to reduce household electricity consumption [28] and promote low-carbon choices in residents’ lives through propaganda on green lifestyles and sustainable consumption [29].
Smart city pilot policies, especially smart city infrastructure construction, can help mitigate urban carbon emissions through the smart transformation of industries with high emissions. For instance, an information cloud platform can provide the information required for the development of smart energy, smart grids, smart transportation, and smart logistics, which helps realize the goals of energy saving, clean energy development [30], carbon emission reduction [31-33], energy efficiency improvement [34, 35], green economic efficiency improvement [36, 37], and urban carbon productivity improvement [38]. The SC pilot policy can promote urban innovation [39], which in turn promotes green technological progress and improves green total factor productivity [40] and environmental performance [41]. The advanced information technology used in smart cities can help monitor water quality [42], air quality, and solid waste pollution. Therefore, the SC pilot policy can help reduce various pollutions, mitigate PM2.5 concentrations [43], and reduce nitrogen dioxide (NO2) air pollution [44]. Similar to the LCC pilot policy, the SC pilot policy can enhance urban entrepreneurial activity. However, the SC pilot policy has adverse effects on corporate employment [45].
The NIC pilot policy can promote urban green growth [46], break carbon lock-in [47], increase urban carbon unlocking efficiency [48] and carbon total factor productivity [49], and reduce CO2 emissions from industrial firms. Moreover, the NIC pilot policy can promote urban green economic efficiency and green logistics efficiency [50], improve energy productivity, energy efficiency [51], and ecological efficiency [52]. The NIC pilot policy can improve industry - university - research knowledge flow [53] and collaborative innovation [54], which helps improve urban innovation performance and innovation convergence [55] and promote green technology progress. Additionally, innovation - supporting policies have externalities for the innovation performance of non-targeted companies as well. The NIC pilot policy also helps to enhance export product quality [56].
However, the impact of the policy mixes on energy efficiency has not been explored. Can a pilot policy mix of LCC, SC, and NIC pilots generate collaborative effects on urban energy efficiency? What kind of policy mix can produce more significant effects? Is the combined effect of the dual pilot policies larger than that of a single policy? What is the mechanism by which pilot policies influence energy efficiency? Are there heterogeneous impacts in different regions? To address these questions, we carried out the following research: First, through difference-in-difference modeling, we analyzed the triple effects of the three pilot policies. Second, we conducted an in-depth analysis and comparison of the impacts of the individual, dual, and triple policies. Third, the potential path through which pilot policies affect energy efficiency was explored. It was found that the pilot policy improved energy efficiency by promoting innovative green city activities. Fourth, through a heterogeneity analysis, we found that the pilot policy enhanced energy efficiency more significantly in eastern cities and special cities. These findings can provide specific guidance for policy formulation in China and other developing countries.
The significance of this research lies in its focus on the collaborative impact of triple pilot policies on energy efficiency. As urbanization accelerates, the need to address the associated challenges of increased energy consumption and carbon emissions becomes increasingly urgent. This study provides valuable insights into effective strategies for enhancing urban energy efficiency through policy combinations. The findings of this research have important implications for related research fields. Firstly, it highlights the importance of policy combinations in achieving significant improvements in urban energy efficiency. This suggests that future research should explore the potential for developing more comprehensive and integrated policy frameworks to address the complex challenges of sustainable urban development. Secondly, the study’s focus on green innovation as a key mechanism for enhancing energy efficiency highlights the need for further research on the role of technological innovation in sustainable urban development. This is particularly relevant given the increasing emphasis on green technologies and sustainable solutions in the global effort to mitigate climate change. Finally, the observed differences in the impact of the triple pilot policies across different types of cities emphasize the importance of tailoring policy interventions to local contexts. This suggests that future research should prioritize understanding the specific challenges and opportunities faced by different cities and regions and develop policies that are tailored to their unique characteristics and needs. In summary, this research contributes to a broader understanding of the role of policies in enhancing urban energy efficiency and sustainable development. Its findings have implications for both the scientific community and policy-makers, highlighting the need for more integrated and context-specific approaches to address the complex challenges of sustainable urban development.
Material and Methods
Data and Variables
Pilot policy mix: We used 274 Chinese cities from 2006 to 2021 as the study sample. The LCC, SC, and NIC pilot policies are assessed as exogenous shocks. The variable low-carbon represents the LCC pilot policy. When a city is selected as an LCC pilot, the variable low-carbon takes the value of 1 for the current year and subsequent years and 0 otherwise. The variable smart represents infrastructure improvements and upgrades under the SC pilot policy. When a city is approved as a SC pilot, the value of smart is taken as 1, and 0 otherwise. The variable innovative measures the national innovative city pilot policies. The pilot cities were gradually added in batches in 2012, 2013, and 2018, respectively. When a city is NIC piloted, innovative takes the value of 1, and 0 otherwise. The variables dual_ls, dual_li, and dual_si represent the policy mix of the dual pilot policies of LCC and SC, LCC and NIC, and SC and NIC, respectively. If a city is selected as both an LCC pilot and an SC pilot, the value of dual_ls is one; otherwise, it is zero. Similarly, if a city is both an LCC pilot and an NIC pilot, the value of dual_li is 1 and 0 otherwise. If a city is both an SC pilot and an NIC pilot, the value of dual_si is one; otherwise, it is zero. The variable triple represents the mix of the three pilot policies. If a city has LCC, SC, and NIC pilots simultaneously, the value of triple is 1, and 0 otherwise.
The energy efficiency is calculated using regional gross domestic production (GDP) and energy consumption (1,000 yuan/ton of standard coal). The total energy consumption of cities was obtained from the China Urban Statistical Yearbook and the energy conversion coefficients were from the China Energy Statistical Yearbook.
To improve the reliability of the results, the following variables are included in the model: the level of city economic development, industrial structure, fixed asset investment level, consumption level, level of openness, and urbanization level (see Table 1).
Econometric Analysis Model
Multiperiod difference-in-difference (DID) models controlling for individual and time effects were constructed to test the effects of the pilot policy mix. Pilot cities were used as experimental groups. The specific model was set up as follows:
where EFFi,t is the energy efficiency of cities, i represents the city, t represents the year, and Controls represents the variables that mainly reflect city characteristics. λ stands for industry-fixed effects and ν for time-fixed effects. policyi,t is the treatment group dummy variable. This refers to a single pilot policy (LCCi,t, SCi,t, NICi,t), dual pilot policies (dual_lsi,t, dual_lii,t, dual_sii,t), and triple pilot policies (triplei,t). triplei,t is set to 1 if the i city is the LCC pilot, SC pilot, and NIC pilot at the same time in year t and 0 otherwise. β1 measures the impact of the pilot policy mix on urban energy efficiency. εi,t is a random error term and β0 is a constant term.
Table 1.
Variable Definition.
Results and Discussion
Descriptive Statistics
Table 2 shows that the mean value of EFF is 0.127. The large gap between the largest and smallest values and the large standard deviation indicate that there are large variations in energy use efficiency among cities, which makes our research meaningful. The mean value of EFF under LCC pilot policy is 0.138, higher than that of cities under SC pilot policy (0.136) and NIC pilot policy (0.126). Under the triple pilot policy of LCC, SC, and NIC pilots, the average value of EFF is 0.138, and the median value is the highest (0.124). This tentatively confirms that energy use efficiency is improved under the influence of pilot policies, and its improvement is more obvious under the combination of the triple policies.
The Impact of Triple Pilot Policies
Table 3 reports the influence of the triple pilot policy mixes on energy efficiency. Columns (1) - (2) show that the coefficient of triple after adding control variables is 0.037, indicating that the energy efficiency of the city increases under the collaborative influence of LCC, SC, and NIC pilot policies. Columns (3) - (6) show the results one and two years after policy implementation, and the coefficients are significantly positive in either case, which once again confirms the effect of the triple policies on the improvement of energy efficiency.
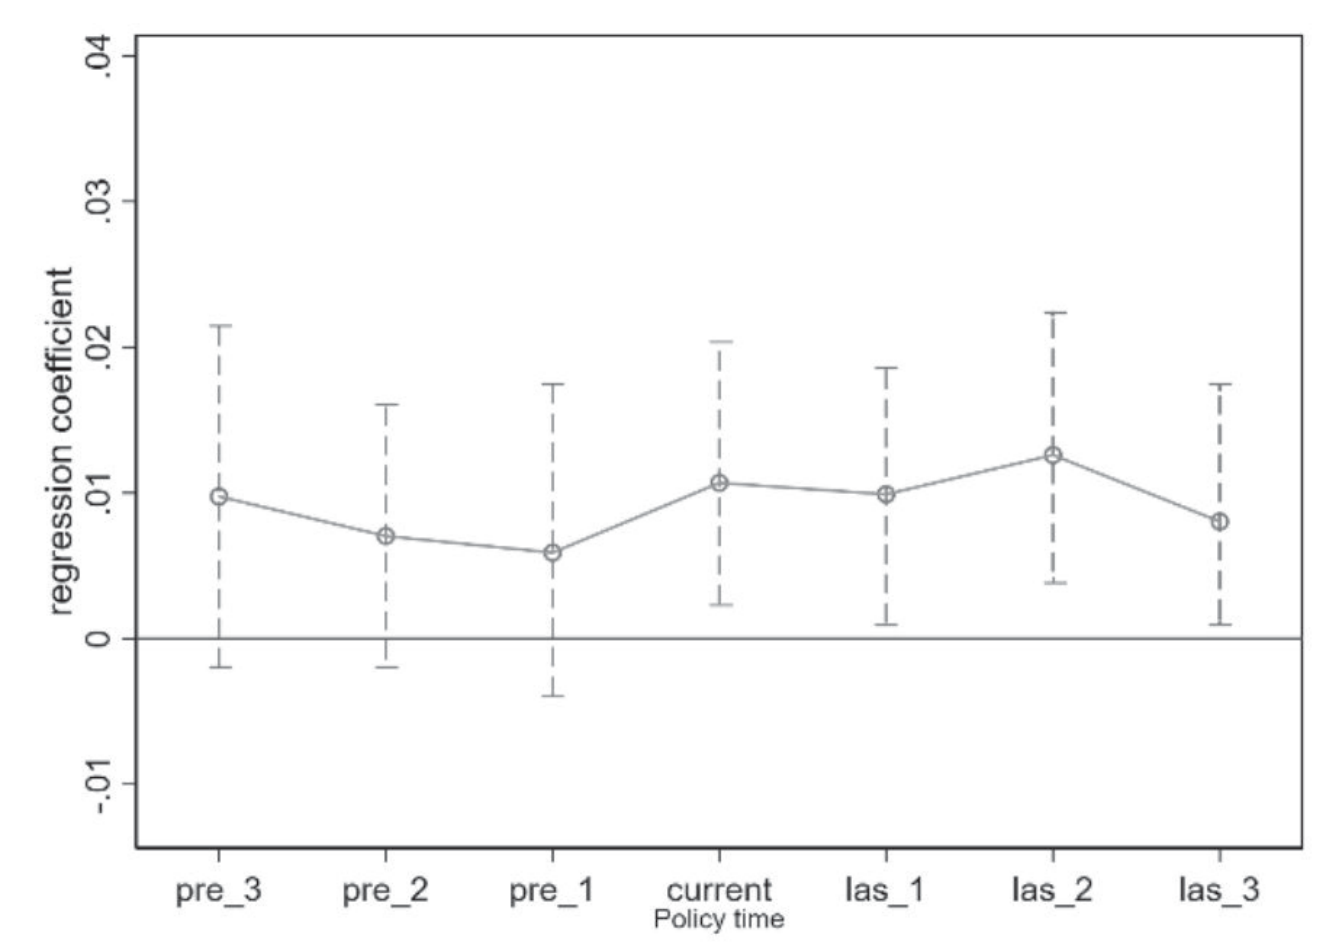
To verify whether the sample satisfies the parallel trend hypothesis, we define seven dummy variables pre_3, pre_2, pre_1, current policy time, las_1, las_2, and las_3, denoting three years before and after the triple pilot policies, respectively. We then replace the variable triple with these dummy variables. As shown in Fig. 1, in the first three years before the pilot policy, the coefficients are insignificant, and the 95% confidence interval also contains zero, which means that the parallel trend test has passed. Three years after the pilot policy, the coefficient was significant, indicating that the collaborative effect of the triple policy promoted energy efficiency.
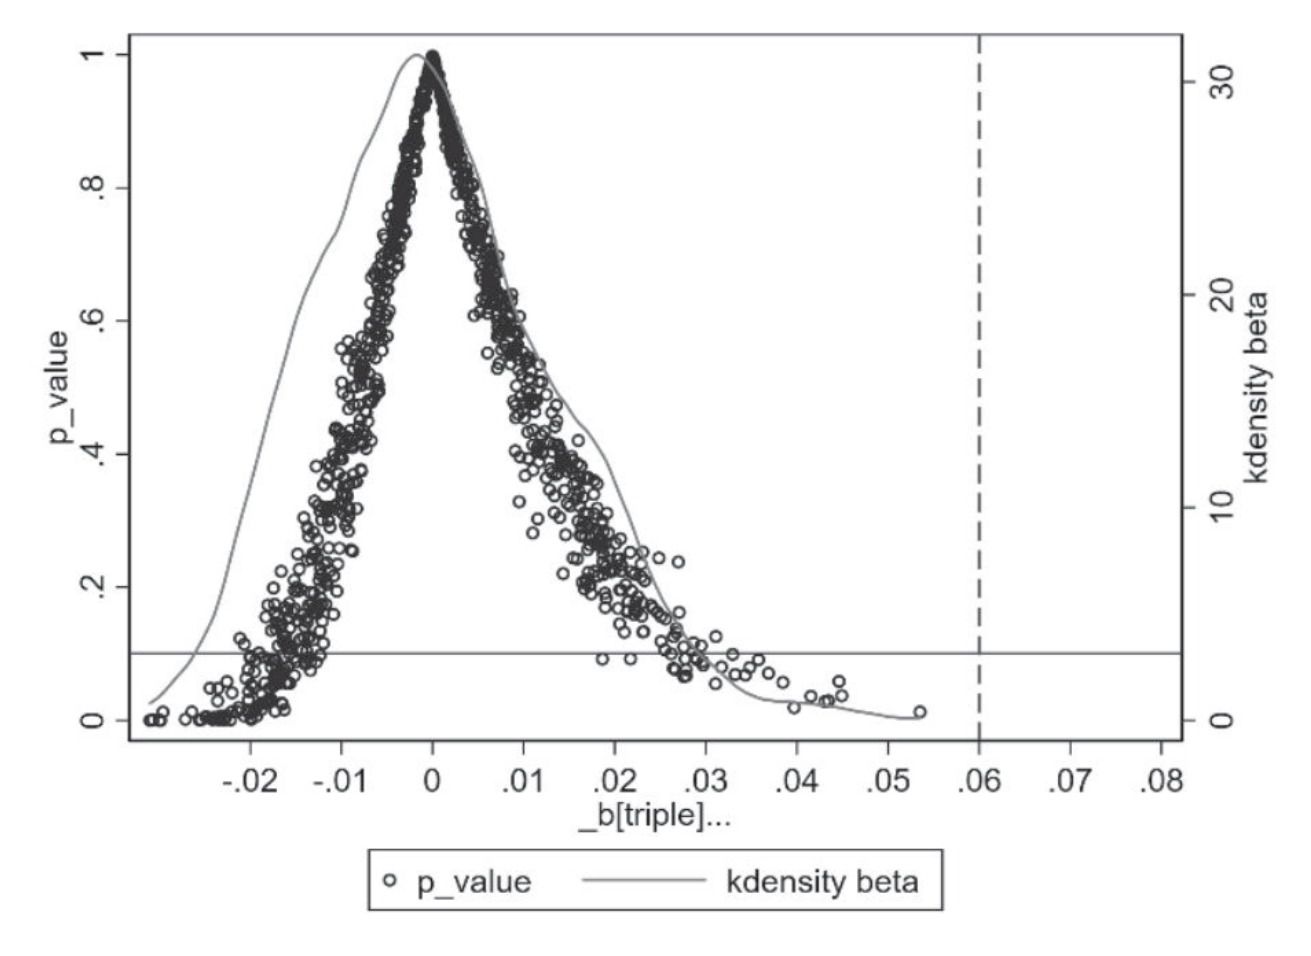
To test whether the influence of the triple pilot policies on energy efficiency was caused by other random factors, a placebo test was used to identify the contingency of the triple pilot policies. We construct a “pseudo-policy dummy variable” by randomly selecting a sample 500 times and then regressing the estimation of the coefficients and the distribution of the P-value of model (1). Fig. 2 shows that the mean value of the coefficient of the “pseudo-policy dummy variable” is close to zero, which is far less than the coefficients of the baseline regression. The estimated distribution of the coefficient was close to a normal distribution, and the p-value of the coefficients was mostly larger than 0.10, indicating that the coefficient was insignificant. This suggests that the impact of the triple pilot policies on energy efficiency is not caused by other random factors, and the conclusions obtained are reliable.
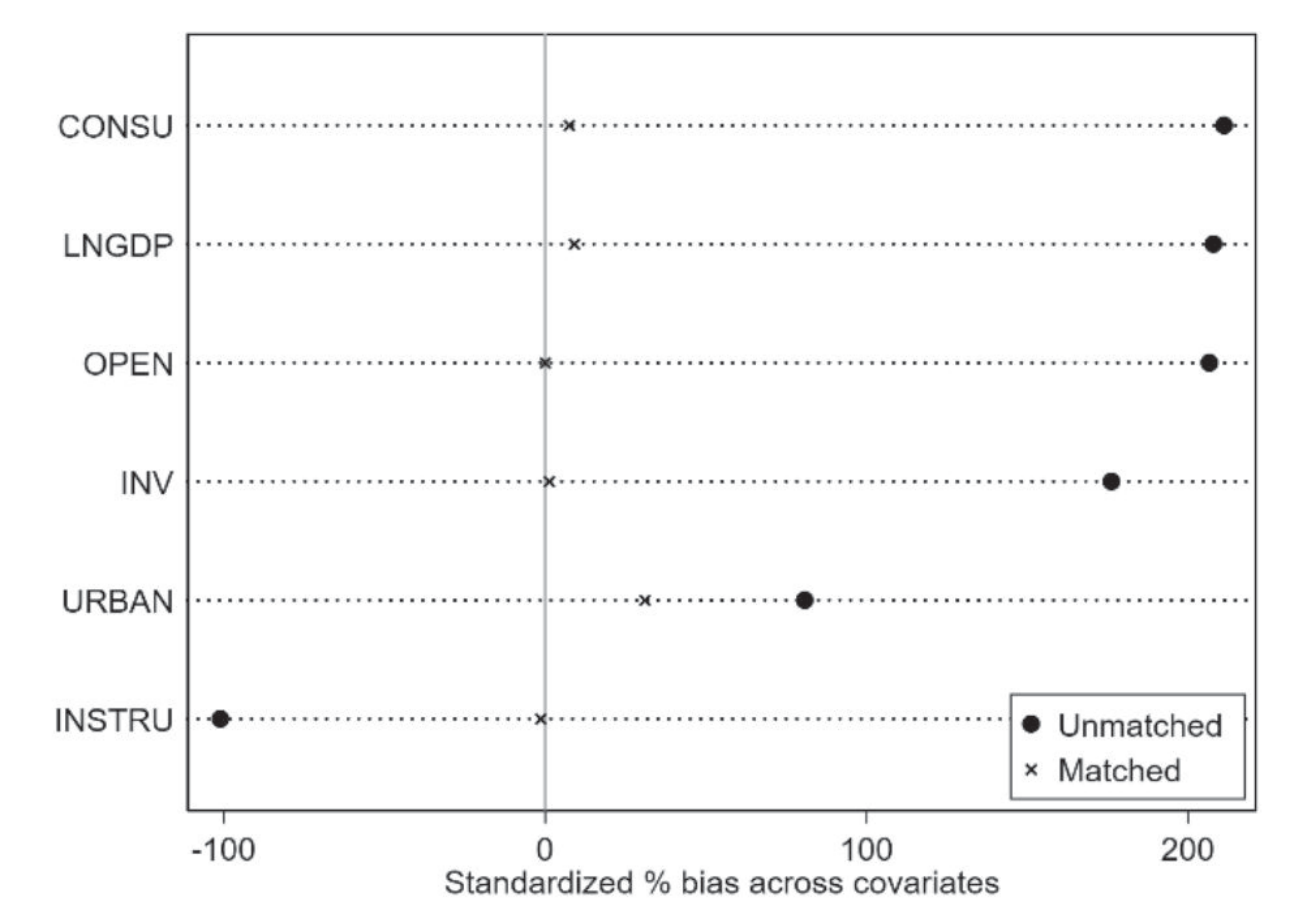
The propensity score matching (PSM) method was used to test the robustness of the baseline model estimates. The samples exhibited considerable regional and economic differences, with large individual differences. Therefore, this study combined PSM with the DID model, used nearest-neighbor matching, and performed a balance test to examine the matching effect. The PSM matching results are shown in Fig. 3. Finally, the matched samples were subjected to DID estimation.
Table 2.
Descriptive statistics.
Table 3.
Baseline regression results.
The results of the PSM-DID indicate that the direction and significance of the coefficients of triple remain the same as the baseline regression results (columns (1) – (2) of Table 4), further validating its robustness.
The selected sample interval may have impacted the results; therefore, we selected subsample data from 2010 to 2020 for the robustness test. Columns (3) – (4) of Table 4 show that the coefficients of triple are all significantly positive, which proves the robustness once again.
Policy Mix Effect Comparison
Single Pilot Policy
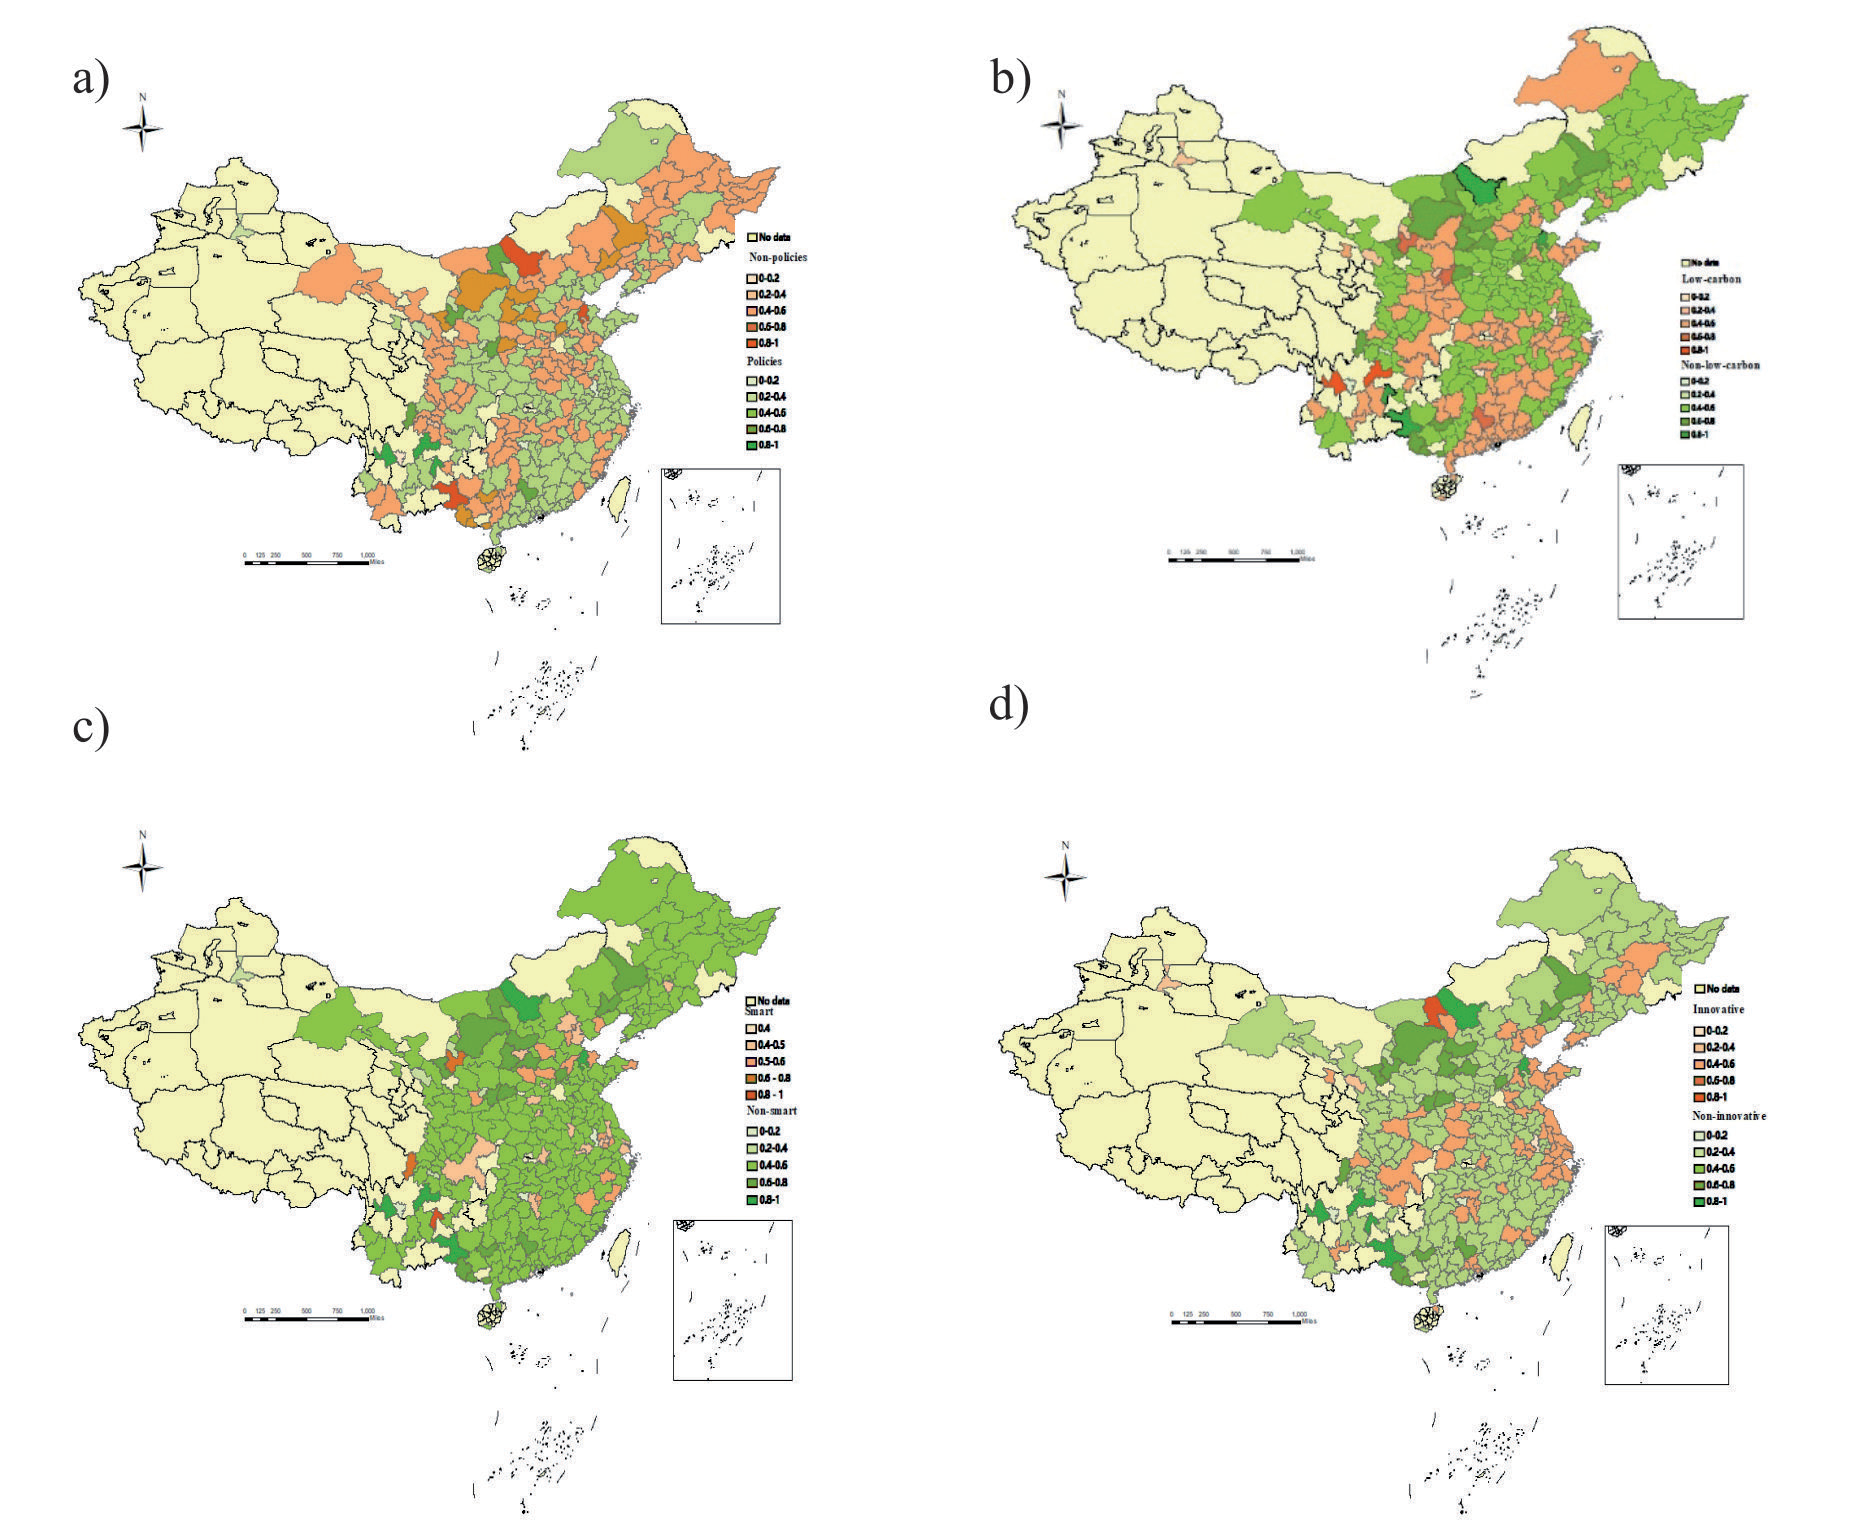
To thoroughly analyze the impact of the triple pilot policy mixes, we examined the impact of each policy on urban energy efficiency. We standardize the energy efficiency growth of each city from 2006-2021 and present it in Fig. 4.
Almost half of the cities in China participated in the pilot policy, while the majority of the cities were LCC pilots (Fig. 4 b), and the number of SC (Fig. 4 c) and NIC pilots (Fig. 4 d) was small. The energy efficiency growth of cities without pilot policies was mainly in the range of 0.4-0.6, and that of cities with pilot policies was mainly above 0.6 (Fig. 4 a). The LCC pilot cities with energy efficiency growth above 0.6 account for a relatively large number of cities, with the largest proportion of cities in the 0.4-0.6 range and very few cities with energy efficiency below 0.4 (Fig. 4 b). Energy efficiency in smart pilot cities generally increases above 0.5 (Fig. 4 c). Energy efficiency growth in innovative pilot cities is generally above 0.4 (Fig. 4 d).
Similarly, Table 5 (columns (1) – (3)) show that the coefficients of low-carbon smart, and innovative are all significantly positive, indicating that each pilot policy can improve urban energy efficiency. The coefficient of the NIC pilot policy (0.020) is the largest compared to that of the LCC pilot policy (0.017) and the SC pilot policy (0.014). The coefficient of the triple-pilot policy on energy efficiency was 0.037 (Table 3 column (2)), larger than that of any single-pilot policy, showing that the collaborative impact of the pilot policy mix is more significant.
Dual vs Single Pilot Policy
Columns (4) - (6) of Table 5 shows that the coefficients of the three types of dual pilot policies are significantly positive at the 1% level. And from Fig. 5, we can clearly see that the coefficient of triple pilot is larger than that of dual pilot (dual_ls, dual_li, and dual_ si), and the coefficient of dual pilot is larger than that of the single pilot. The coefficient of dual_ls (0.033) is the highest, and the coefficient of dual_si (0.026) is the lowest, indicating that the synergy of LCC and SC pilot policies is the most effective among the three types of dual pilot policies. Whereas the coefficients of the single pilot policy in the previous section on energy efficiency are all less than 0.02 (see Table 5), suggesting the dual pilot policies have a collaboratively improved effect on urban energy efficiency. The coefficient of 0.037 for the triple-pilot policy (see Table 3 column (2)) is also larger than that for the dual-pilot policy.
To test whether the dual pilot policy mix has a more significant energy utilization effect than the single one, we excluded a sample of cities that are neither LCC nor SC and analyzed the effect of the shift from single pilot cities to dual pilot cities. The coefficients of dual_ls, dual_li, and dual_si are significantly positive (Table 6), indicating that dual-pilot policies have stronger energy-utilization effects than single-pilot policies.
Triple vs Dual Pilot Policy
To further test whether the triple-pilot policy have more significant energy utilization effect than the dual-pilot policy, we excluded the non-pilot and single-pilot policy samples and analyzed the effect of the shift from dual-pilot to triple-pilot cities. The coefficients of triple policy are significantly positive before and after adding control variables (Table 6 column (4)). Therefore, triple-pilot policies have more significant energy efficiency improvement effects than dual-pilot policies; that is, the collaborative impacts of triple-pilot policies further improve urban energy efficiency (Fig. 5).
Mechanism Analysis
The following mediated effects models were used to analyze the benchmarking mechanism: Equation (2) focuses on the influence of the triple-pilot policy on cities’ green innovation, where we use the number of green patent applications per 1,000 R&D personnel to represent the level of green innovation (GI). Equation (3) takes green innovation as the mediating variable and energy efficiency as the dependent variable. Step 1, using Equation (2) to observe whether the triple pilot policy significantly affects urban green innovation; Step 2, using Equation (3) to observe whether green innovation significantly affects energy efficiency. If c has the same sign as b*a, the mechanism test passes, indicating that green innovation mediates the path of the triple-pilot policy to improve energy efficiency.
Table 4.
Robustness test.
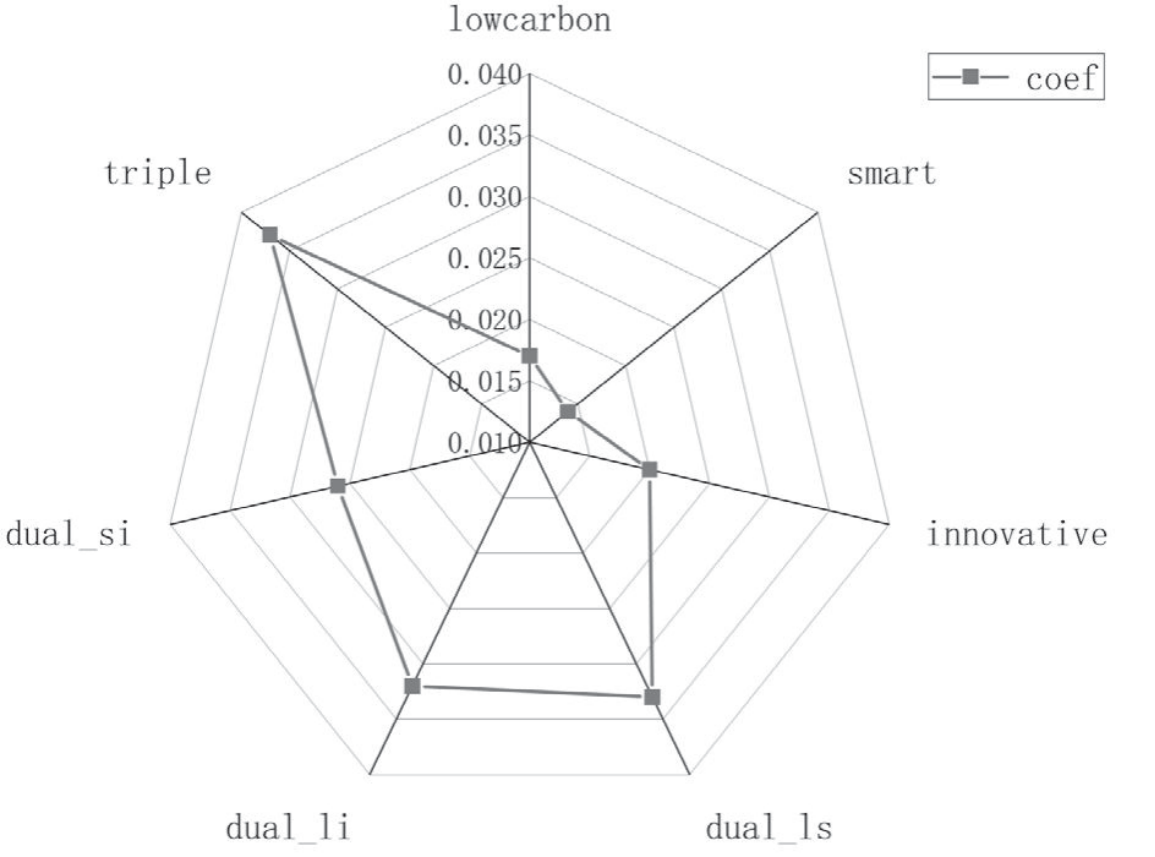
Table 5.
Single and dual pilot policy test.
Table 6.
Comparison of the single pilot, dual pilot, and triple pilot.
The results show that the triple pilot policy significantly enhances urban green innovation: a = 1.446 (column (1) of Table 7). Column (2) shows that urban green innovation significantly enhances energy efficiency b = 0.002, and at the same time, the triple pilot policy significantly enhances energy efficiency c = 0.034. It can be observed that c has the same sign as b*a, and the mechanism test is complete. The triple pilot policy improves urban energy efficiency by promoting green innovation.
Heterogeneity Analysis
Owing to China’s large area and regional differences, the levels of economic development in different regions vary a lot. Cities are categorized into three major regions: the east, middle, and west. The East is a more economically developed region, while the West is a more geographically disadvantaged and less economically developed region. We categorized the cities into East, Middle, and West. Columns (1) - (3) of Table 8 show that the coefficients of triple are all significantly positive, while the coefficient of triple is the largest in eastern cities and the smallest in western cities. Therefore, the improving effect of the triple pilot policies on urban energy efficiency was stronger in eastern cities.
In addition, the level of cities is more complex, including municipalities, provincial capitals, and special policy cities such as sub-provincial cities. Therefore, we categorize our sample cities into prefecture-level and special cities. The results show that the coefficients of the triple are larger in special cities (columns (4) - (5) of Table 8).
Conclusions
To assess the improving effect of different pilot policy mixes on energy efficiency, we constructed difference - indifference modeling based on data from 274 prefectural - level cities from 2006 to 2021. The results indicate that the triple pilot policies of LCC, SC, and NIC pilots have a collaborative improvement effect on urban energy efficiency, and robustness tests show that the results are reliable. A comparison of different kinds of pilot policy mixes indicates that the LCC, SC, and NIC pilot policy are all able to promote energy efficiency, while the dual pilot policy has a stronger energy utilization effect than the single one, and the triple pilot policy mix has a stronger effect than the dual pilot policy mix. Among the three types of dual pilot policies, the collaborative effect of LCC and SC pilot policies was the most significant. Through a mechanism test, we found that the triple pilot policy promotes green innovation in the city and energy efficiency, which means that green innovation plays a mediating role. And the role of triple pilot policies in enhancing urban energy efficiency is greater in eastern cities and special cities.
Table 7.
Mechanism analysis results.
| (1) | (2) | |
|---|---|---|
| Variables | GI | EFF |
| triple | 1.446*** | 0.034*** |
| (2.87) | (4.58) | |
| GI | 0.002*** | |
| (2.99) | ||
| Controls | YES | YES |
| City & Year | YES | YES |
| _cons | -10.209*** | 0.430*** |
| (-16.22) | (10.26) | |
| N | 4442 | 4442 |
| R2 | 0.355 | 0.804 |
Table 8.
Moderating effect of regional characteristics.
The following policy recommendations are proposed based on the above findings: First, a policy coordination mechanism should be established, especially the coordination between the LCC pilot policy and the SC pilot policy, which has been proven to be the most effective among all dual pilot policies. The government can establish a cross-sectoral and cross-disciplinary policy coordination mechanism to ensure that the policy is complementary and collaborates during the implementation process. Policy conflicts or duplications can be avoided by strengthening communication and collaboration among departments, and the effectiveness of policy implementation can be improved. For the specific implementation of policies, the government should formulate corresponding regulations and guidance documents to clarify the specific requirements and standards for policy implementation. Simultaneously, a monitoring and assessment mechanism should be established to regularly evaluate the results of policies and ensure they are effectively implemented.
Second, the policies promoting green innovation should be integrated with policies that improve energy efficiency. The government can establish a green innovation platform to promote cooperation and exchange among enterprises, universities, and research institutions. Sharing resources, technologies, and information can promote innovation and improve energy utilization efficiency. The development of green products and markets can be encouraged through the government’s green purchase policy.
Third, policies should vary for different regions. As the pilot policy has been more effective in improving energy efficiency in eastern cities and special cities, future policies should focus on other regions. For instance, support for green innovation in western cities and prefecture-level cities should be strengthened to encourage enterprises in these areas to conduct green technology innovation. The economies of the eastern coastal cities are more developed, their technology levels are higher, and enterprises in these areas can introduce advanced energy-efficient technologies and green production methods from abroad. Central inland cities have a better industrial base and can step up efforts to upgrade and remodel traditional industries.
List of Abbreviations
– LCC: low-carbon city – SC: smart city – NIC: national innovative city – EFF: energy efficiency – dual_ls: the policy mix of the dual pilot policies of
LCC and SC – dual_li: the policy mix of the dual pilot policies of
LCC and NIC – dual_si: the policy mix of the dual pilot policies of
SC and NIC – triple: the policy mix of three pilot policies, equals to
LCC*SC*NIC – GI: green innovation

