

Introduction
In the process of urban construction and development, the aquatic ecological environment in many areas is deteriorating because of the massive exploitation and utilization of water resources, which greatly hinders the sustainable development of cities and affects the quality of local residents’ lives [1]. As an internationally recognized “urban secondary water source” [2], reclaimed water not only plays an important role in alleviating water shortages but can also effectively reduce the discharge of polluting substances [3]. It is an inevitable choice to realize the coordinated and sustainable development of water resources, the economy, and the water environment [4]. Reclaimed water generally refers to urban sewage, including domestic and industrial wastewater, which can be reused within a certain range after treatment by sewage treatment plants and reaching relevant standards [5]. The treated reclaimed water is widely used in various fields, including agricultural irrigation, landscape irrigation, industrial production, wetland restoration, river and lake recharge, etc. [6, 7]. Particularly in the context of urban river water supply, this approach has gained widespread adoption in recent years across countries such as the United States, Japan, Australia, and China [8, 9]. For example, 92.3% of reclaimed water is used to replenish rivers and lakes in Beijing, China [10], whereas 25% of reclaimed water is returned to lakes in California, USA [11].
Although most of the water quality parameters of reclaimed water meet the relevant standards after treatment, the water sources mainly come from urban sewage and industrial wastewater, among which there are many types of pollutants, and there are still some uncertain factors even after certain treatments [12]. For instance, it was previously found in the reclaimed water ecological replenishment tidal White River that reclaimed water has high total nitrogen (TN) and Total Phosphorus (TP), which can easily cause eutrophication of the water body [13]. Owing to the poor quality of some reclaimed raw water and the influence of disinfection byproducts on the treatment process, the effluent of reclaimed water may be biologically toxic to aquatic organisms [14]. For example, an acute toxicity analysis of the effluent of each unit of the reclaimed water treatment process across five cities in northern China found that if the main conventional indicators of each unit of effluent meet the requirements, they still have certain biological toxicity to luminous bacteria and Daphnia magna, which may require further in-depth treatment [15]. In addition, with the increasing frequency of reclaimed water use in recent years, hundreds of pathogenic microorganisms have been identified in urban landscape water bodies [16]. As an example, when reusing reclaimed water from the Old Summer Palace in Beijing, there is a notable increase in the concentrations of Enterobacterium sphaerae and Escherichia coli. Each reuse cycle introduces specific ecological risks [17].
To address the problem of water pollution in reclaimed water, the most common treatment method used in major rivers and lakes is the introduction of ecological restoration technology. The physical and biological effects of bioremediation technology are used to reduce pollutants in water bodies [18]. For instance, in the Tianjin Teda reclaimed water landscape water bodies, constructed wetland technology effectively reduced the TN and TP contents in the reclaimed water [19]. In addition, some studies have shown that adding different plant materials to a biological floating bed can effectively reduce the nitrogen and phosphorus content of landscape water through reclaimed water recharge [20]. However, at present, in the reclaimed water restoration river project, most studies focus on the changes in the water quality parameters of the reclaimed water body using ecological restoration technology. Comprehensive studies on biological toxicity and pathogenic microorganisms are relatively limited; moreover, studies on the guarantee effect of the aquatic ecosystem remediation engineering area integrating multiple ecological restoration technologies on the reclaimed water quality are still scarce.
To further reveal the protective role of aquatic ecosystem remediation engineering areas in front of reclaimed water replenishing urban rivers, this study takes the aquatic ecosystem remediation engineering area of a reclaimed water replenishing urban river in Ningbo (China) as an example and continuously monitors the spatio-temporal variation of water quality (Chemical Oxygen Demand (COD), Ammonia Nitrogen (NH4+-N), TN, and TP), acute biological toxicity, and microorganisms. A study on the changes in water quality, biological toxicity, and pathogenic microorganisms in water bodies shows the guaranteed role of aquatic ecosystem remediation engineering areas in reclaimed water replenishing urban rivers and provides theoretical support for the water quality management of reclaimed water and urban landscape rivers.
Material and Methods
Study Area Profile
Ningbo City, located at the estuary of the Yangtze Delta, is one of the most developed cities in southeast China. As a pioneering region in the country’s pilot program for reclaimed water utilization, Ningbo has been increasing its technological investment and improving the efficiency of reclaimed water utilization in areas such as ecological river replenishment and industrial water use. Currently, there are 16 facilities supporting the construction of reclaimed water production, with a designed production capacity of 0.679 million cubic meters per day [21]. All the produced reclaimed water is discharged into the urban rivers of Ningbo City to improve the hydrodynamic condition and pollutant assimilation capacity of the streams.
The Fu River, chosen as the research target area in this study, is one of the most typical urban rivers featuring reclaimed water replenishment since the 2010s. It exclusively relies on reclaimed water as its source of replenishment and is approximately 1500 meters long and 5 meters wide in Ningbo City. The reclaimed water was obtained from the (CF WWTP). The influent water of the plant was domestic sewage, which underwent advanced treatment to meet the emission requirements of Zhejiang Province’s DB33/2169-2018 “Emission Standards for Major Water Pollutants from Urban Sewage Treatment Plants”. In addition, ecological concrete slope protection was installed on both sides of the river to mitigate the ingress of external pollutants into the river. This allowed for a more objective study of changes in water quality, biological toxicity, pathogenic bacteria, and drug-resistant bacteria before and after the reclaimed water replenishment project and aquatic ecosystem remediation engineering.
Overview of the aquatic ecosystem remediation engineering area and arrangement of monitoring points:
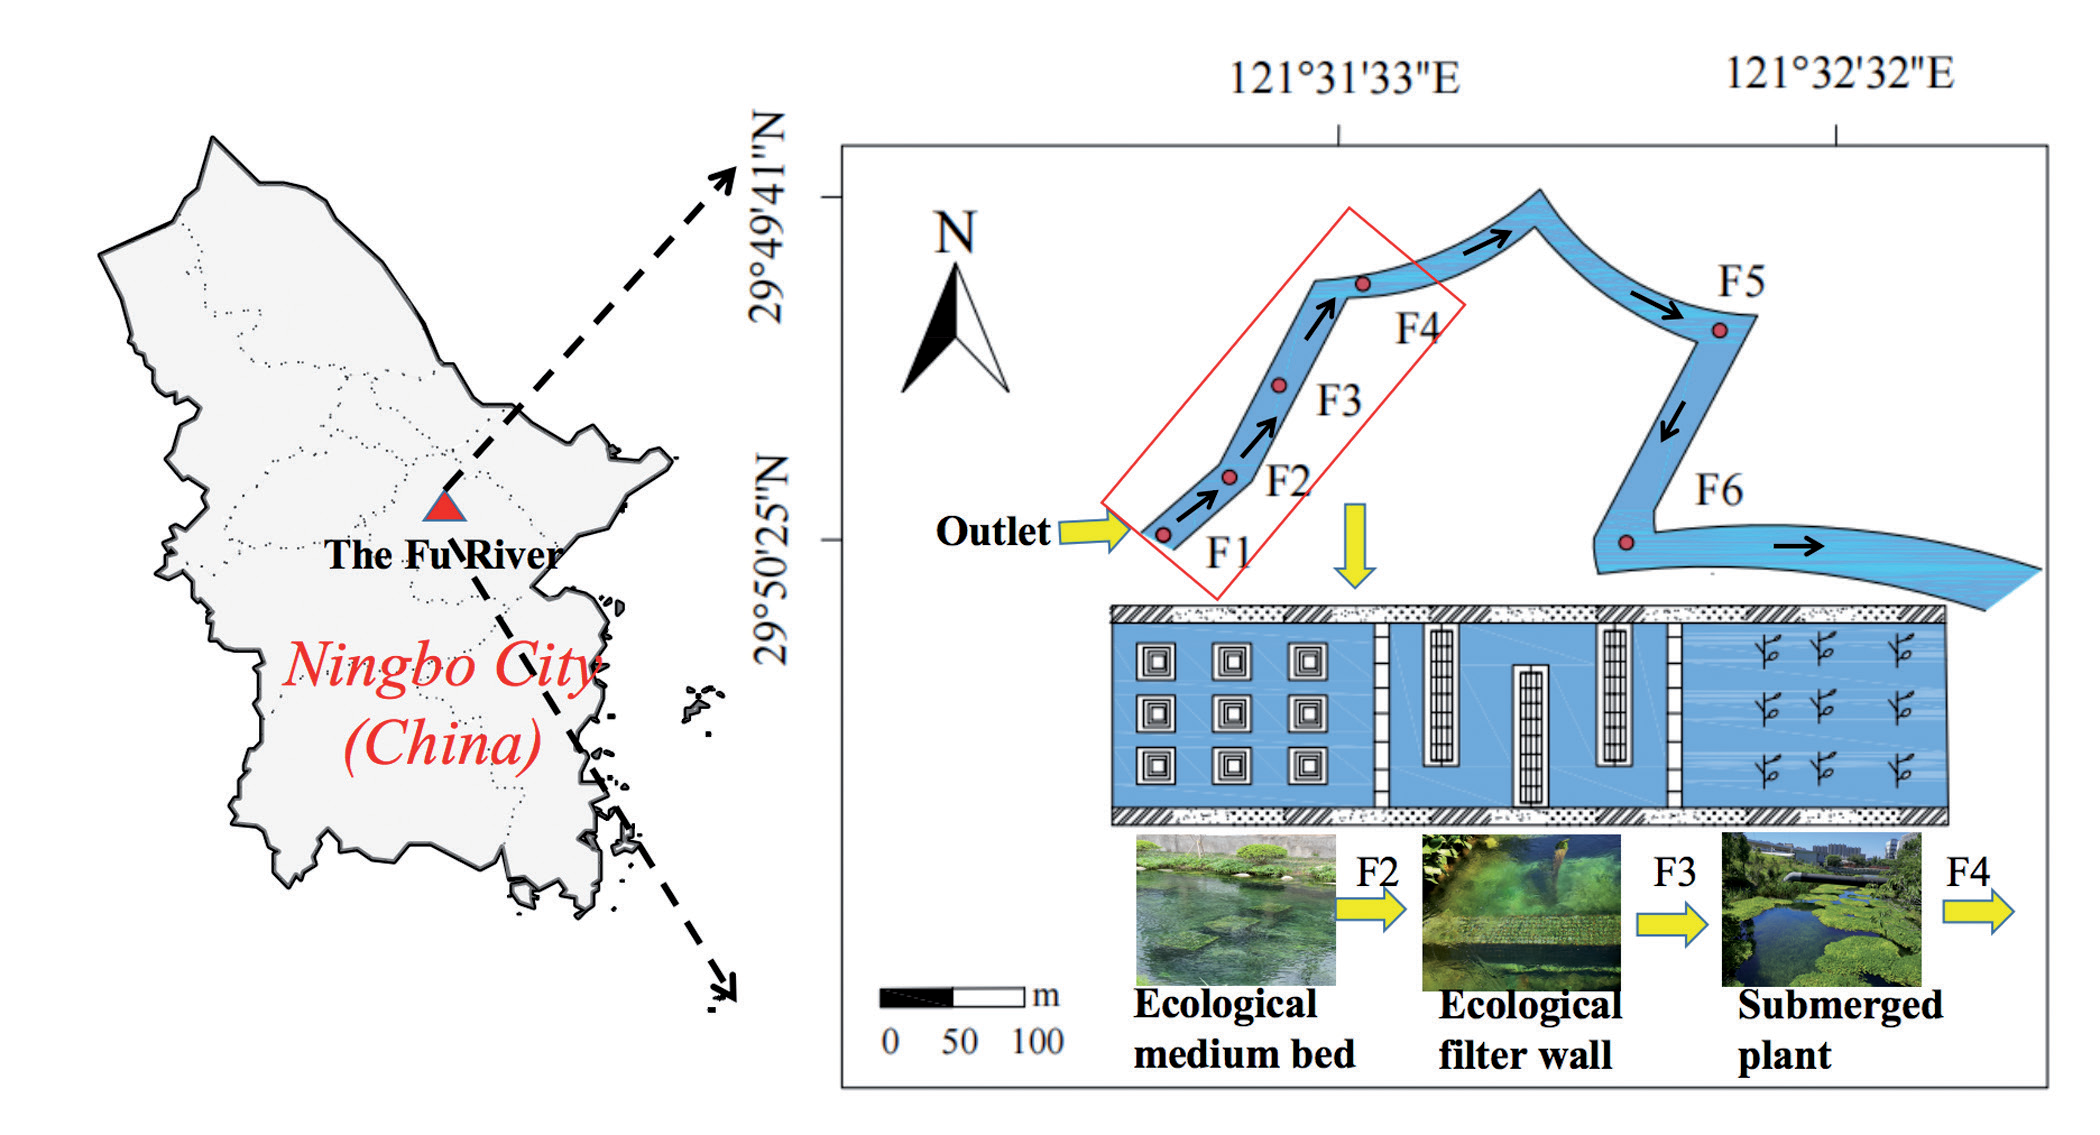
The aquatic ecosystem remediation engineering area is divided into three sections: the ecological medium bed section, the biological filter wall section, and the submerged plant section (Fig. 1).
1) The ecological medium bed is an “ecological medium bed module” composed of “volcanic stone + biological ceramite + polyurethane carrier”, and its specification size is 550 mm × 550 mm × 650 mm. As a microbial carrier, it has a high volume load and strong adaptability to sudden changes in water quality and quantity.
2) The biological filter wall is composed of granular biological fillers with different particle size distributions, with a water flow rate of 5000 tons/day, a controlled water level of 1.5 meters, and a filter wall specification of 8 m×0.7 m×0.8 m. Water flow can achieve microbial amplification and cultivation, as well as ecological purification of water quality through the bidirectional flow of seepage and flow reversal.
3) The submerged plant section was 200 m long and featured the cultivation of aquatic plants, including Ponderosa, Ellae, and Potamogeton crispus.
Considering that: (1)The ecological media beds play a crucial role in ensuring sufficient contact between sewage and fillers, exhibiting adaptability to sudden changes in the quality and quantity of reclaimed water caused by weather conditions. (2)The incorporation of biological filter walls focuses on reducing the high total nitrogen content often present in reclaimed water by utilizing dual-directional flow characteristics, including through-flow and deflected flow. (3)Submerged plants contribute to filtration, adsorption, decomposition, proliferation, and oxidation, showcasing comprehensive effects and enhancing the aesthetics and ecological diversity of the watercourse [22, 23]. The restoration mechanisms and approaches employed in this ecological restoration section align with commonly used techniques, providing representativeness while ensuring the quality and quantity of reclaimed water.
Sampling and Analysis
To comprehensively analyze and evaluate the environmental and ecological benefits of the urban river replenished with reclaimed water, three periods were selected to analyze the quality of the reclaimed water in the river: the dry season (March), the normal season (May), and the rainy season (August).
Collection and Determination of Water Quality Parameters
Water samples were collected using organic glass water samplers at a depth of 0.5 m from the water surface and promptly transported to the laboratory for analysis. Four parameters (chemical oxygen demand, ammonia nitrogen, total phosphorus, and total nitrogen) were determined according to the methods specified in the Water and Wastewater Monitoring and Analysis Methods (4th edition) [24]. The removal efficiency of the ecological restoration section was evaluated by calculating the changes in water quality parameters between the outlet (F4) and inlet (F1) of the ecological restoration section using the following formula:
Biological Acute Toxicity Detection and Analysis Methods
To reflect water quality using the ecological behavior and ability of organisms when the water quality is polluted or changed, biological toxicity assessment methods have the advantages of stable toxic reactions of tested organisms, easy availability of organisms, and easy cultivation and have become an important means of predicting and ensuring water quality safety [25]. Initially, a solid-phase extraction method was employed to concentrate toxic substances within the collected water samples. Subsequently, these concentrated substances were diluted to various multiples for biological acute toxicity experiments. This process aimed to determine the half inhibitory concentration (EC50 value) for each organism exposed to the toxic substances present in the water. The concentration multiple, denoted as “N,” represented the concentration at which half of the organisms exhibited inhibition. Three typical aquatic organisms of different trophic levels, including luminous bacteria, Chlorella, and Daphnia magnas, were selected for toxicity experiments according to ISO 11348, GB/ T-21805-2008, and GB/ T-13266, respectively. In addition to numerous advantages such as a fast reproduction rate, easy cultivation, low experimental costs, and sensitivity to toxins, these three types of organisms also belong to different trophic levels, making the research more comprehensive and representative [26].
Toxicity was evaluated using the toxicity unit grading method, which included the following steps [27]:
First, a biological toxicity test was conducted on the water quality, and the concentration of the water sample causing a half inhibitory effect was recorded as 1 TU (if the toxicity caused by the original water sample was greater than 50%, TU = [1 /(EC50)] ×100%; if the toxicity of raw water was low and the toxicity inhibition rate was less than 50%, the TU value was calculated as 50%.). Secondly, the TU of each biological toxicity was calculated by a comprehensive evaluation of multiple biological toxicities, and the average TU of multiple groups was the final TU value. Finally, the water quality was divided into five levels according to the TU values, as listed in Table 1. Detection and Analysis of Pathogenic Bacteria, ARGs,
and Drug-Resistant Bacteria
Pathogenic microorganisms mostly originate from human and animal feces; infect humans through diet, respiration, skin contact, and other means, and eventually cause intestinal and respiratory diseases. Therefore, it is particularly important to detect pathogenic bacteria, drug-resistant bacteria, and changes in ARGs in reclaimed water-rich urban rivers [28].
For pathogenic bacteria and ARGs, the collected water samples were transported back to the laboratory within 4 h, and the water samples were filtered using a filter device and filter cloth to remove large particles. Subsequently, the water sample was passed through a 0.22 µm filter membrane to extract the template DNA on the filter membrane and sent to Nanjing Paisenol Company for sequencing using Illumina 2X150bp. TRIMMOMATIC v0.39 software was used for quality control of metagenomic sequencing results. Low-quality sequences and adaptor sequences were removed, and human DNA contamination was removed using bmtagger v3.101-5 software. KrakenUniq v0.7.1 software was used to classify the microbial species and their associated abundance information, from which the pathogenic microorganisms were extracted based on an in-house list of pathogenic bacteria. ARGs-OAP v3.0 software was used to analyze drug resistance gene information in metagenomic samples.
For drug-resistant bacteria, water samples were returned to the laboratory 4 h later. The water samples underwent filtration with a sterile cloth to eliminate large particles. Subsequently, 100 µL of the filtered water sample was streaked onto LB agar dishes, each supplemented with ceftriaxone(64 μg/mL), ampicillin(32 μg/mL), streptomycin(64 μg/mL), gentamicin(16 μg/ mL), and ciprofloxacin(8 μg/mL), respectively. They were incubated at 37℃ overnight, and the number of colonies was counted. Differences in pathogenic and drug-resistant bacteria among the samples from the three seasons were analyzed using principal component analysis (PCA).
Then CANOCO 5.0 was used to conduct miscellaneous analyses of pathogenic bacteria, drug-resistant bacteria, and four environmental factors to analyze the correlation between them. First, the relative abundances of pathogenic and resistant bacteria were analyzed by DCA (detrended correspondence analysis (DCA). According to the analysis results (i.e., the analysis type was determined according to the longest length of axis 1). Canonical correspondence analysis (CCA) is used when it is greater than four, redundancy analysis (RDA) is used when it is less than three, and both can be used when it is between three and four); redundancy analysis (RDA) or CCA is selected [29].
Results and Discussion
Water Quality Parameters
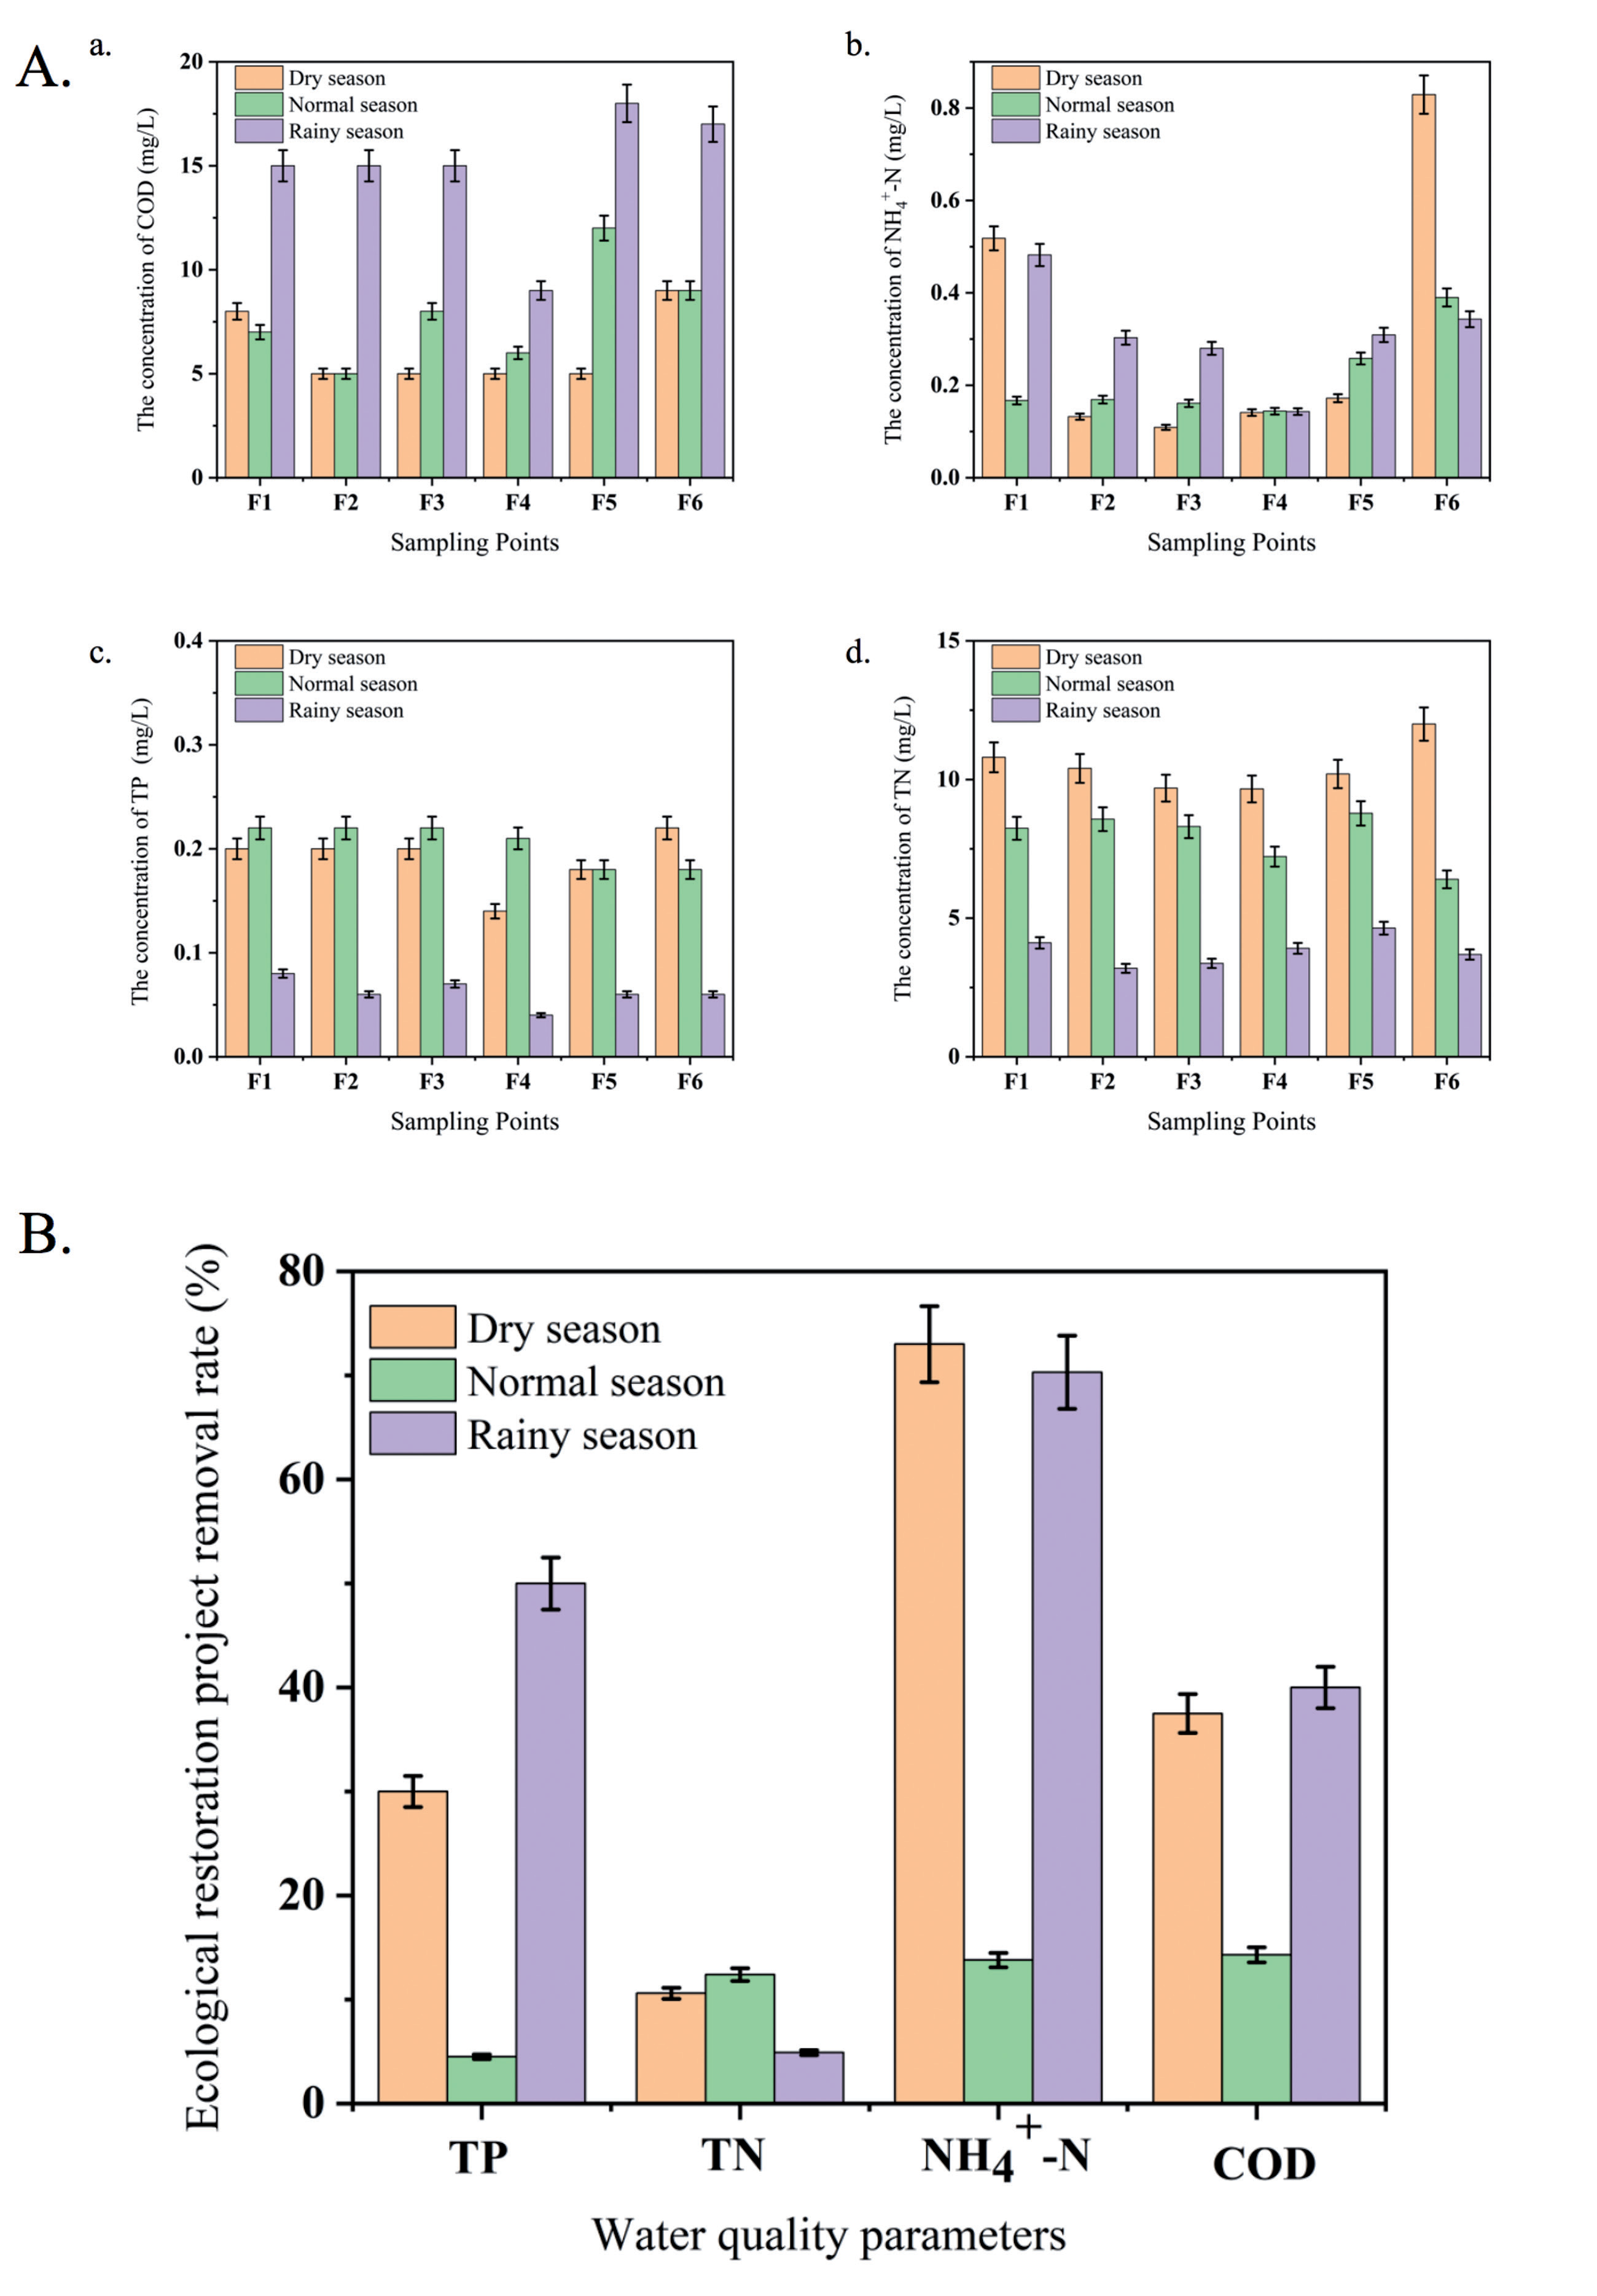
As shown in Fig.2A, from a temporal perspective, with the replenishment of reclaimed water, the concentrations of TN, TP, and NH4+-N, but not COD, fluctuated slightly in different seasons. The COD concentrations in the dry and normal seasons remained stable, whereas the COD concentration in the rainy season showed an increasing trend. This is due to the influence of heavy rainfall caused by typhoon weather, the large influx of organic matter such as road surfaces into the river, and the decomposition of organisms, which leads to an increasing trend of COD values [30, 31].
From a spatial perspective along the river flow, TN, TP, COD, and NH4+-N generally exhibit an initial decline followed by an increase. This phenomenon arises from the ecological medium bed and ecological filter wall in the aquatic ecosystem remediation engineering area, which serve as microbial carriers. The biofilm generated by these elements manifests a multifaceted impact encompassing filtration, adsorption, decomposition, proliferation, and oxidation. Aquatic river plants play an important role in filtering and purifying nitrogen, phosphorus, and other substances [32, 33]. As the reclaimed water leaves the ecological restoration section, the radiation effect of the reclaimed water is weakened, and the influence of the receiving water and surrounding pollution sources increases, leading to an increase in various indicators. The establishment of an aquatic ecosystem remediation engineering area has a positive effect on the improvement of conventional indicators of reclaimed water. In particular, during the rainy season, when the pollutant concentration easily increases greatly, as shown in Fig. 2B, the removal rates of TP, NH4+-N, and COD in the reclaimed water in the aquatic ecosystem remediation engineering area are as high as 50%, 70%, and 40%, respectively, which not only reduces the ecological risk of the reclaimed water but also greatly improves the scope of influence of the reclaimed water.
Biological Acute Toxicity
Among the three tested organisms (Fig. 3), Daphnia magnas was the most sensitive to toxic substances in the regenerated water, with toxic equivalents between 8.67 and 14.47 N. The toxic equivalent of chlorella was 79.14 ~ 127.22 N, but the aquatic ecosystem remediation engineering area has the best restoration effect.
Temporally, the toxic equivalents of the three organisms initially increased and then decreased. This was mainly due to poor water quality, high organic content, and incomplete growth of aquatic plants in the dry season, which resulted in insufficient self-purification capacity of aquatic ecosystem remediation engineering areas and rivers and a high toxic equivalent. As the climate changed, aquatic plants flourished more during the off-season, enhancing the river’s self-purification capacity. Consequently, the toxic equivalent of the tested organisms increased, with chlorella exhibiting the most notable change. Specifically, the toxic equivalent of chlorella increased from 79.14 N and 101.49 N before the ecological restoration stage to 81.18 N and 127.22 N after the restoration. During the rainy season, with an increase in rainfall, a large number of organic pollutants from the road surface flowed into the river, thus reducing the toxic equivalent of each tested organism.
Fig. 3.
Inhibition of water samples on tested organisms. A. Inhibition of Daphnia magna by water samples. B. Inhibition of luminescent bacteria by water samples. C. Inhibition of Chlorella by water samples.
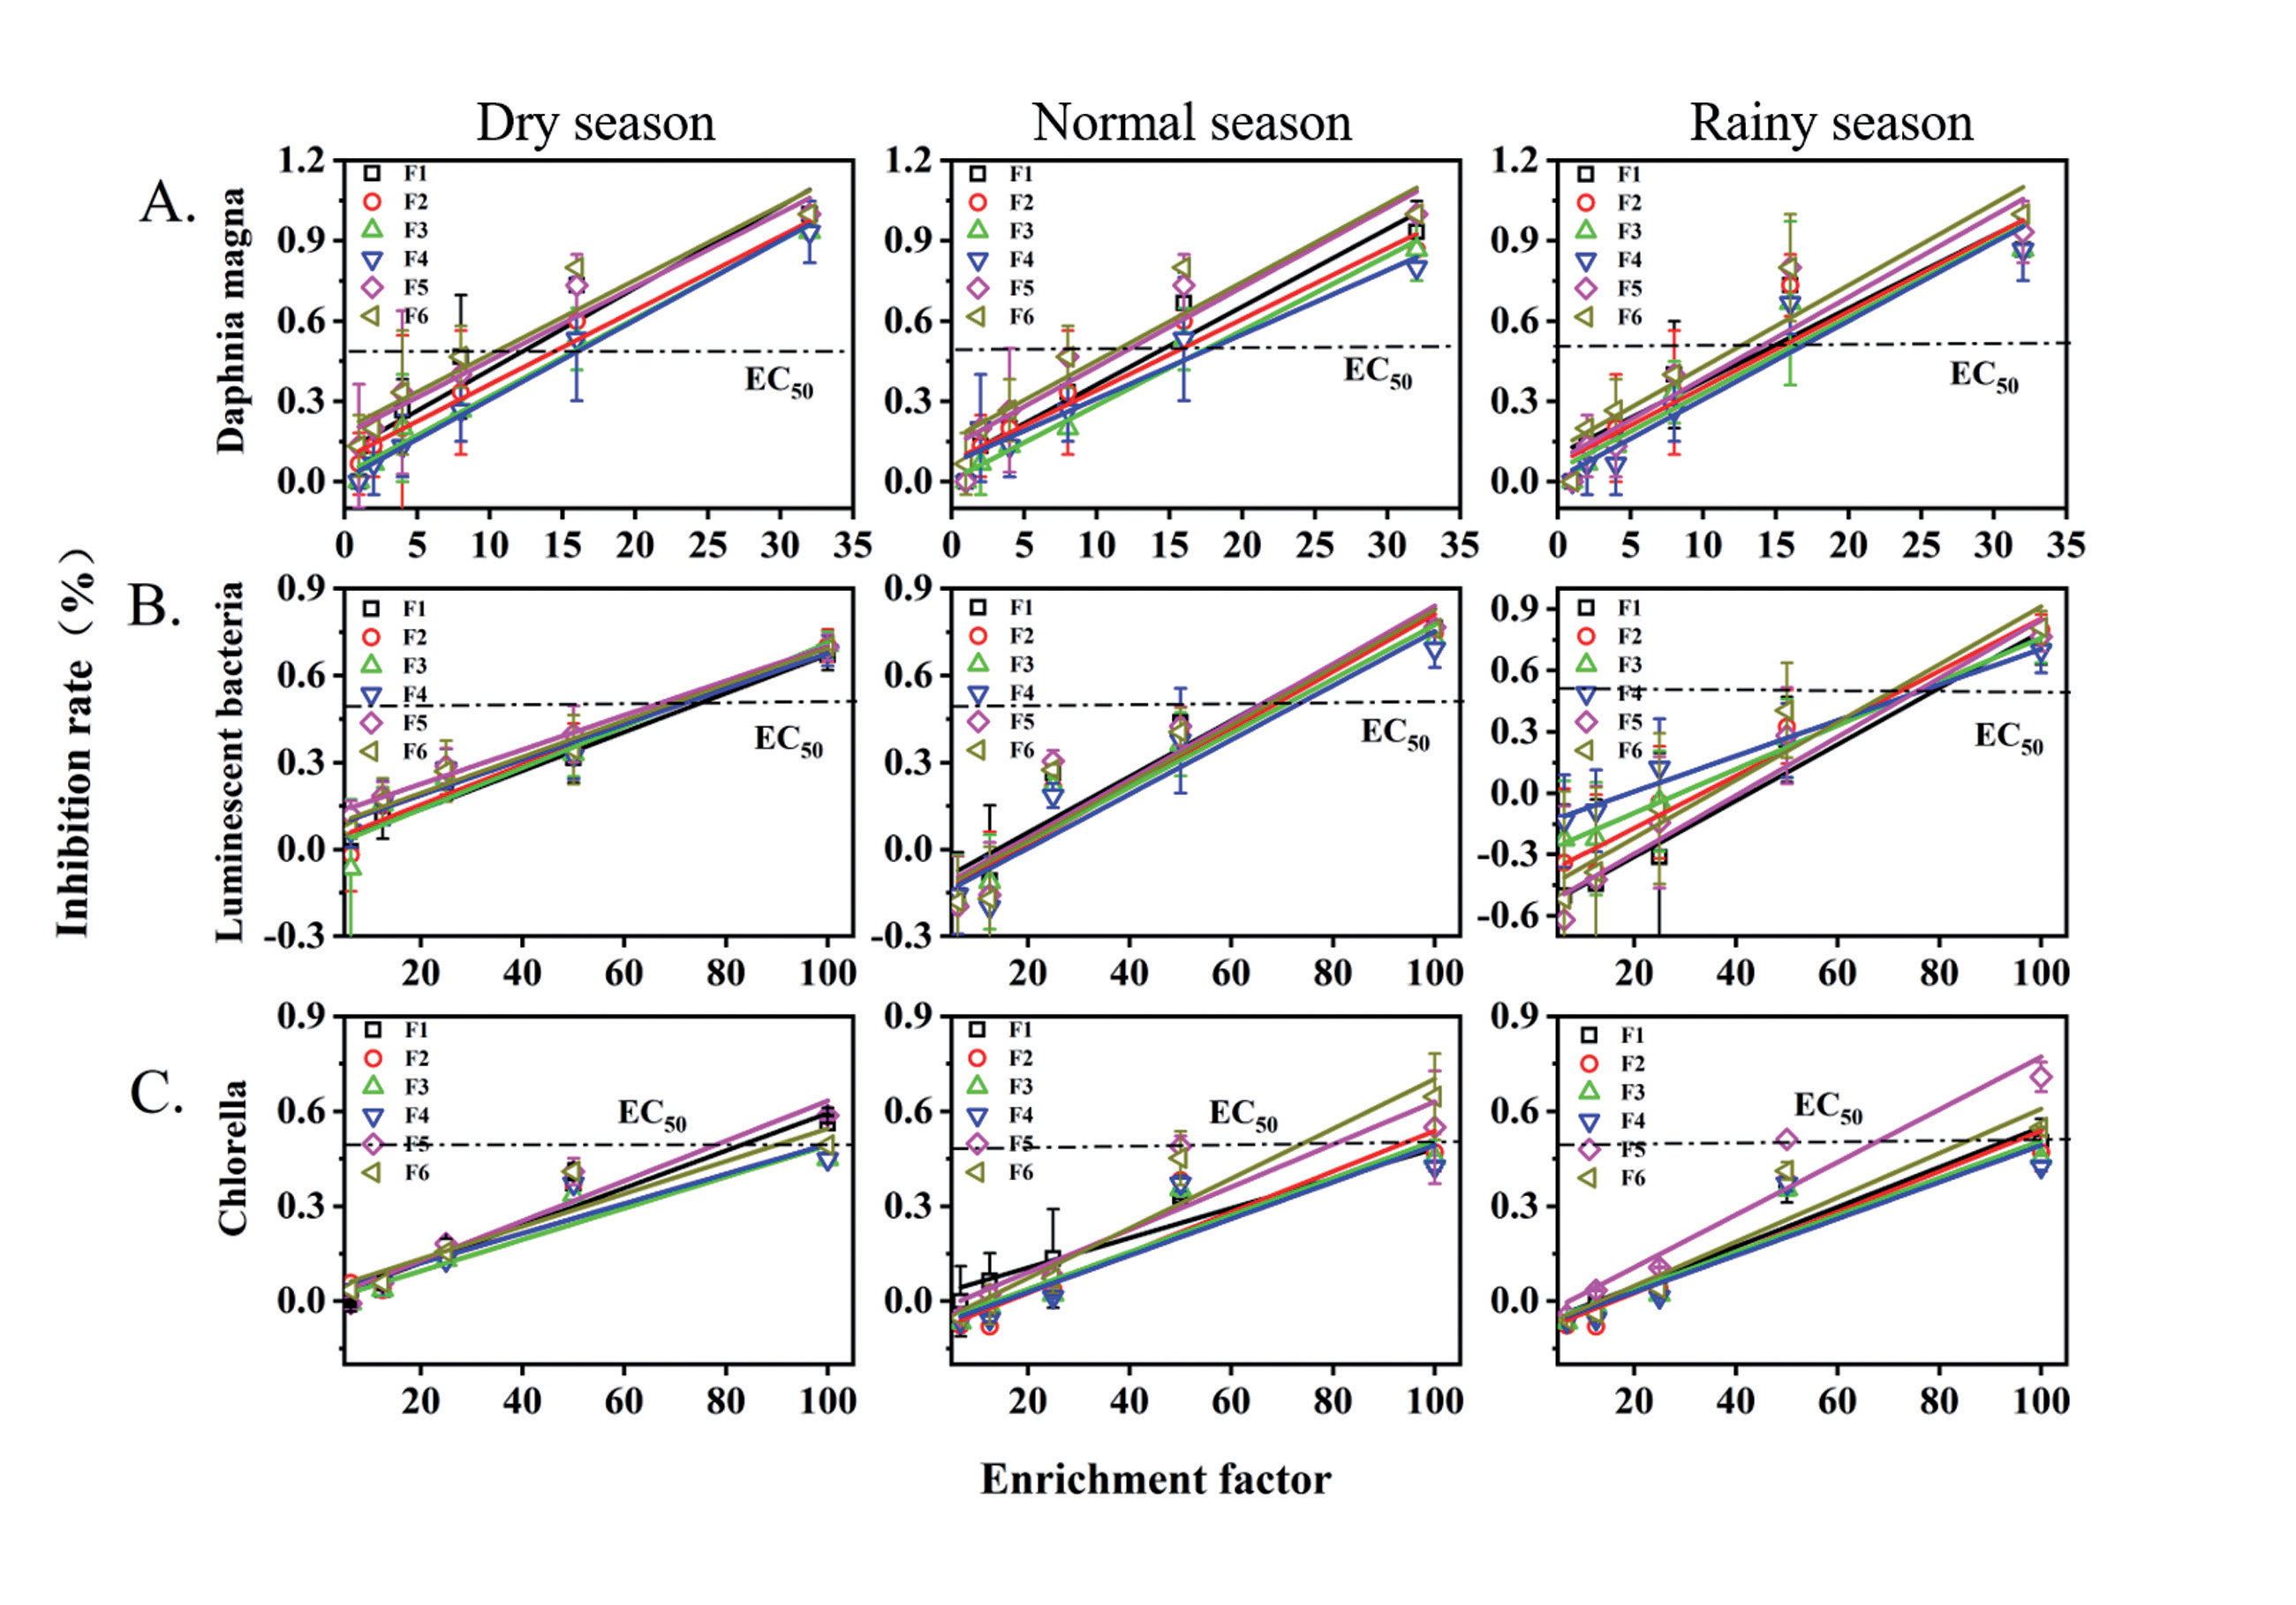
From a spatial perspective, the overall toxic equivalent showed a trend of first increasing and then decreasing. Among them, the toxicity at effluent point F1 was higher than that at the other points. With the reclaimed water passing through the aquatic ecosystem remediation engineering area, the three types of biological toxicity were reduced to a certain extent. In the dry season, for example, its EC50 changes from 62.70、79.14、8.67 N in F1 to 67.64、101.49、14.47 N in F4, indicating that the effluent from the reclaimed water plant has certain toxicity to a certain extent, and the aquatic ecosystem remediation engineering area has a better removal effect on biological toxicity. After the reclaimed water passed through the aquatic ecosystem restoration project area, the biological toxicity to the three types of organisms was lower than that of the original water. By comparing the EC50 of F1 and F2, it can be observed that after the ecological medium bed treatment, the biological toxicity of water samples is greatly reduced, and the toxic equivalents of luminescent bacteria, Chlorella, and Daphnia magnas are the most obvious in the rainy season, increasing from 62.12 °N, 81.18, and 11.67 N to 66.97, 105.95, and 12.59 N, respectively. Upon comparing the data for F2 and F3, a discernible increase in the toxic equivalent of various organisms, particularly chlorella, is evident. Chlorella’s EC50 value has risen by approximately 20 N. This shift is primarily attributed to the bidirectional flow and penetration facilitated by the biofilter wall. It can further achieve the effects of microbial expansion culture and ecological purification of water quality [34]. The reduction of organic matter, such as disinfection byproducts in water, is also more conducive to the growth and reproduction of algae. After further absorption and decomposition by submerged plants [35], the toxic equivalent of each organism in F4 slightly increased compared to that in F3, ranging from 1 to 4 N. After the reclaimed water passed through the ecological restoration section, the toxic equivalent of each organism showed a downward trend of different degrees, and the rate of decrease was small within a short distance, indicating that the organic matter that was more toxic to aquatic organisms was the disinfection byproduct after the reclaimed water was discharged. The aquatic ecosystem remediation engineering area effectively reduced the concentration of such pollutants and improved the safety of the urban river replenished with reclaimed water.
Table 2.
TU value of water samples in each season
From the TU value of each point (Table 2), the ecological risk of the urban river replenished with reclaimed water was low overall, and the TU values were less than 0.4, indicating no acute toxicity. Therefore, the establishment of an aquatic ecosystem remediation engineering area can further reduce the TU value of water, greatly improving the quality and influence range of the replenishment water.
Pathogenic Bacteria, Drug-Resistant Bacteria, and ARGs
A total of 1301 pathogenic bacterial species were identified in this analysis. The PCA results for the pathogenic bacterial communities during the three sampling periods are shown in Fig. 4A. The first two principal components (PCs) explained 68.8% of the total variance in the ARGs, with PC1 explaining 58.8% of the total variance. The samples from the dry and normal seasons were distributed in the middle and upper parts of the PCA plot, whereas those from the rainy season were distributed in the middle and lower parts. These findings indicate that the structural distribution of the pathogenic bacterial community in the dry and normal seasons was similar, whereas the rainy season exhibited certain differences compared to the other two seasons. The greatest differences were observed at distant locations such as F5 and F6 during the rainy season. This can be attributed to the high temperatures in Ningbo City during the summer, which promote the proliferation of microorganisms in the water. Previous studies have shown that summer is the peak period of microbial growth. Endotoxins carried by these pathogenic bacteria can enter the human body through respiration and other pathways, leading to adverse reactions such as fever, asthma, hypotension, fainting, and even death [36].
Research indicates that dissolved organic matter (DOM) in water during the rainy season enhances the adsorption of pathogenic bacteria, thereby facilitating their growth and proliferation [37]. Fig. 4B shows the variations in several pathogenic bacterial species with significant changes in abundance. These results indicate a gradual increase in the content of pathogenic bacteria along the river. The pathogenic bacterial content in the reclaimed water used for river replenishment was the lowest, suggesting a lower microbial risk associated with reclaimed water. As the river extended, the degree of contamination gradually increased, and the content of pathogenic bacteria in the water showed an upward trend. The highest content of pathogenic bacteria was observed in the water flowing through the residential area. Observations reveal that local residents utilize river water for daily activities, including washing, and engage in instances of waste disposal and wastewater dumping. These activities not only serve as potential sources of pathogenic microorganisms but also contribute to the proliferation of pathogenic bacteria through water eutrophication. However, by comparing the data from the ecological restoration sections (F1, F2, F3, and F4) and the distant replenishment sections (F5 and F6), it can be observed that the increase in pathogenic bacteria content in the ecological restoration section was significantly slower than the growth rate in the distant replenishment section. Acinetobacter baumannii, Acidovorax citrulli, and Pseudomonas alcaligenes showed an initial decreasing trend, followed by an increase along the river. This suggests that the establishment of a front-end ecological restoration section can influence the growth and reproduction of certain pathogenic bacteria.
Fig. 4.
A. The pathogenic bacteria PCA varied across different seasons. B. Relative abundance of pathogenic bacteria.
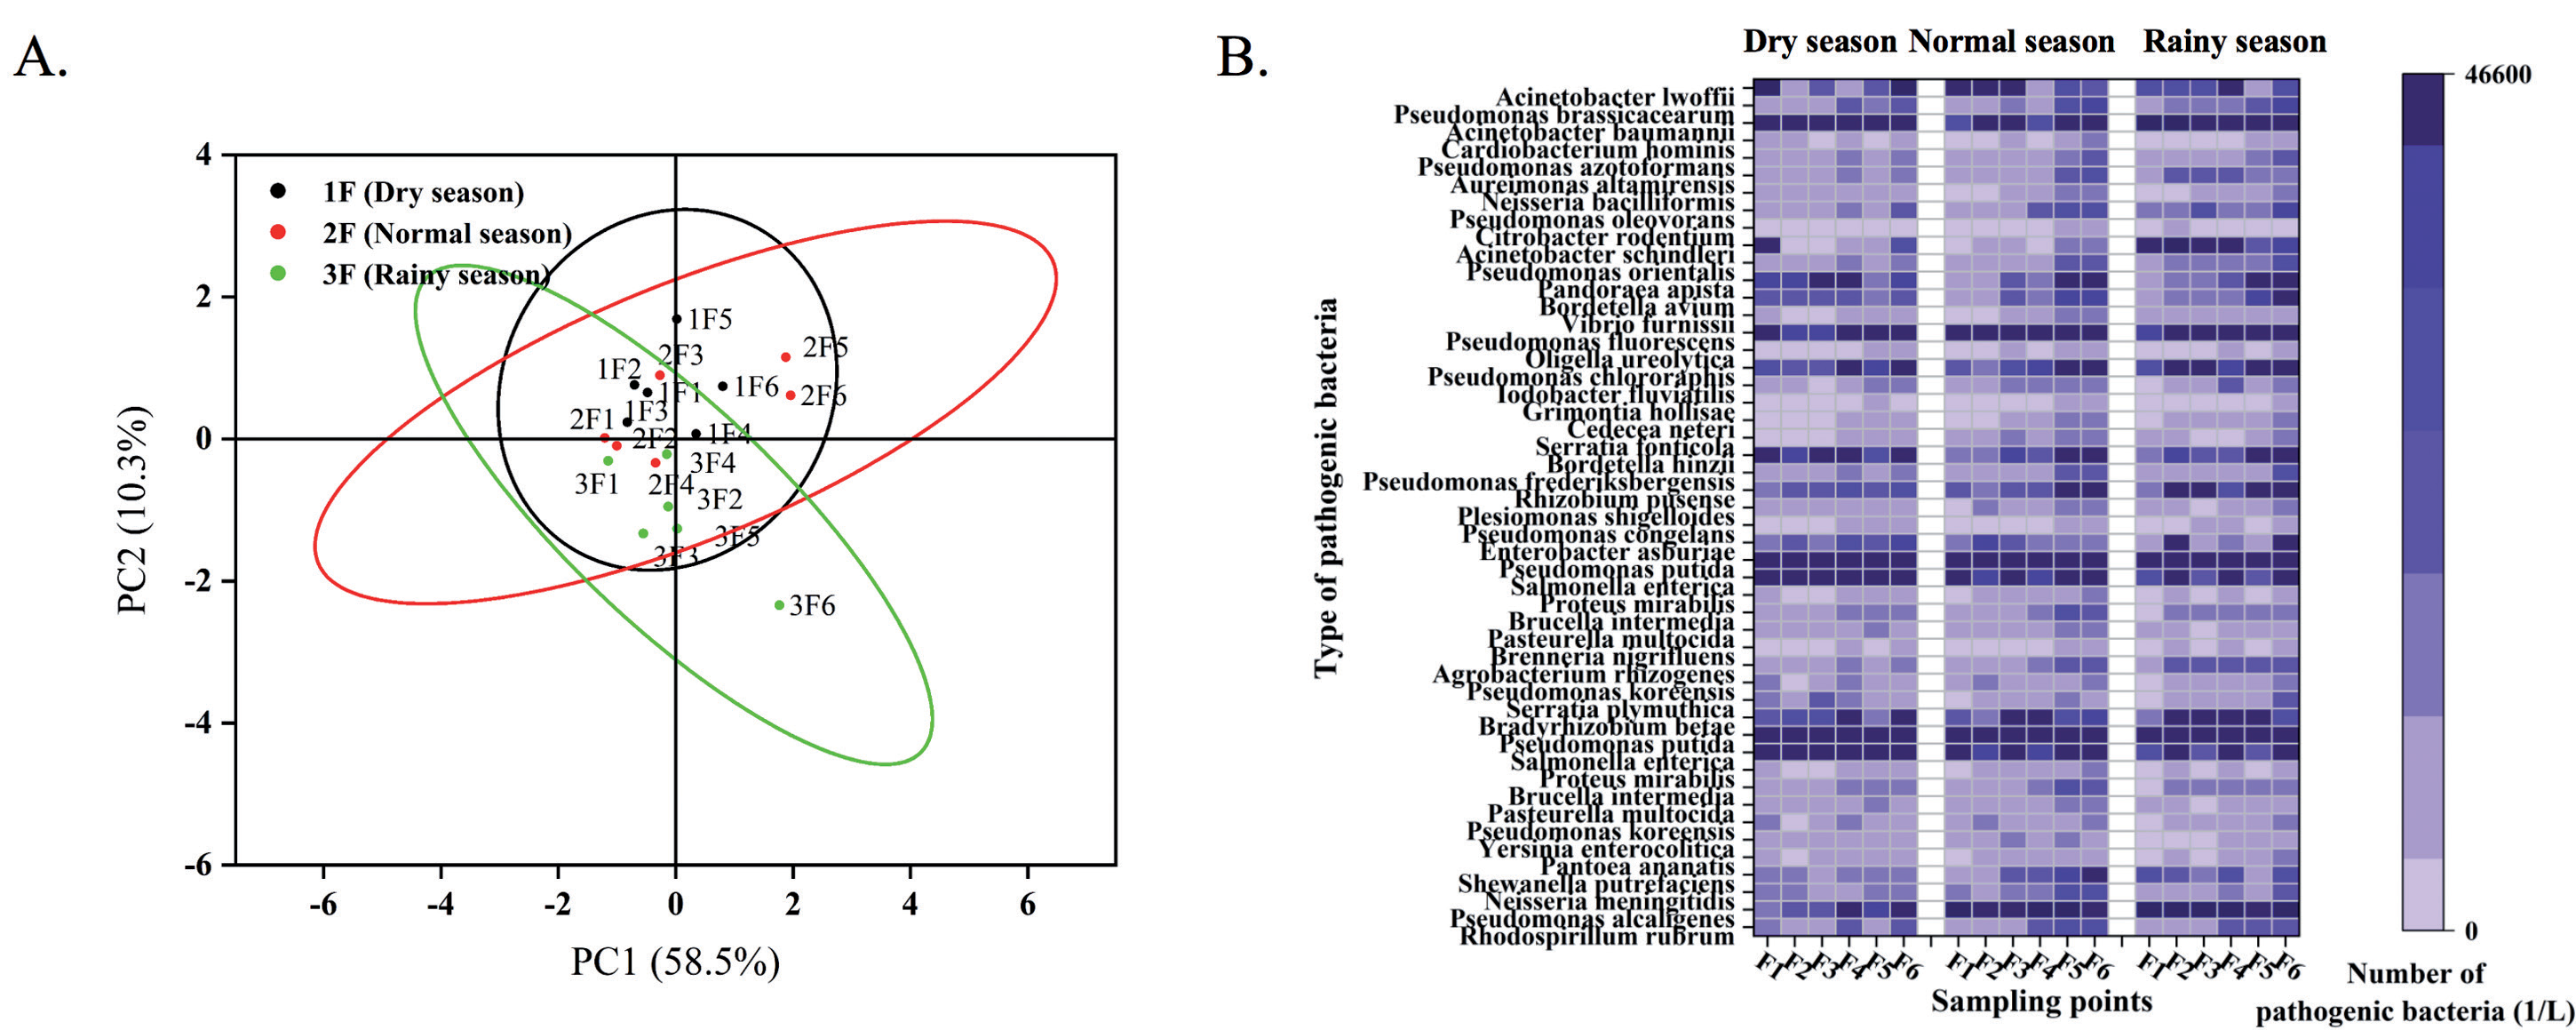
Fig. 5.
A. The drug-resistant bacteria PCA varied across different seasons. B. Relative abundance of drug-resistant bacteria.
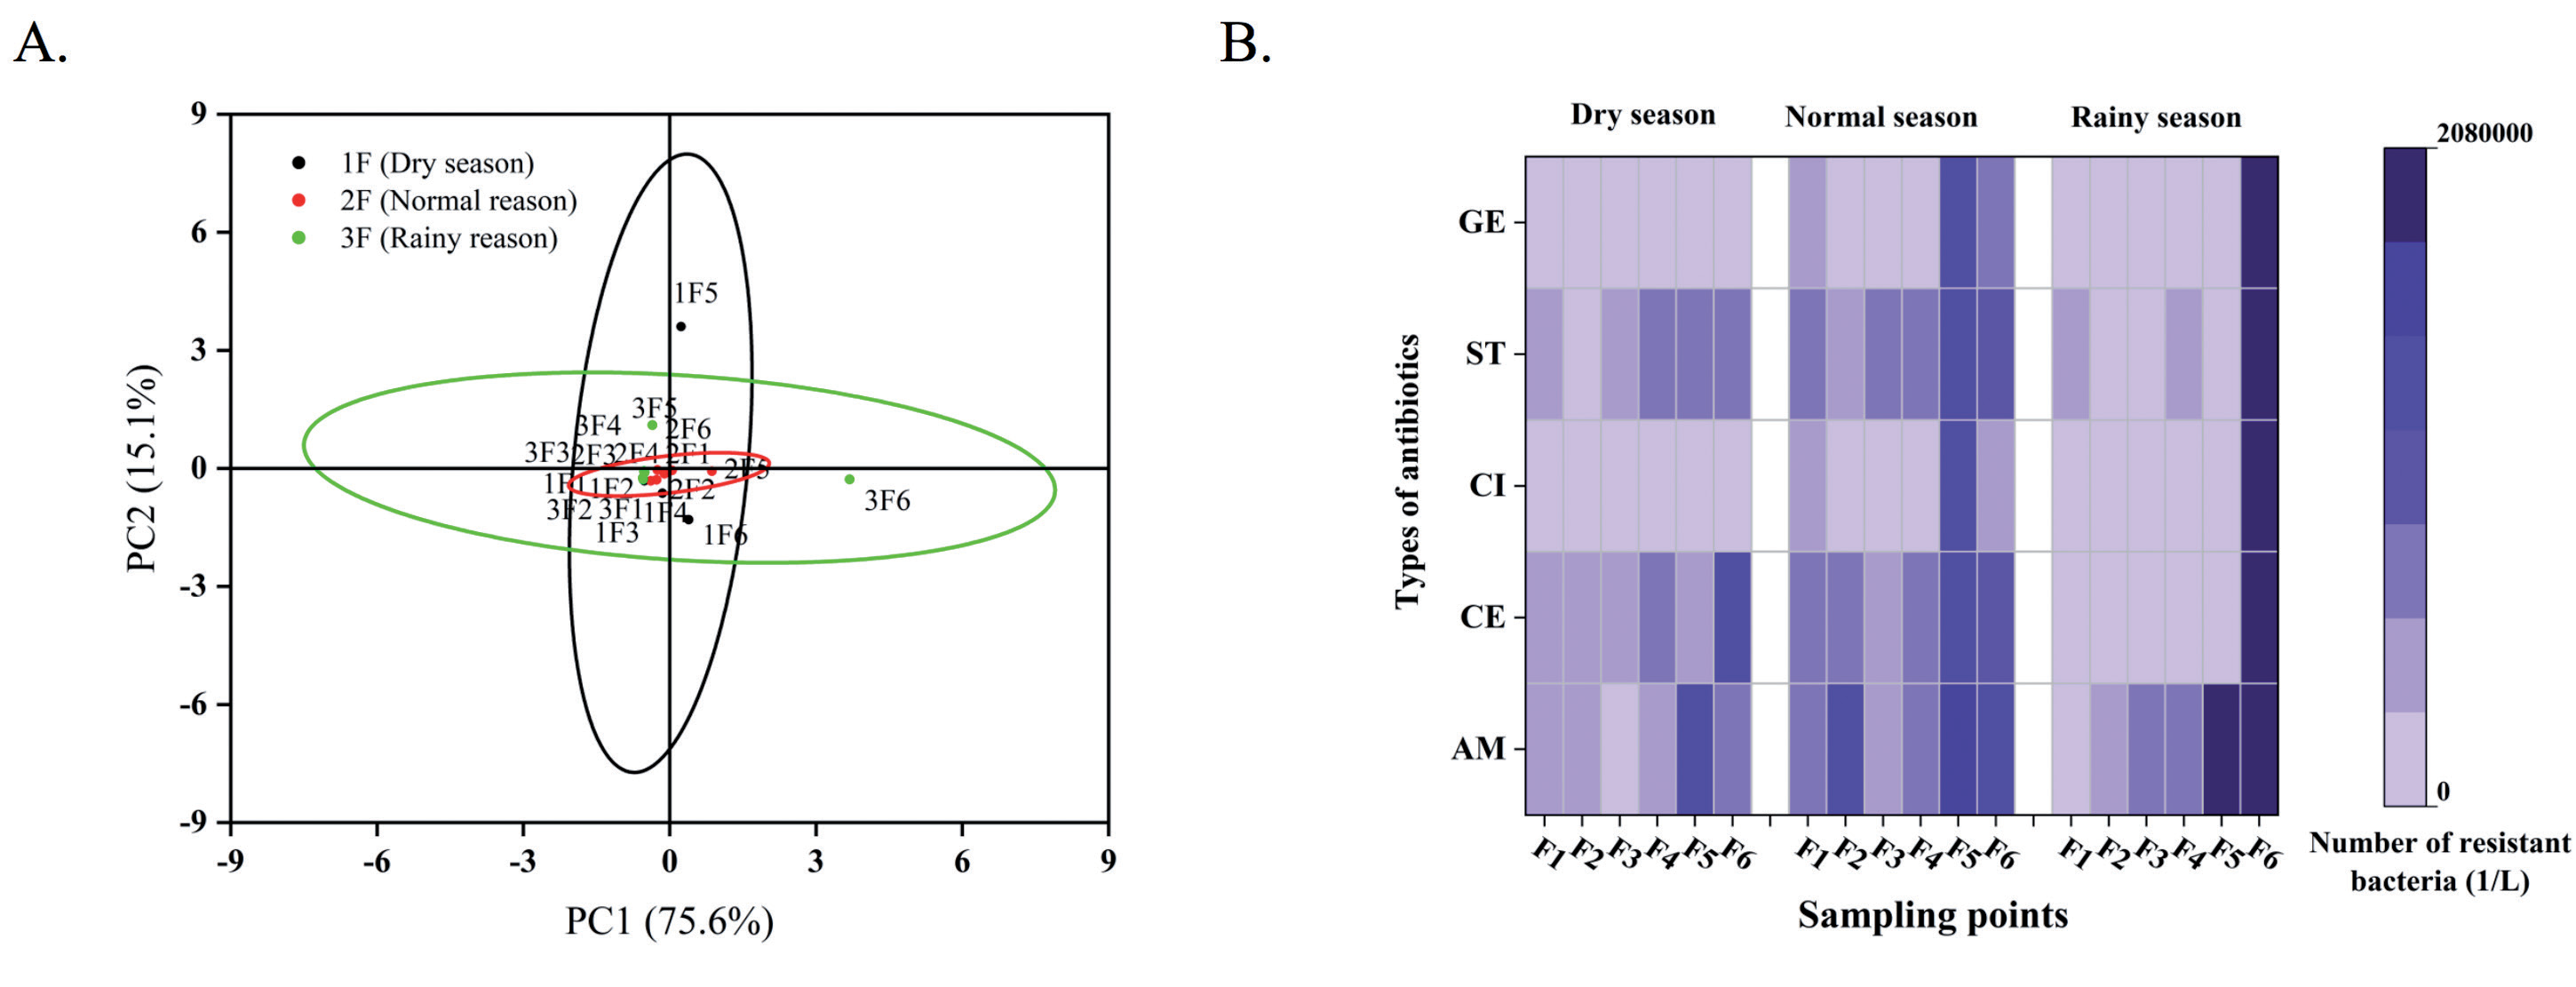
As shown in Fig. 5A, the PCA results of the antibiotic-resistant bacterial community showed that samples from the dry and normal seasons were distributed in the middle and upper parts of the PCA plot, whereas samples from the rainy season were distributed in the middle and lower parts of the PCA plot. Samples from the three seasons were mainly concentrated in the middle of the PCA plot, indicating that the distribution of the antibiotic-resistant bacterial community structure in the three seasons was similar and relatively unaffected by seasonal changes. However, a few sampling points were also distributed in both the upper and lower parts of the plot, with the most obvious being the F5 sampling point in the dry season and the F6 sampling point in the rainy season, indicating the occurrence of pollutant inflow in the distant section, such as the dumping of domestic wastewater by local residents.
As shown in Fig. 5B, all the sampling points along the river carried a large number of antibiotic-resistant bacteria, showing a general decreasing and then increasing trend. From a temporal perspective, the antibiotic-resistant bacterial content during the normal season was relatively high, possibly because of the increase in bacterial content in the water as the temperature increased with the advent of summer, leading to more severe antibiotic-resistant bacterial contamination. In the rainy season, owing to the influence of the flood season and typhoon weather, river flow and flow velocity increased, which had a dilution effect on the antibiotic-resistant bacteria in the river, resulting in a decrease in their content [38, 39]. At the same time, by observing the data from the rainy season, it can be found that the distant water body is relatively heavily contaminated with antibiotic-resistant bacteria, whereas the water body in the ecological restoration section can maintain a relatively safe and stable state compared to the distant water body. Therefore, it indicates that the establishment of the ecological restoration section can greatly alleviate the problem of antibiotic-resistant bacterial contamination in the reclaimed water replenishment of the river caused by the increase in temperature due to seasonal changes.
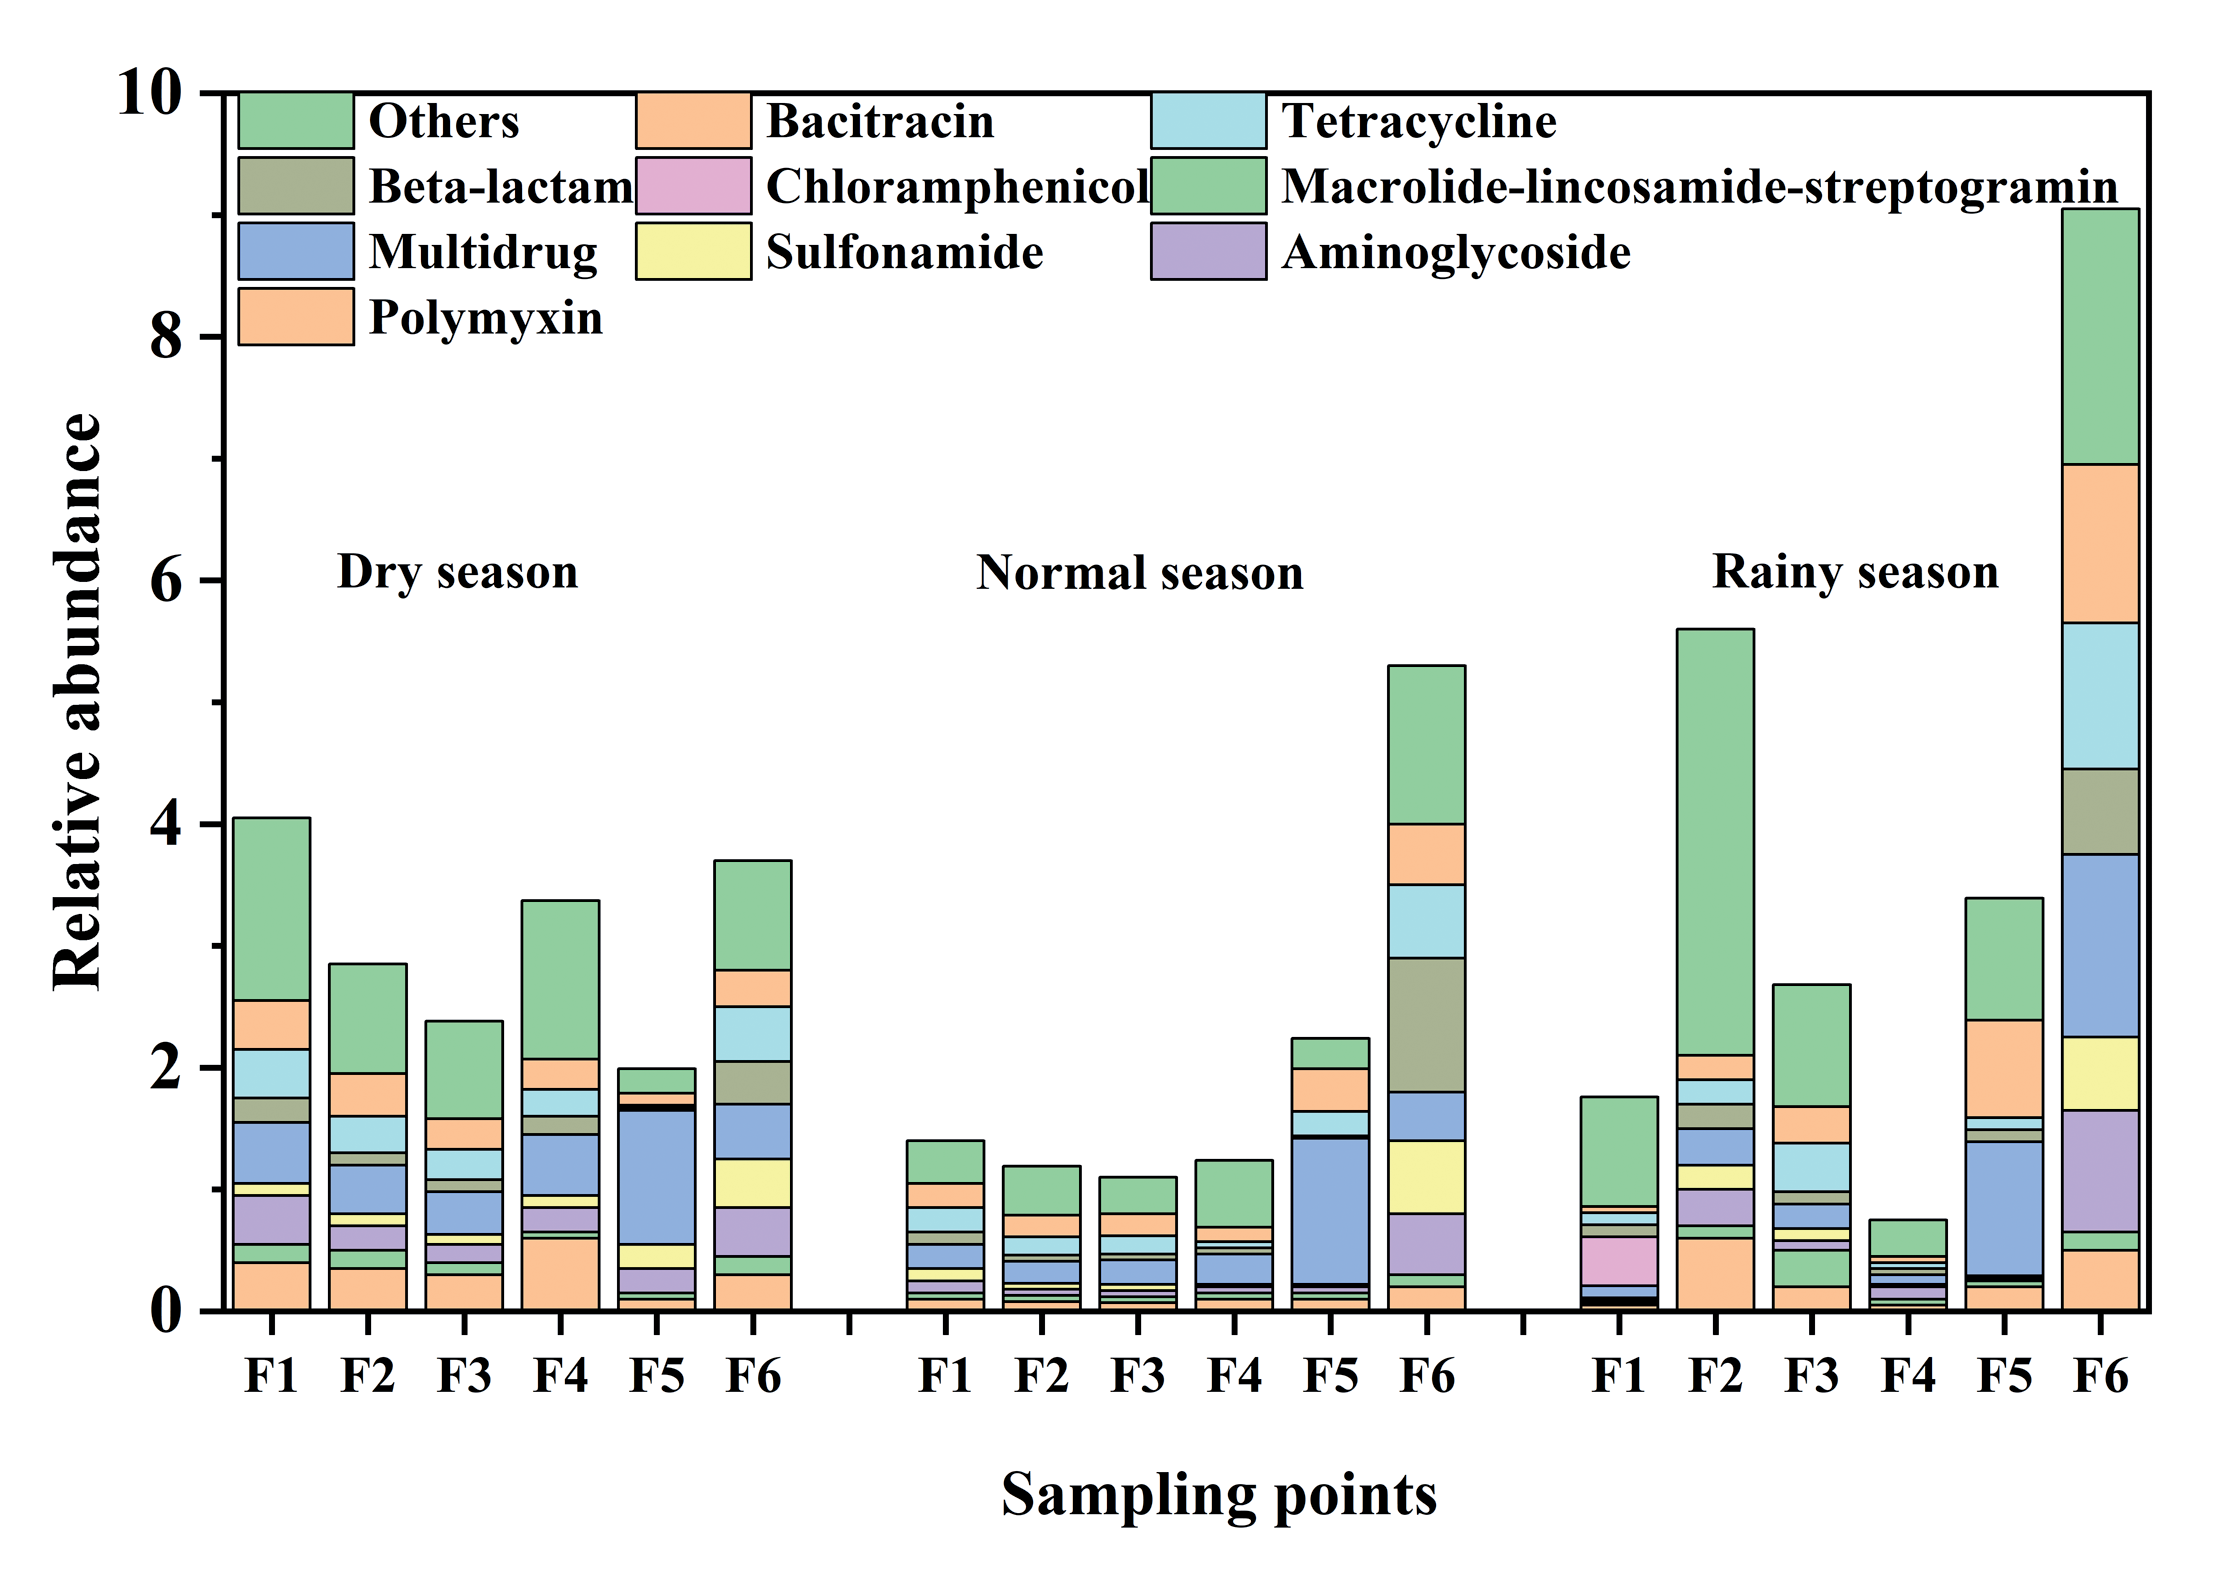
As observed in Fig. 6, similar to drug-resistant bacteria, the concentrations of aminoglycosides, macrolide-lincosamide-streptogramin, and other ARGs generally exhibited a downward trend, followed by an upward trend. However, the concentration of drug-resistant genes during the dry season was higher than that on the other two occasions, which may be due to the disturbance caused by the initiation of the water replenishment project on the sedimentary microbiota, leading to the entry of drug-resistant microorganisms into the water [27]. Alternatively, this could be attributed to contamination of the reclaimed water source by drug-resistant bacteria, resulting in an increase in the content of ARGs in the water affected by reclaimed water replenishment [40]. However, the regulatory effect of the ecological restoration led to a decrease in the concentration of ARGs in all seasons. As temperatures rise, the concentration of Antibiotic Resistance Genes (ARGs) during the rainy season surpasses that of the normal season. Elevated temperatures foster bacterial growth, intensifying the frequency of binding and transformation of ARGs with bacteria. This phenomenon accelerates the spread and migration of ARGs [41]. The sudden increase in the concentration of ARGs at point F2 during the rainy season may be due to the influence of typhoon rainfall, during which pollutants from nearby factories and wastewater sources enter rivers, resulting in an increase in the concentration of ARGs. However, subsequent ecological restoration quickly controlled the concentration of ARGs, indicating that the establishment of the ecological restoration section can not only reduce the concentration of ARGs in reclaimed water, but also respond to sudden increases in ARGs. Correlation Analysis of Pathogenic Bacteria and Drug-
Resistant Bacteria with Water Quality Parameters
As shown in Fig.7A, the first two axes explained 81.12% of the variation in the antibiotic-resistant bacterial community structure (RDA 1) and 9.82% (RDA 2), indicating that the selected water quality factors affected the pathogenic bacterial community in the reclaimed river water. Among the pathogenic bacteria, strains such as Acinetobacter lwoffii, Acinetobacter schindleri, Acinetobacter baumannii, Acidovorax citrulli, and Pseudomonas alcaligenes show a strong correlation with NH4+-N and TN. Acidovorax citrulli is a plant pathogen that can severely affect aquatic plants [42], and a high content of Pseudomonas alcaligenes is associated with blood infections [43]. Additionally, except for F3, the other sampling sites showed a close connection with various pathogenic bacterial strains, which further indicated that the establishment of the ecological restoration section improved water quality to some extent, inhibiting the growth of pathogenic bacteria. After entering the submerged plant zone, species richness increased. However, individual plants showed signs of decay and death, thereby promoting the growth of a small number of pathogenic microorganisms. Overall, the ecological restoration section showed good removal effects on pollutants such as NH4+-N, TN, and TP in the river, which can greatly improve the water environment and create an environment unfavorable for the growth and reproduction of pathogenic microorganisms, thus providing a good guarantee of water quality for reclaimed water replenishment in the river. Therefore, the establishment of an ecological restoration section can reduce both river pollution and the health risks posed by pathogenic bacteria.
Fig. 7.
Redundancy analysis of pathogenic bacteria, drug-resistant bacteria, and environmental factors (A. Redundancy analysis of pathogenic bacteria and environmental factors. B. Redundancy analysis of drug-resistant bacteria and environmental factors).
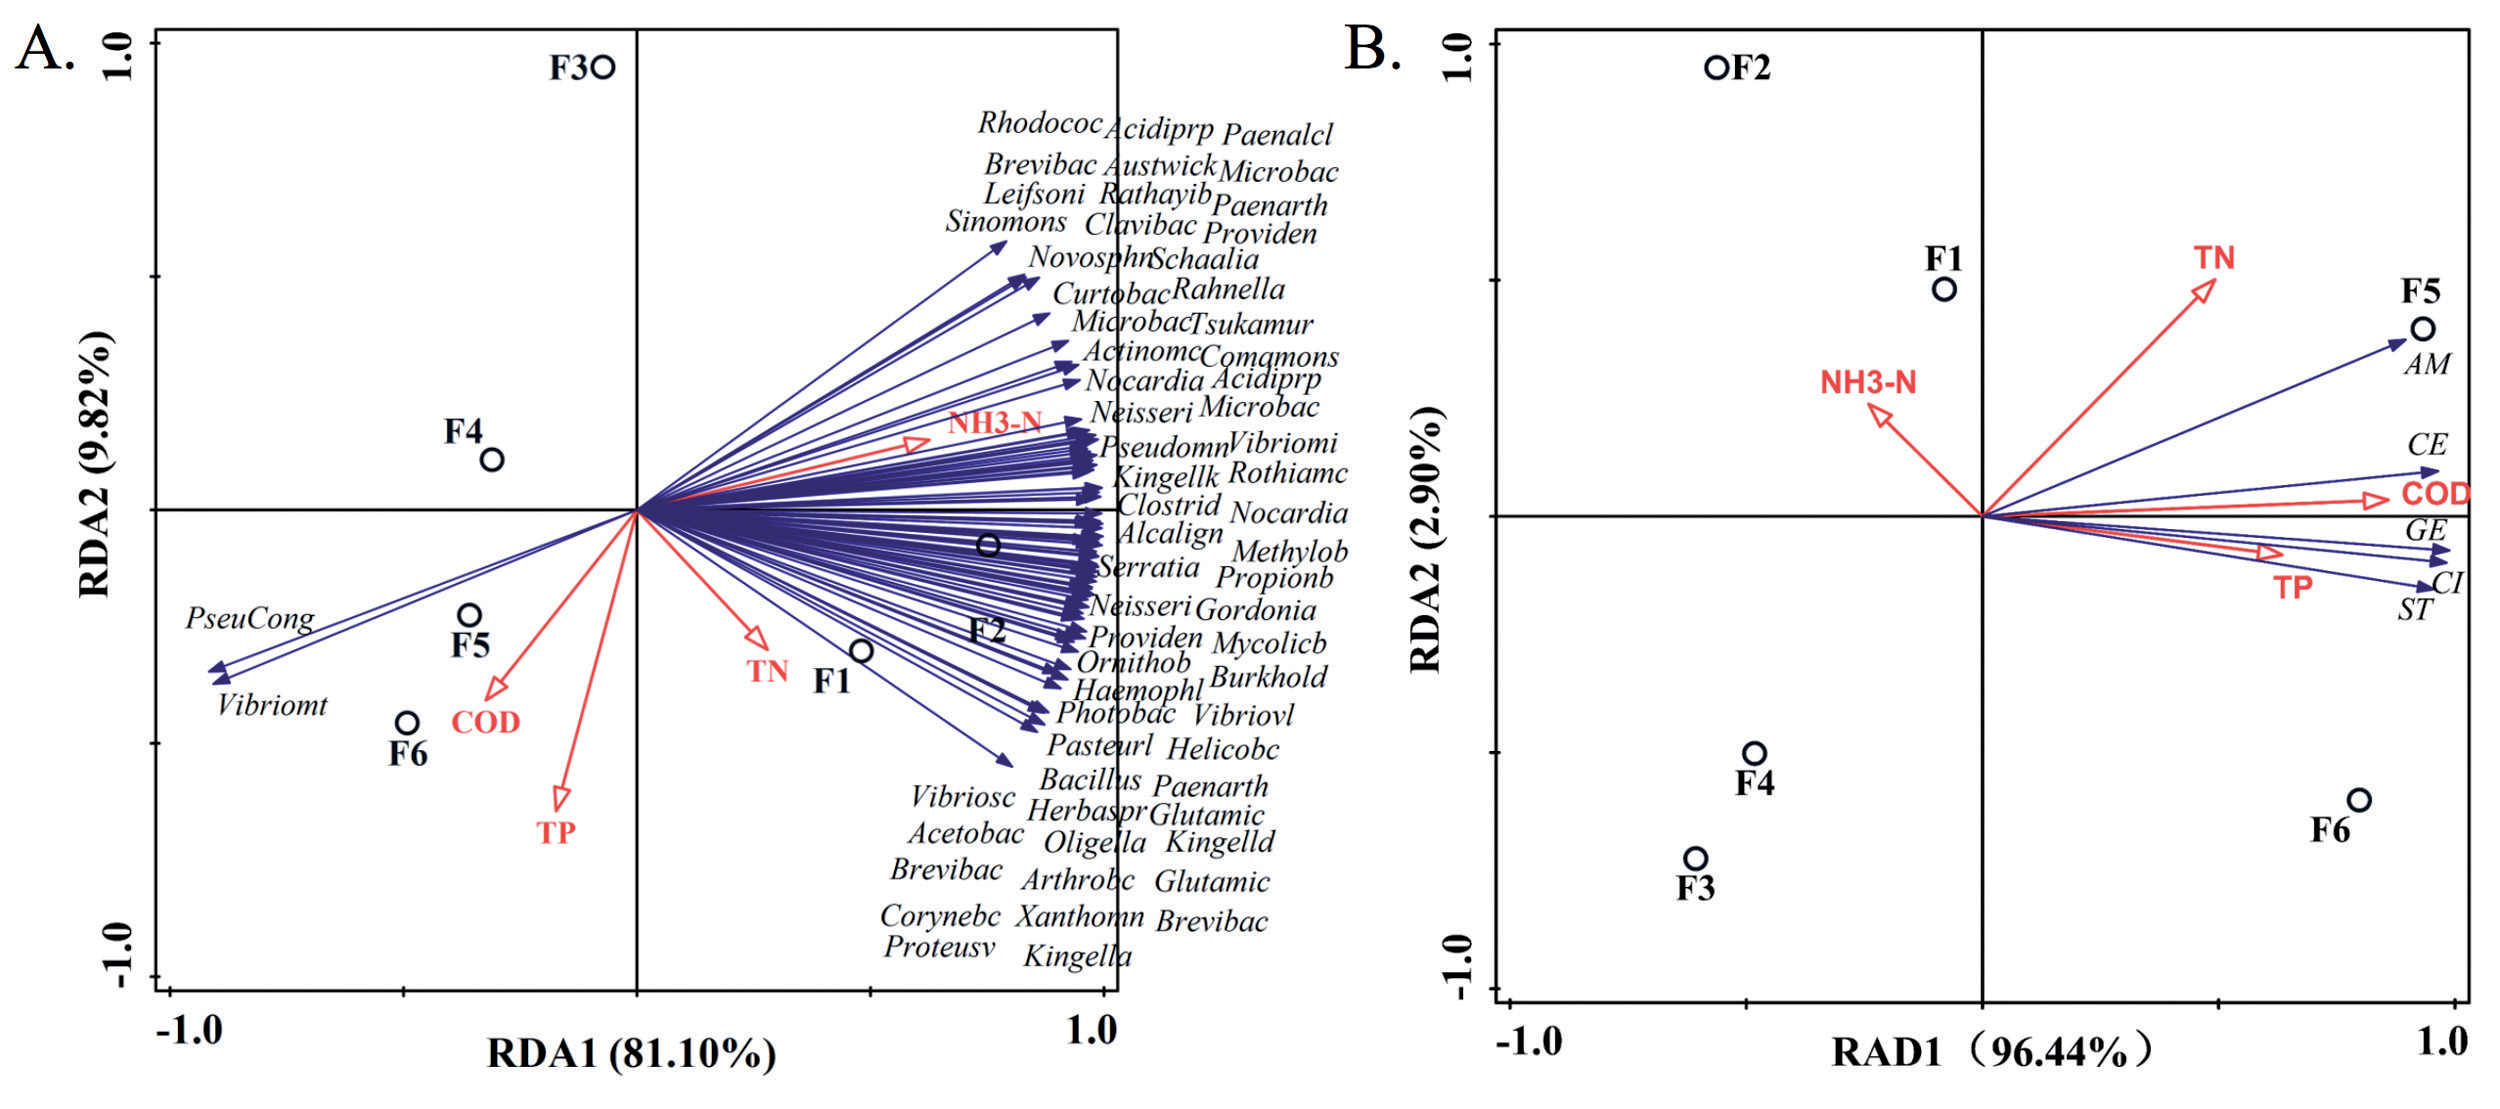
As shown in Fig. 7B, the first two axes explained 96.44% (RDA 1) and 2.9% (RDA 2) of the variation in the antibiotic-resistant bacterial community structure, indicating that the selected water quality factors were the main drivers of the differences in the antibiotic-resistant bacterial community structure. Among all environmental factors, COD and TP had the most significant impact on the antibiotic-resistant bacterial community, with TN explaining part of the variation. Ceftriaxone-, ampicillin-, streptomycin-, gentamicin-, and ciprofloxacin-resistant bacteria showed positive correlations with TN, TP, and COD, while ampicillin-resistant bacteria showed a stronger correlation with TN. In general, TN, COD, and TP had major impacts on the diversity of the antibiotic-resistant bacterial community, which was the main factor influencing variation in the planktonic bacterial community in the reclaimed river water. This is consistent with the findings of other studies on the impact of water quality parameters on planktonic microbial communities, where TN, COD, and TP were important factors that influenced planktonic microbial communities [44]. Therefore, controlling the levels of pollutants such as NH4+-N, TN, and TP is crucial for controlling the growth of planktonic microorganisms. However, current sewage treatment processes limit the removal of inorganic nitrogen and phosphorus from reclaimed water, which may still contain high concentrations of these pollutants, recalcitrant toxic substances, and various pathogenic microorganisms [45, 46]. After the replenishment of reclaimed water into water bodies, the presence of inorganic nitrogen and phosphorus may lead to the rapid proliferation of planktonic algae, causing the eutrophication of river water [47]. Inactivated pathogenic microorganisms may also revive and continue to grow under suitable conditions, competing with existing aquatic organisms, affecting the microbial community structure, and consequently impacting the river water ecosystem. The findings from the aforementioned research demonstrate that the ecological restoration section effectively removes pollutants such as NH4+-N, TN, and TP from the river. This capability significantly enhances the water environment and establishes conditions unfavorable for the growth and reproduction of pathogenic microorganisms. Consequently, this contributes to ensuring the water quality of reclaimed water replenishment in the river. Therefore, the establishment of an ecological restoration section can reduce both river pollution and the health risks posed by pathogenic and antibiotic-resistant bacteria.
Conclusions
Reclaimed water, recognized internationally as the “secondary water source” for urban areas, plays a crucial role not only in alleviating water scarcity but also in reducing pollutant emissions. As a remediation method for heavily polluted rivers, bioremediation techniques have gradually been applied in the field of reclaimed water. Therefore, it becomes particularly important to demonstrate the safety of reclaimed water as an environmental water source and the restoration effect of the ecological restoration section. In this study, a comprehensive contribution of ecological restoration projects to improving the water quality of reclaimed water-replenishing urban rivers has been investigated, and several important conclusions have been derived, as outlined below:
(1) The aquatic ecosystem remediation engineering area, composed of ecological medium beds, ecological filter walls, and submerged plants, had a good removal effect on conventional pollutants, with removal rates of NH4+-N and COD as high as 70% and 40%, respectively.
(2) The aquatic ecosystem remediation engineering area can also effectively reduce the biological toxicity of the reclaimed water, in which the average EC50 values of luminous bacteria, Chlorella, and Daphnia magnas increased from 63.33, 84.51, 10.80 N, and 10.80 to 69.06, 110.92, and 15.53 N.
(3) After the purification of the aquatic ecosystem remediation engineering area, the resistance genes in the reclaimed water can be effectively reduced. Simultaneously, it could effectively control the abundance of individual pathogenic and drug-resistant bacteria in rivers.
Overall, the construction of an aquatic ecosystem remediation engineering area at the front end of an urban river replenished with reclaimed water is an effective means of guaranteeing the quality of reclaimed water. Implementing this practice can enhance water quality, diminish the biological toxicity of reclaimed water, regulate the proliferation of pathogenic microorganisms, and mitigate ecological risks associated with the process of ecological restoration of reclaimed water.
In this study, the investigated reclaimed water river commonly originates from domestic sewage as its primary water source. However, in wider practical terms, since the sources of reclaimed water encompass urban sewage and industrial wastewater, a more diverse array of pollutants may exist in the replenishment process and lead to persistent uncertainties even after undergoing certain treatment processes [12]. For reclaimed water rivers originating from industrial wastewater, additional research and analysis are required to evaluate whether the ecological restoration section can still respond effectively and ensure the safety of the rivers. It is believed that a deeper understanding and further research efforts will unveil the protective role of the water ecosystem restoration engineering zone in urban reclaimed water replenishment rivers, providing theoretical support for the water quality management of reclaimed water and urban landscape rivers.

