

Introduction
Clean water is essential for nature biology and society, but pollution can threaten ecosystems and reduce drinking water availability [1]. Karst water is an important drinking water source for about one quarter of the global population [2-4]. Among them, reservoirs and spring water have been widely developed to be used as drinking water. Many studies on water security so far have found that the karst surface water and groundwater are easily polluted by focused recharge in carbonate rock regions due to the enhanced porosity and permeability, and intense human activities [2, 3, 5]. Some studies have shown that groundwater chemistry characteristics can be affected by a combination of natural factors and anthropogenic activities, while rock erosion is the main factor [6, 7]. Heavy metal pollution caused by industrial activities, agricultural fertilization, and mining activities in karst area can finally enter into reservoirs and spring water, and now has become a problem worldwide [8-10].
Currently, the studies of heavy metal pollution in karst area have been mainly focused on sediment [11, 12] and soil [13], but few on source water. A previous study has shown that heavy metals originated from metal mining in southwest China has polluted rivers and karst groundwater, while rapid exchange of these metals in surface and groundwater systems were also observed [12]. Agricultural erosion in heavy rainfall seasons and the strong weathering of rocks and sediments can also increase the levels of heavy metals (HMs) in river water [14]. It has been shown that heavy metals or other pollutants such as fluoride in drinking water or groundwater which exceeding standards can pose a cancer risk to residents while infants are the most vulnerable human beings to the adverse health effect [15, 16]. As a semi-natural and semi-artificial ecosystem, karst reservoirs are easily affected by heavy metals with natural leaching and human activities. However, few studies have specifically quantified the heavy metal pollution levels in these reservoirs.
Guangxi Zhuang Autonomous Region, Southwest China, is one of the most highly karstic areas worldwide. Due to the historical mining, heavy metal pollution in water of this area has been aroused considerable interest over the past years. Guishi Reservoir, Lingdong Reservoir, and Lingshui Spring, the three typical karst reservoirs (National drinking water source Level I protection zone) which have been used as drinking water sources for Hezhou City, Lingshan Country, and Wuming Country, are providing drinking water to these towns and cities. In addition, these reservoirs also provide source water for surrounding villagers for their daily lives, however, these cultivation, aquaculture, and industrial activities might also import HMs to these waters. Drinking water supplied to the towns and cities, which undergoes standardised treatment at the waterworks., but the surrounding villagers use untreated source water in their daily life, making the investigation of HM contamination become more important.
This research aims to (1) evaluate the HM pollution and water quality characteristics of the Guishi Reservoir, Lingdong Reservoir, and Lingshui Lake in the Guangxi Province, Southwest China, (2) analyze and identify the possible sources of HMs in the water, and (3) evaluate the ecological risks of HMs to fully understand the environmental variation influences on the reservoirs and spring. This study is expected to provide a scientific basis and practical references for the source’s identification and risk assessment of HM pollution and the water quality assessment in similar areas. Moreover, the research results would be useful to better understand the behaviors of heavy metals in water under the influences of human activities.
Materials and Methods
Study Area
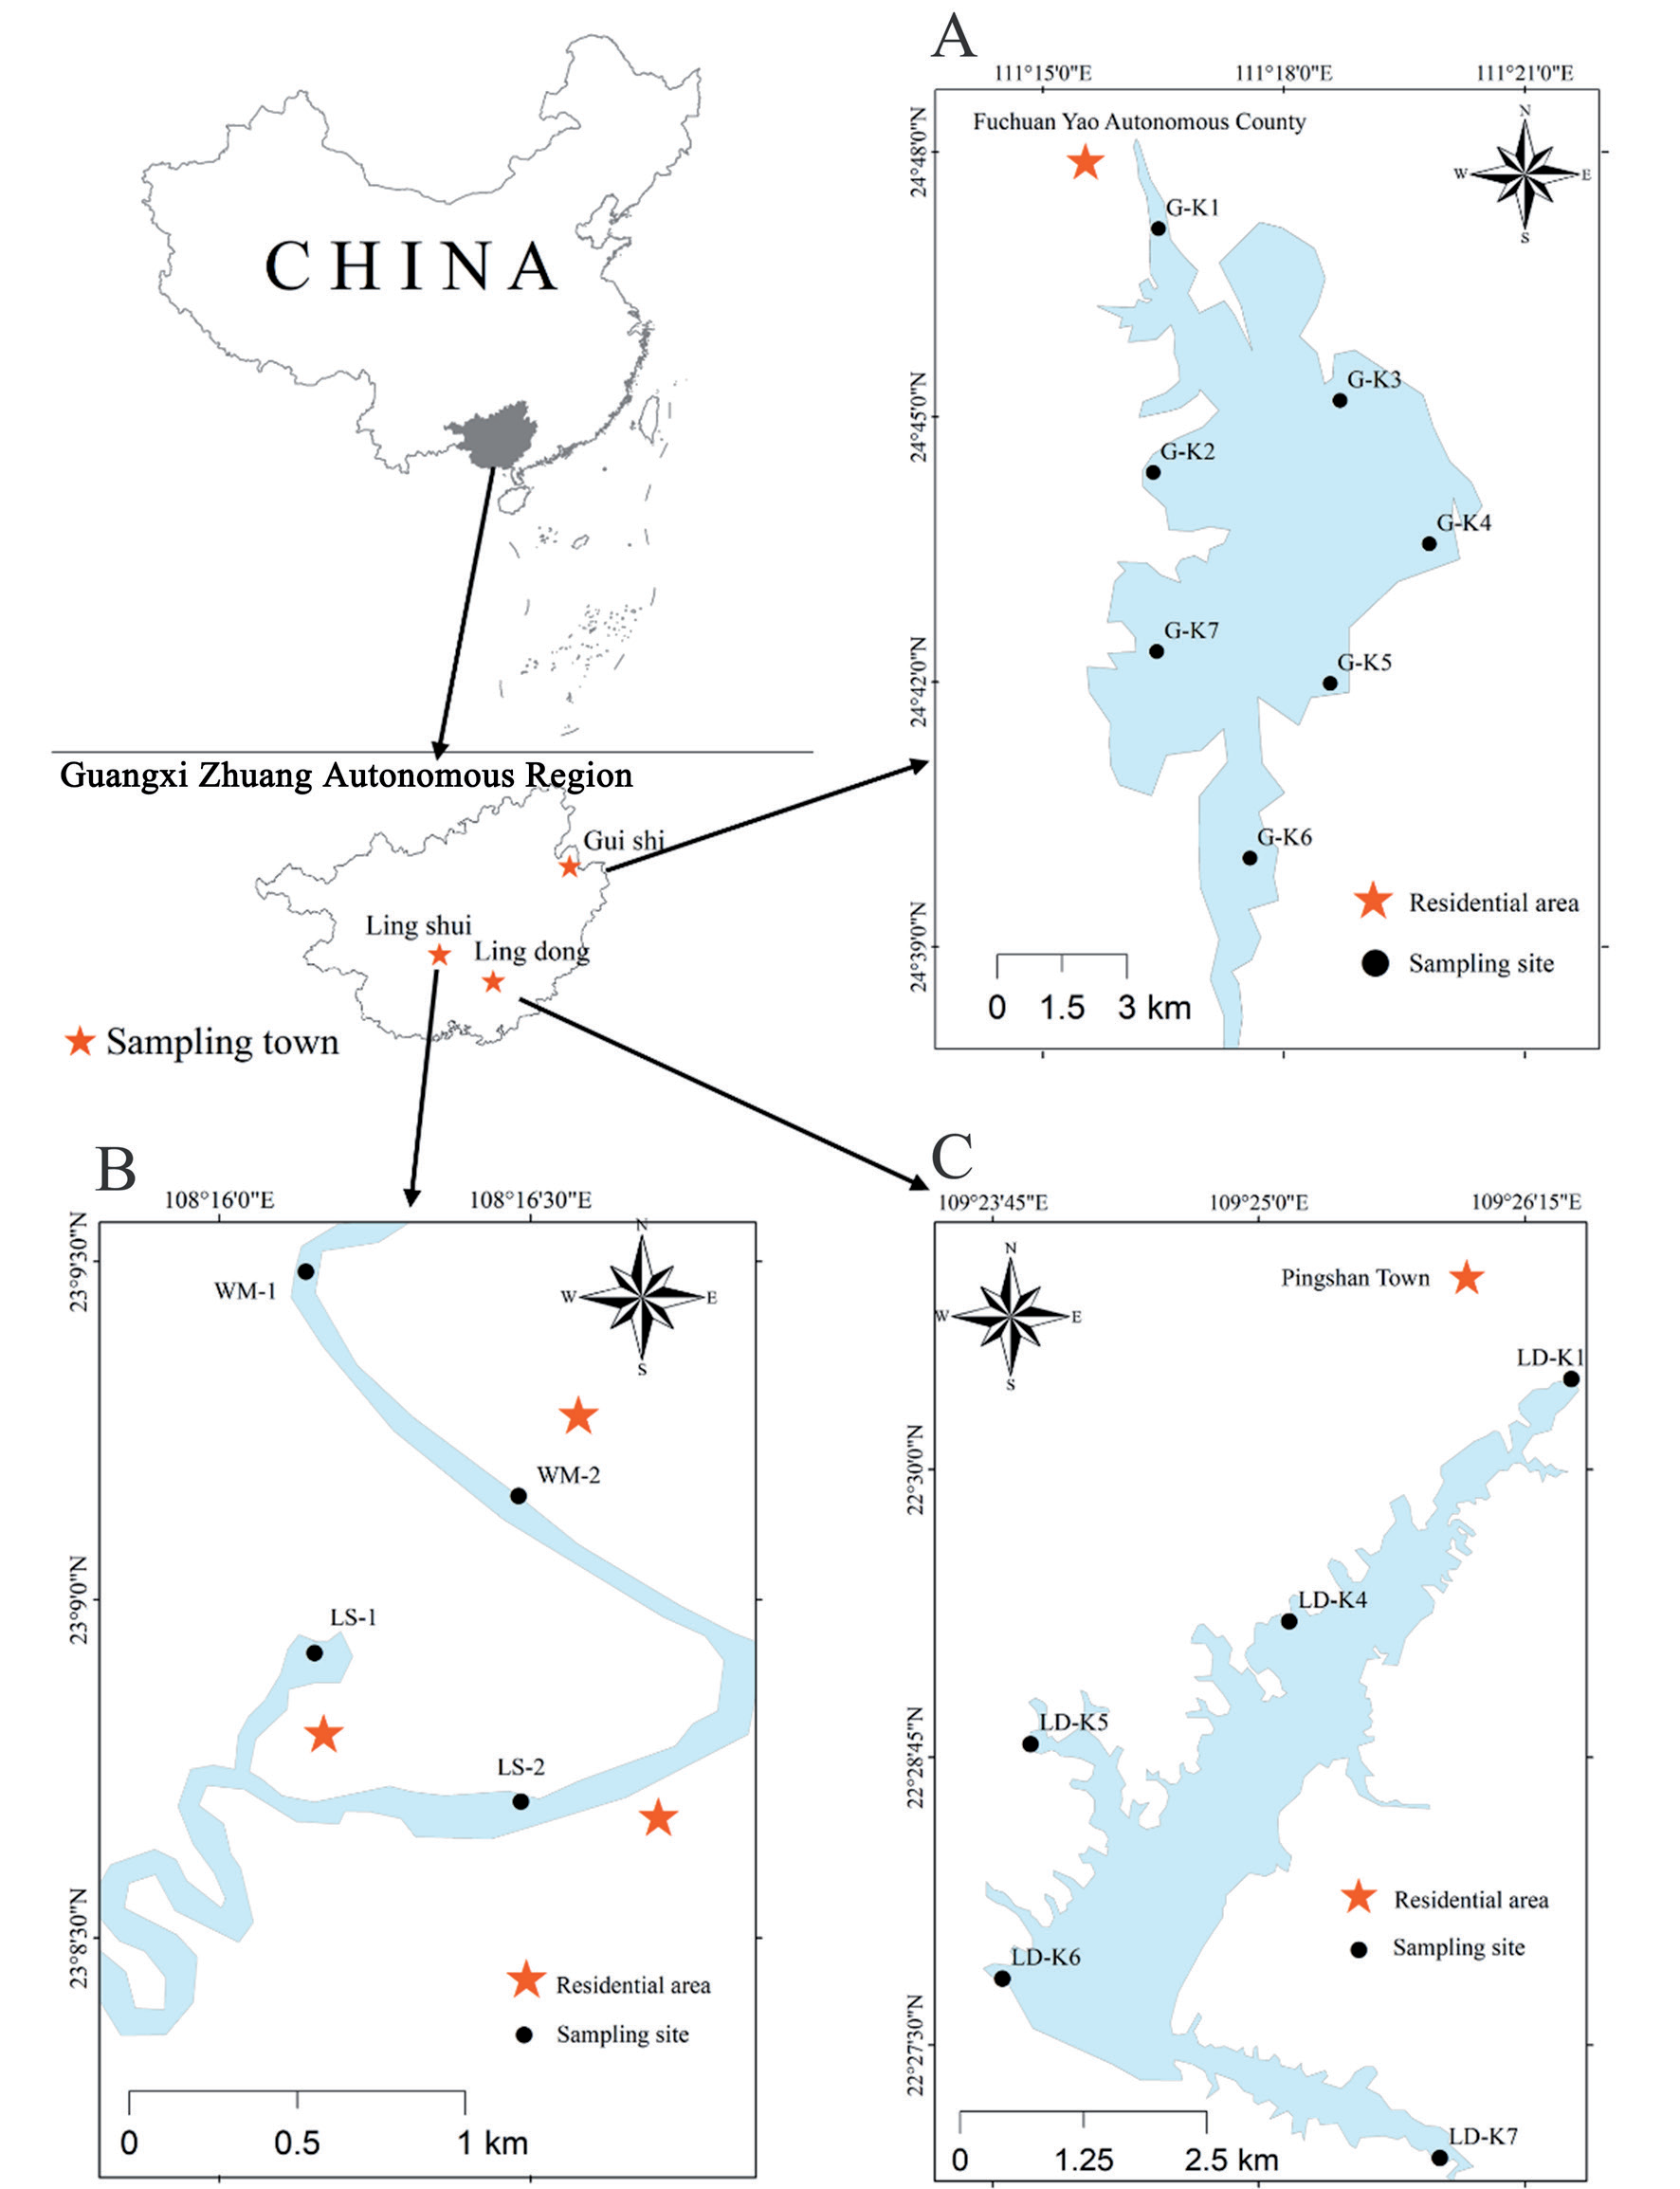
The study areas are in the northeast and the middle of Guangxi Zhuang Autonomous Region, Southwest China. These areas have a monsoon climate with average annual precipitation between 1200 and 2200 mm. The impoundage of Guishi Reservoir and Lingdong Reservoir are 595 and 179 million m3, with daily water supply capacities of 0.055 and 0.232 million m3/d, respectively. The impoundage of Lingshui Lake is unclear, while the daily water supply capacity is 0.09 million m3/d. As shown in Fig. 1, sixteen water samples were collected in July 2021 from two reservoirs and a lake, including Guishi Reservoir (Fig. 1a), Lingshui Lake (Fig. 1b), and Lingdong Reservoir (Fig. 1c). Some drinking water samples were also collected. Duplicate samples were taken in the selected sites during sampling to consider river water fluctuation.
Sample Analysis
Water samples were collected at a depth below 0.5 m and stored at 4ºC prior to analysis. In situ filtration using 0.45 mm filters was conducted on water samples intended for dissolved metals analysis. Inductively coupled plasma mass-spectrometry (ICP-MS, Nexion 350, PerkinElmer Ltd., USA) was used to determine the concentration of heavy metals (Cr, Mn, Co, Ni, Cu, As, Cd, and Pb), in filtered water samples. The recovery of the heavy metals in the samples ranged from 90% to 110%, while the detection limits were determined to be 10 ng/L. The water used for dilution and dissolution was purified through a Millipore deionizing system at 18.2 MU. Standard reference materials were obtained from the Centre of National Standard Reference Materials of China. To ensure the quality of the results, blank samples were analyzed in each batch of analyses, and quality assurance and quality control (QA/QC) procedures were implemented. All samples were analyzed in duplicate, and the analytical precision was considered acceptable when the relative standard deviation was within 5%.
Water Quality Assessment
The indicators used in this study are heavy metal pollution index (HPI) and heavy metal evaluation index (HEI), which are commonly used for water quality assessment.
HPI was used to assess the overall water quality with respect to heavy metal pollution. The HPI based on weighted arithmetic mean is developed on two basic steps: 1) giving weight to selected parameters (target HMs), and 2) summing the indexes for each selected pollution parameters. Each parameter is assigned a weight between 0 and 1, and the value of the parameter weight is inversely proportional to the standard value (maximum allowable limit value) Si (Wi = 1/Si) according to the China Standards for the Drinking Water Quality (GB-5749 2006). HPI is calculated as follows Equation (1):
Table 1.
Ranking criteria of pollution and ecological risks.
Where Qi is the secondary index of the ith parameter, Wi is the weight coefficient of the ith parameter, n is the total amount of the parameter, Qi is calculated as follows Equation (2):
Where Mi is the measured value of the ith parameter, Ii is the ideal value, which is set as 0 to simplified in this case. To better characterize the pollution levels, three levels were separate as a scale based on the critical values of 100 as shown in Table 1. The scale system was successfully applied by the following researches [17]. The most serious evaluation results would be used to exhibit the final pollution status based on the worst scenario.
HEI represents the overall water quality of surface water relative to the heavy metal contents. The calculation formula is shown as follows Equation (3):
Hi represents the monitoring value of the ith heavy metal parameter and Hmac represents the maximum allowable concentration value of the ith heavy metal parameter. The HEI based surface water classification is shown in Table 1 [18].
Human Health Risk Assessment
Hazard quotient (HQ) determined by using non-carcinogenic human health risks from ingestion (HQingestion) and dermal contact (HQdermal). Referring to previous studies, HQ>1 indicates a high risk effect for people, while H <1 indicates a low risk for people [19]. In this study, human health risks were assessed for eight heavy metals (Cr, Mn, Co, Ni, Cu, As, Cd, and Pb) using mathematical expressions derived from the USEPA Risk Assessment Guidance for Superfund (RAGS) methodology [20] Equation (4, 5):
Where Cwater = Concentration of heavy metals in water samples (µg/L), IR = ingestion rate (adults: 2 L/day, children: 0.64 L/day), EF = exposure frequency (days/year) which is 350 days per year, ED = duration of exposure (adults: 70 years, children: 6 years), BW = body weight (adults: 70 kgs, children: 15 kgs), AT = average exposure time (adults: 365 days/year × 70 years, children: 365 days/year × 6 years), SA = skin’s surface area (adults: 18,000 cm2, children: 6600 cm2), Kp = dermal coefficient of permeability for each heavy metal [21], ET = exposure time during bath (0.25 h/day), CF = unit conversion factor which is 0.001 L/cm3.
The mathematical formula for Hazard Quotient (HQ) is as follows Equation (6, 7):
Where RfD = Oral reference dose for each metal [22], RfDd = Dermal Absorption Reference Dose ABSg = Gastrointestinal absorption factors for each heavy metal (As = 100%, Cd = 5%, Co= 100%, Ni = 4%, Cr = 2.5%, Pb = 100%, and Mn = 40%)
Non-carcinogenic health risks from heavy metal intake and dermal exposure are calculated using the Equation (8):
Where HI = Risk index for heavy metal intake and skin exposure, potential non-carcinogenic risks (HI>1) and no health risks (HI<1) [20-23].
Statistical Analysis
The sources of heavy metals in water include natural sources and anthropogenic sources. To distinguish the possible sources of heavy metals, cluster analysis was used to analyze the sampling data in this paper. Statistical analysis was done using SPSS 20.0, and graphs were plotted using the software Origin 2021 and ArcGIS 10.8.
Results and Discussion
Variation of Physicochemical Water Characteristics
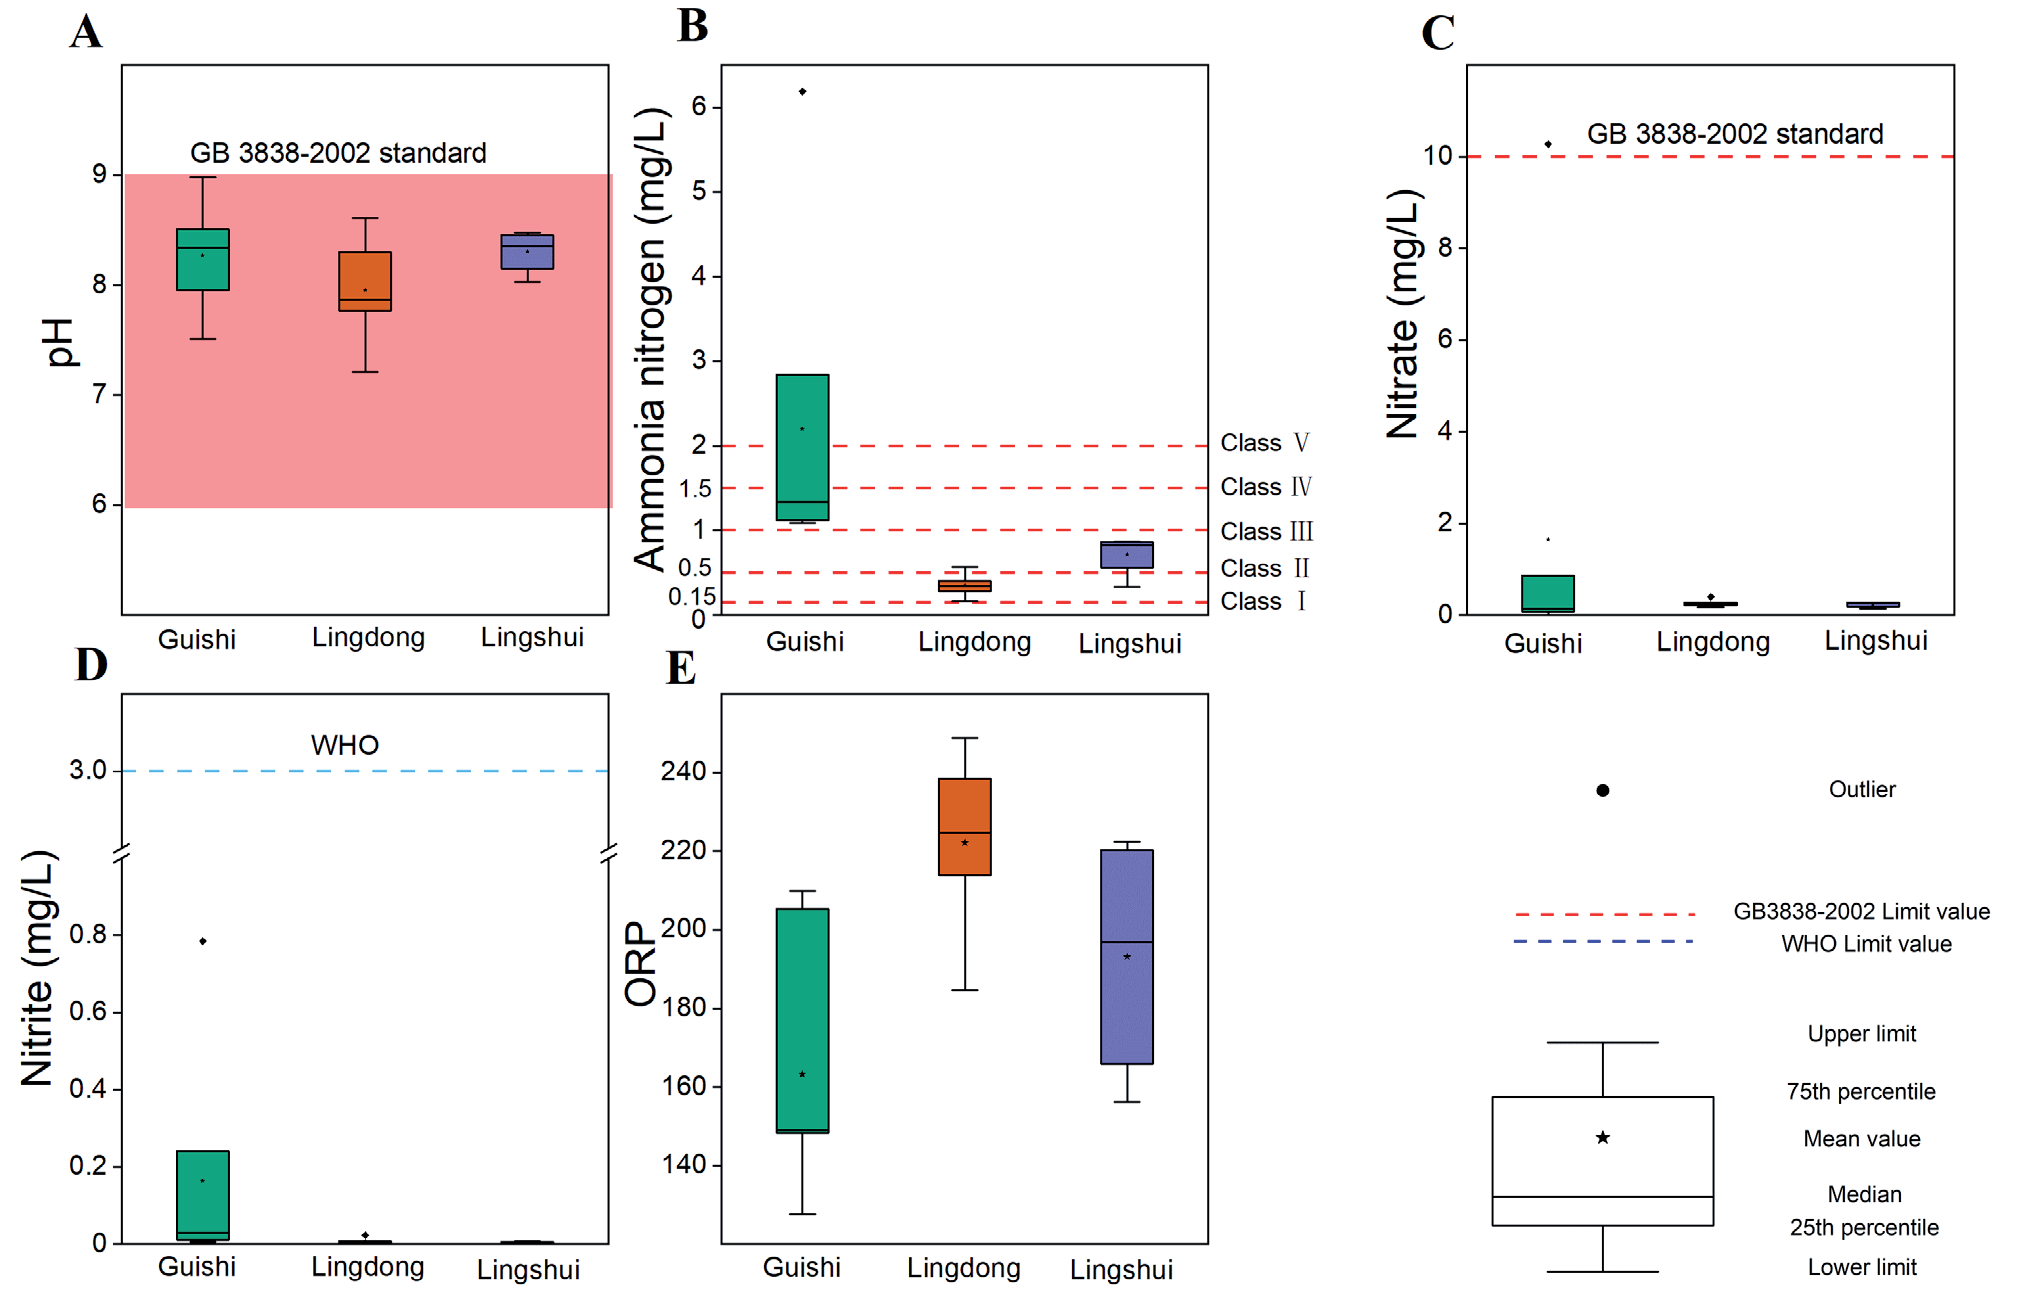
Fig. 2 presents the physicochemical parameters and surface water reference standards for water quality in the study area. The average pH values of these karst water sources ranged from 7.21 to 8.98, indicating a weak alkaline nature. These pH values were compared with the Surface Environmental Quality Standards (GB3838-2002) set by China, and all the samples were found to be within the standard limits. The average concentrations of ammonia nitrogen in the Guishi Reservoir, Lingdong Reservoir, and Lingshui Lake were 2.2 mg/L, 0.35 mg/L, and 0.72 mg/L, respectively. Fig. 2 shows that the average ammonia levels in the Lingdong and Lingshui reservoirs are lower than class Ⅱ and class Ⅲ, respectively. However, it is noteworthy that the average ammonia nitrogen levels in the Guishi Reservoir are higher than class Ⅴ, which poses a risk to the local residents and the aquatic ecosystem. Generally, the nitrite and nitrate levels at the three study area sampling sites were mostly below the WHO recommendation of 3.0 mg/L and the GB3838-2002 recommendation of 10 mg/L. In addition, their concentrations were relatively high in the Guishi Reservoir compared to Lingdong Reservoir and Lingshui Reservoir.
Variation of HMs in Three Karst Source Waters in Southwest China
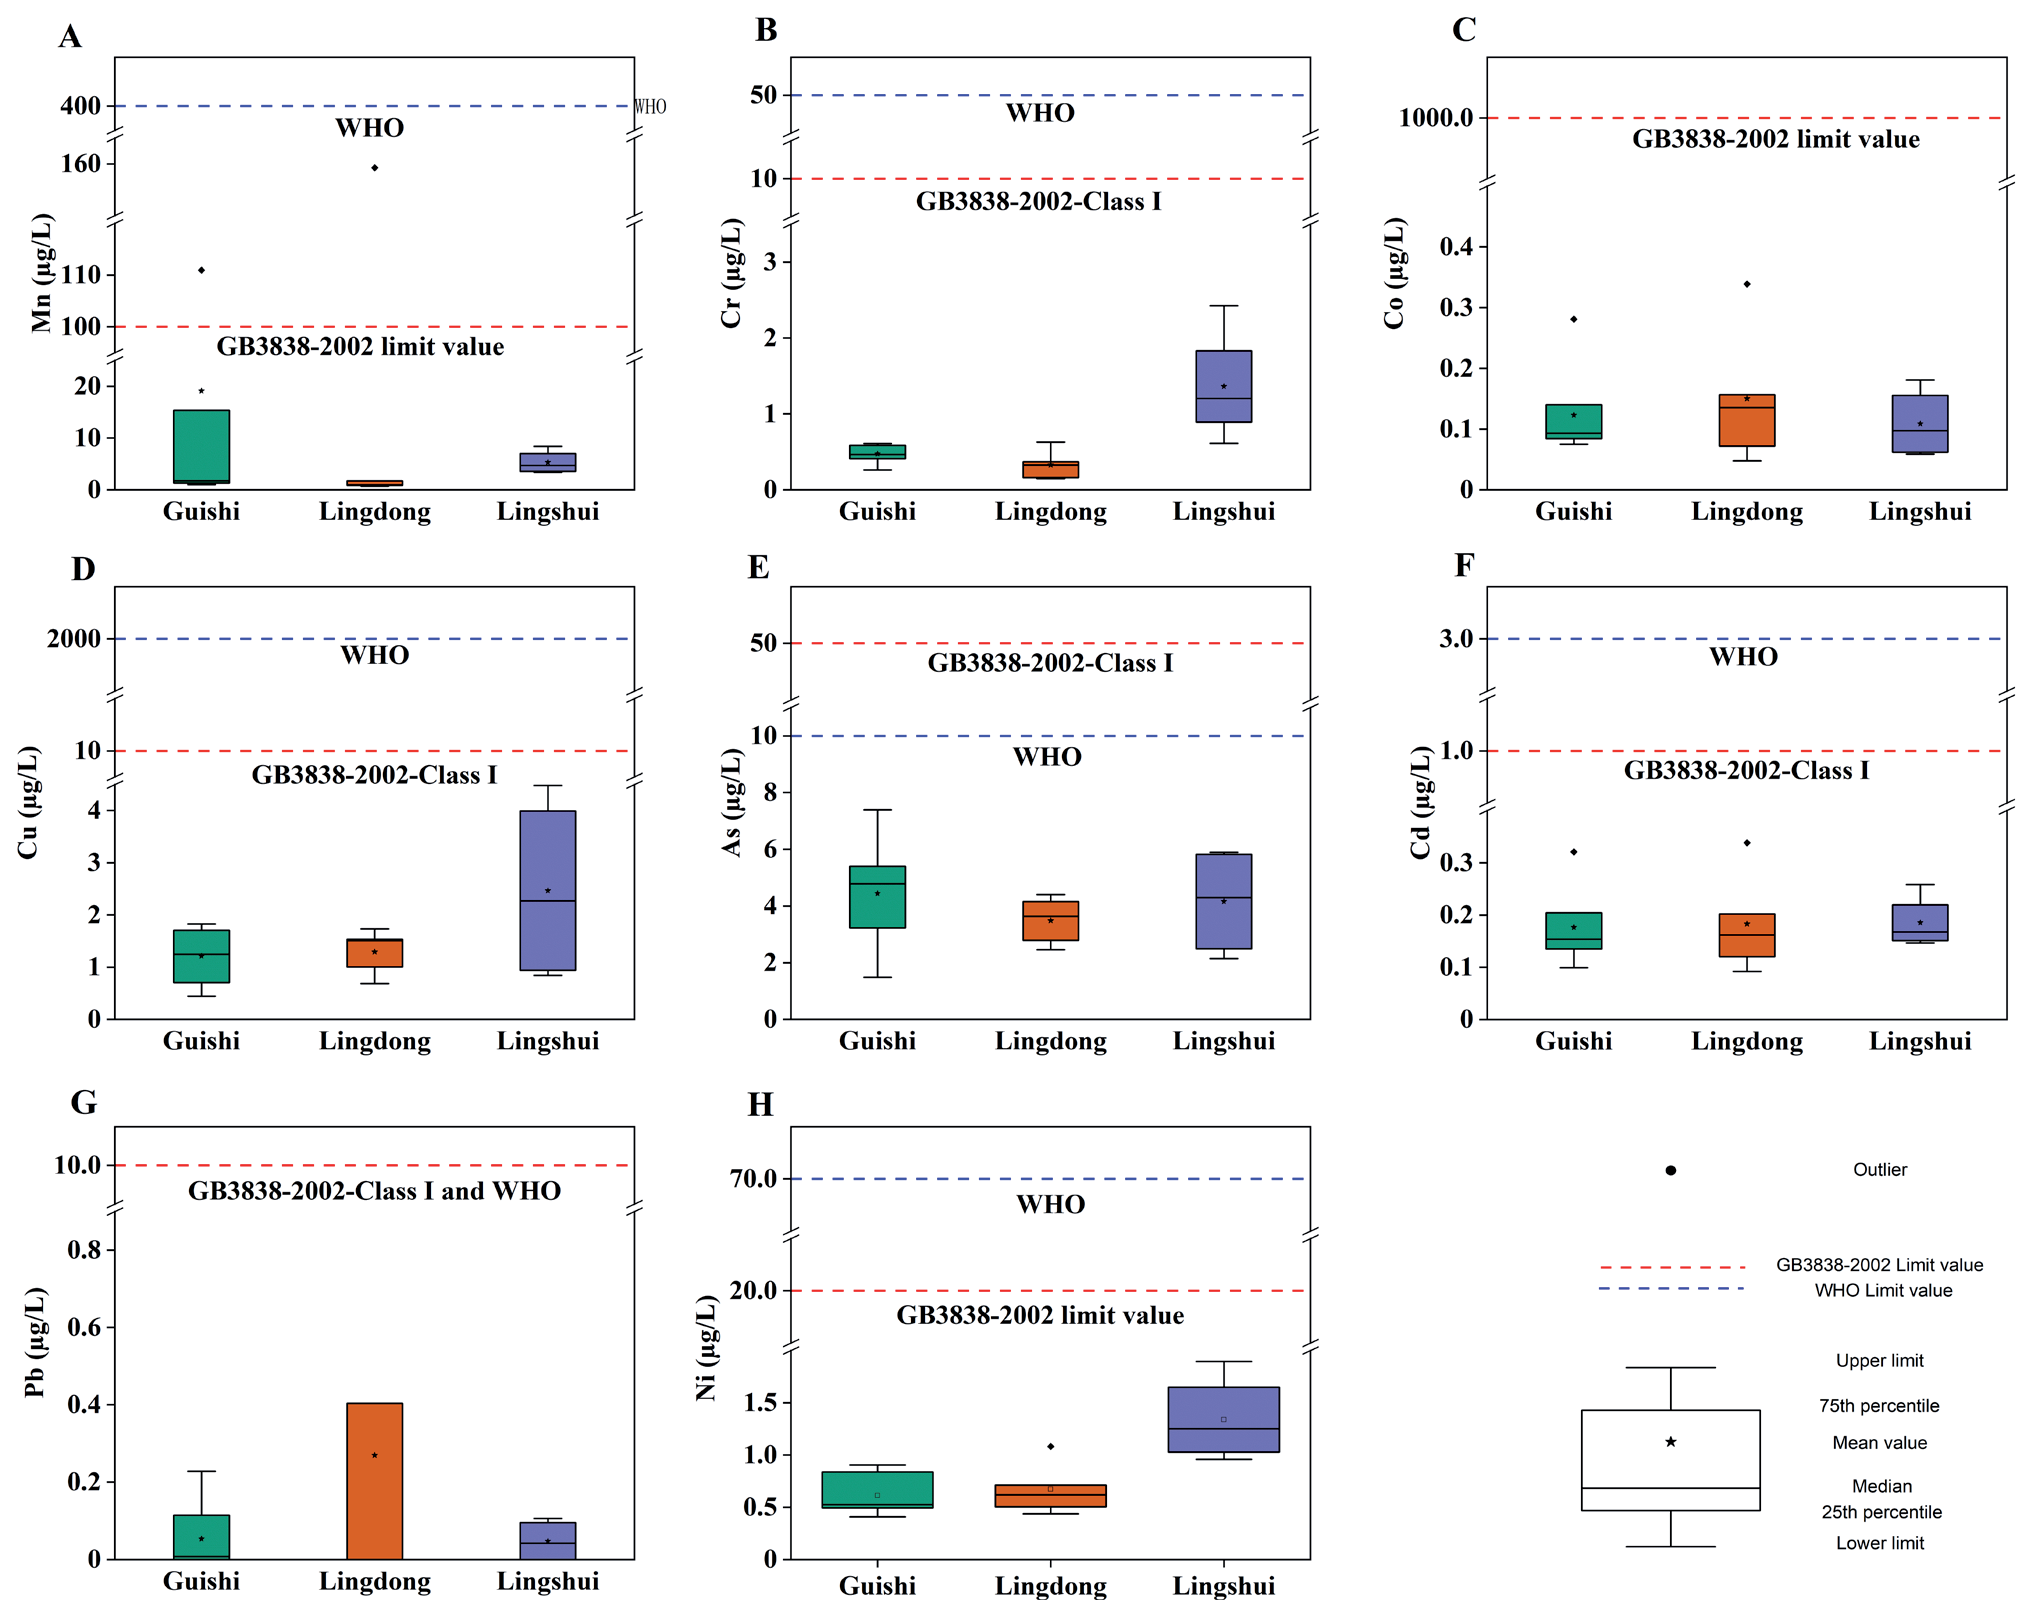
Fig. 3 and Table 2 shows the contents of heavy metals in water in three karst water sources and the guidelines in China’s Surface Environmental Quality Standards (GB3838-2002) and WHO Standards. The average concentrates of the HMs in the Guishi Reservoir followed the descending orders of Mn (19.09±40.82 µg/L) >As (4.44±1.85 µg/L)>Cu (1.21±0.52 µg/L)>Ni (0.61±0.19 µg/L)>Cr (0.47±0.12 µg/L)>Cd (0.18±0.07 µg/L) >Co (0.12±0.07 µg/L)>Pb (0.05±0.09 µg/L). The average concentrate of the HMs in Lingdong Reservoir followed the descending orders of Mn (32.71±70.74 µg/L) >As (3.49±0.85 µg/L)>Cu (1.29±0.43 µg/L)>Ni (0.67±0.25 µg/L)>Cr (0.33±0.19 µg/L)>Pb (0.27±0.42 µg/L) >Cd (0.18±0.10 µg/L)>Co (0.15±0.11 µg/L). The averaged concentrate of the HMs in the Lingshui Lake followed the descending orders of Mn (5.29±2.28 µg/L)>As (4.16±1.95 µg/L)>Cu (2.46±1.81 µg/L)>Cr (1.36±0.76 µg/L) >Ni (1.34±0.41 µg/L)>Cd (0.19±0.05 µg/L)>Co (0.11±0.06 µg/L)>Pb (0.05±0.06 µg/L). As shown in Fig. 3, the results from the three study areas were compared with the standard guidelines. The average values of heavy metals in all lakes were below the guideline values in the China’s Surface Environmental Quality Standards (GB3838-2002), except for Guishi Reservoir and Lingdong Reservoir, where Mn was detected in some sampling points exceeding the limit values. It is worth noting that the ranking of heavy metal concentrations in the three karst sources water is very similar.
Water Quality Assessment
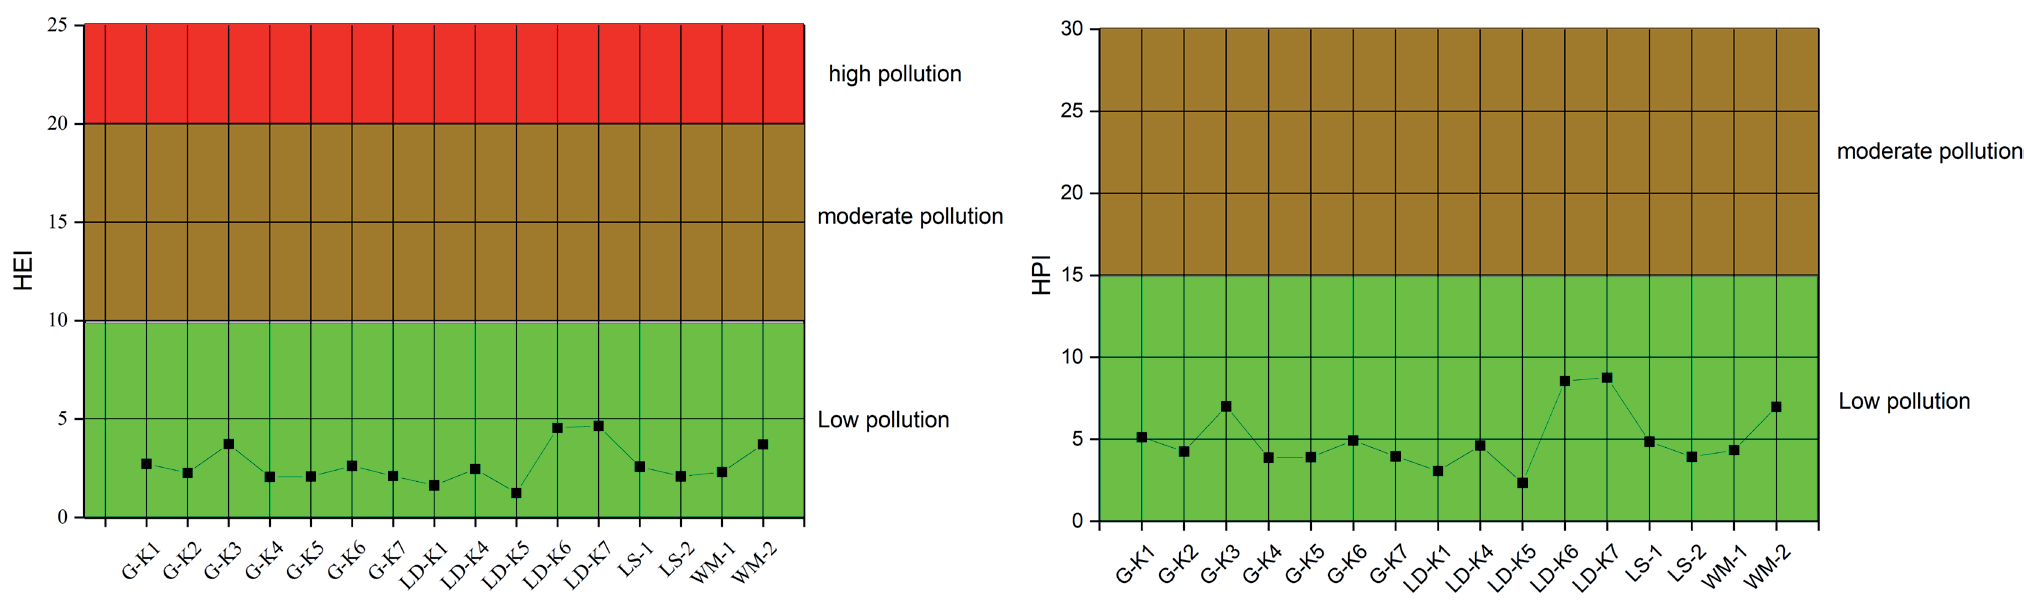
As shown in Table 1, the pollution grades were calculated based on HPI with values lower than 100: low pollution (HPI˂15), medium pollution (15≤HPI≤30), and high pollution (30<HPI≤100). The pollution levels based on HEI also can be categorize into: low pollution (HEI˂10), medium pollution (10≤HEI≤20), and high pollution (20≤HEI≤40) levels (Table 1). In this study, the HPI values ranged from 2.34 to 8.75, with the highest HPI value obtained at Site LD-K7 in the Lingdong Reservoir. As shown in Fig. 4, all HPI results were below 15, indicating that low pollution of the studied areas. Among the HEI results, the highest value at Site LD-K7 were also located in the Lingdong Reservoir, which indicates a direct correlation between the pollution indices [24]. The HEI results for all samples were less than 10, indicating that the source water were not contaminated by HM.
Table 2.
Water quality parameters in three karst water sources.
Human Health Risk Assessment
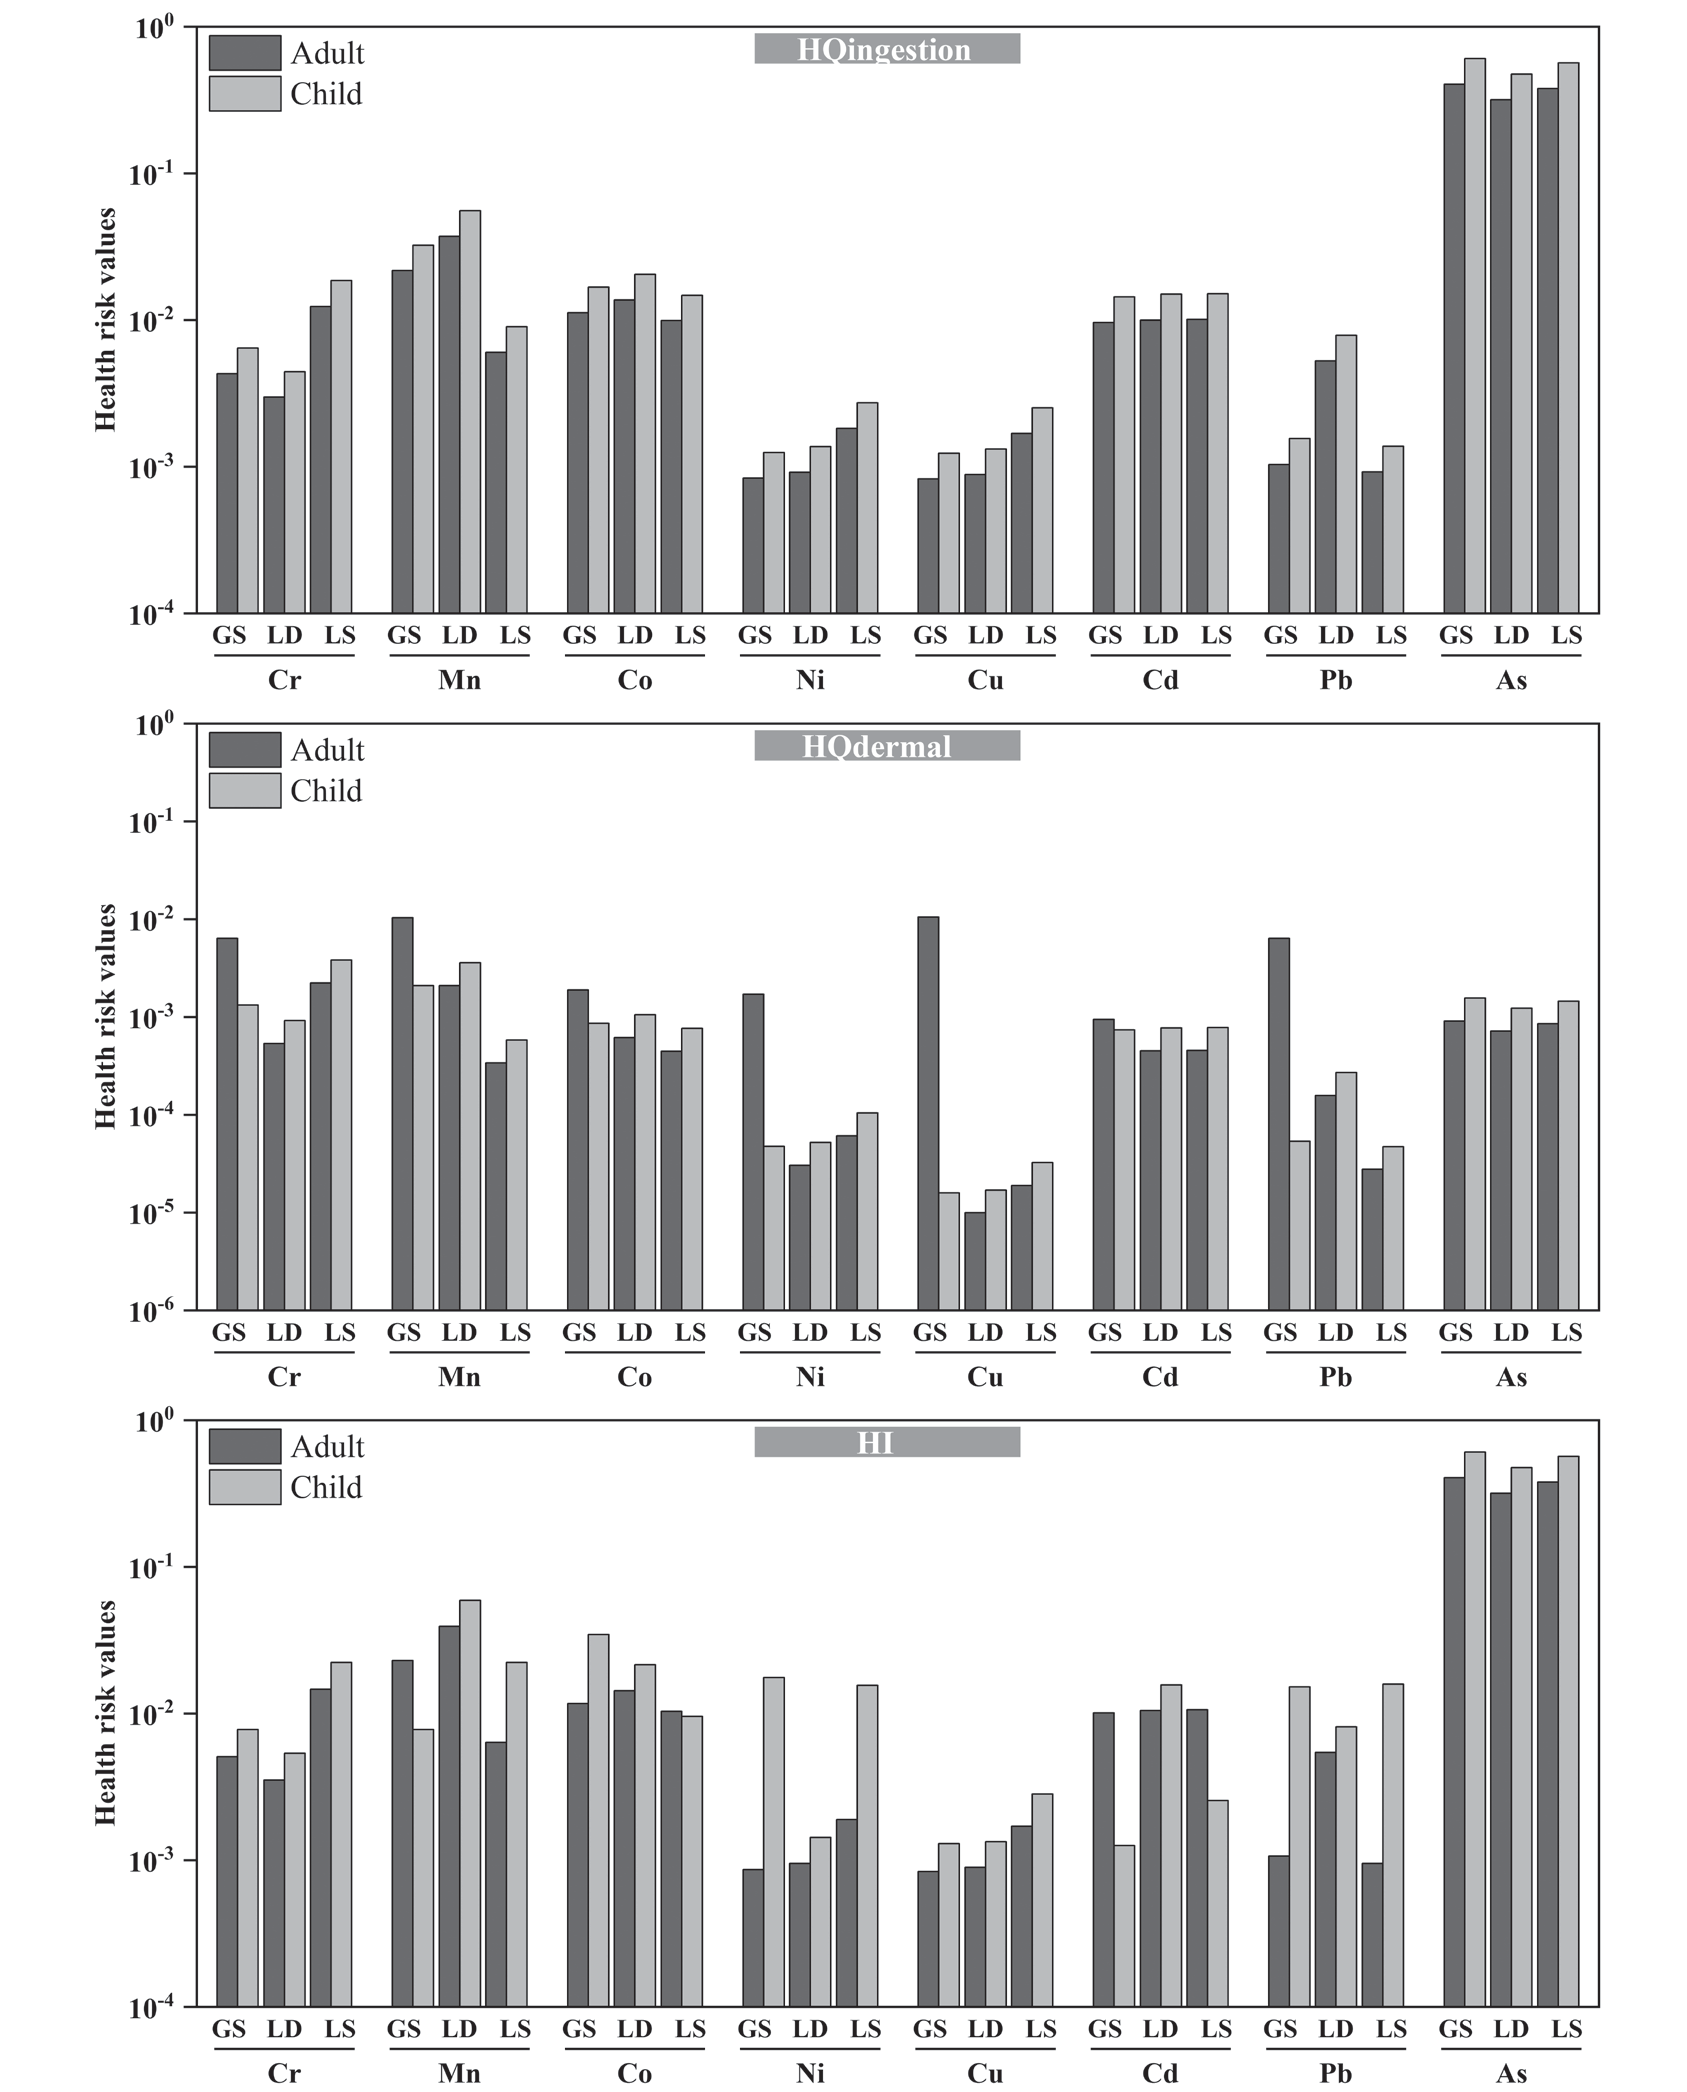
Health risks from oral and dermal exposure to HMs are assessed using the HQ index, which is calculated separately for adults and children. The average HQingestion and HQdermal values for different HMs in the three reservoirs were shown in Fig. 5, and we found that the levels were all lower than 1. Therefore, none of the HMs in the samples posed any risk to adults or children through ingestion and dermal contact.
Our study found a higher non-carcinogenic risk of As in children than in adults, and similar results have also been reported in previous studies [22, 25, 26]. HI values represent the overall potential health risk of HMs (Cr, Mn, Co, Ni, Cu, Cd, and Pb) to humans. It is noteworthy that the HI values for As in this study were higher than those for others. Nevertheless, the HI results for all HMs in the three reservoirs were less than 1, which were consistent with those of HQ. In summary, we should pay attention to the enrichment of As in the aquatic environment.
Source of Dissolved Heavy Metals in Water
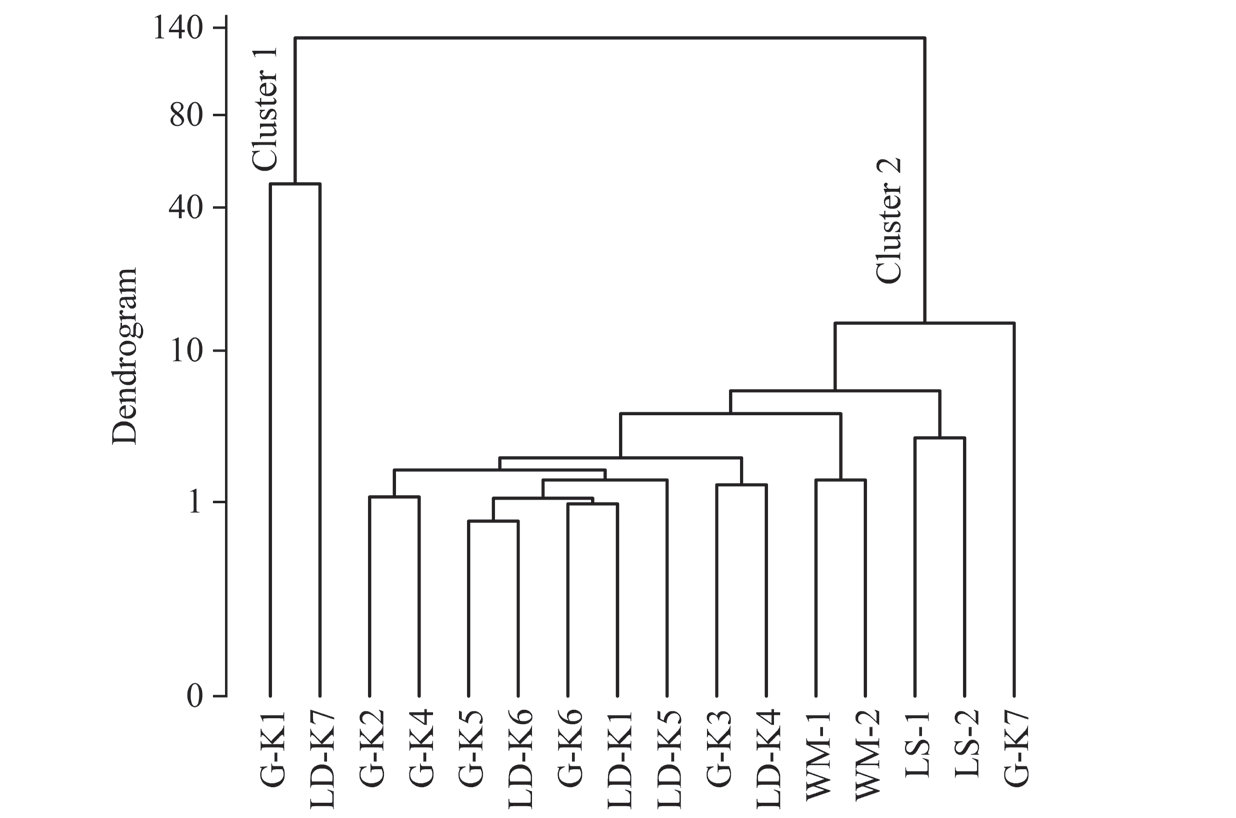
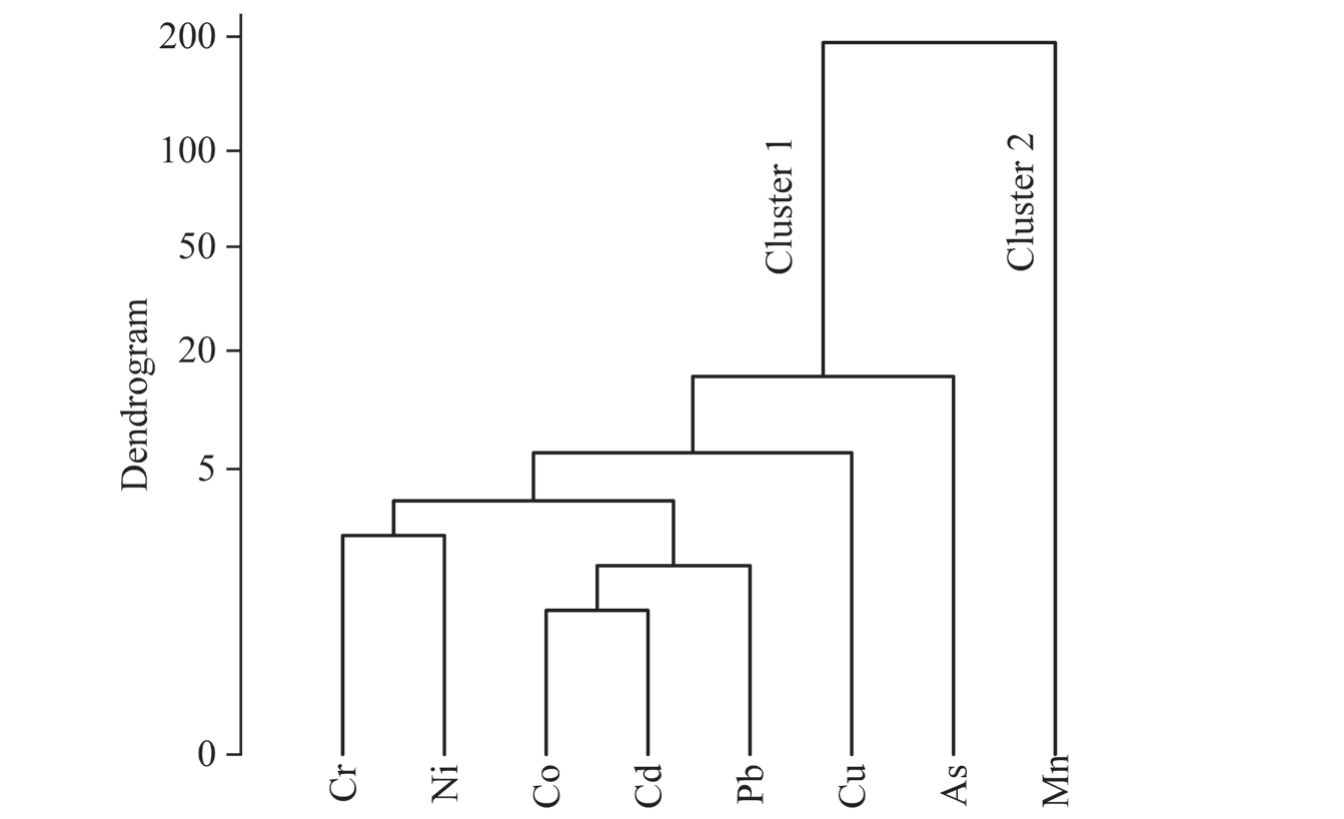
The origin of HMs in the aqueous environment can be identified cluster analysis, based on ward’s method of Q-mode and R-mode clustering, while the former one is based on the number of samples, and clustering samples with similar characteristics together and separating samples with large differences, as shown in Fig. 6. However, the R-mode is based on the clustering of different variables, and similar variables were clustered together and separated based on their differences (Fig. 7). Q model Cluster 1 contains samples from G-K1 (Guishi Reservoir) and LD-K7 (Lingdong Reservoir), both of which are characterized by relatively high levels of Mn. Cluster 2 contains the other sites, which exhibit low levels of various HMs. Based on the R model, cluster 1 composed with Cr, Ni, Co, Cd, Pb, Cu, and As, might indicate their correlations with each other, and cluster 2 only contains Mn. Generally, most of the sampling sites showed little variation in heavy metal contents. According to the Chinese Cultivated Land Geochemical Survey (CGS 2015), more than 80% of heavy metal pollution in karst areas is due to the regional background and soil weathering. Considering the inter-migration of heavy metals between soil and water bodies, the heavy metals in the water of the three reservoirs should be mainly attributed to the enrichment due to natural conditions. Some studies have also shown that most reservoirs have low pollution loads due to the unchanging mountainous terrain and traffic [27]. However, based on our investigations, we found the presence of towns or villages around the three reservoirs, with significant human activity. It is therefore important to include human factors in the environmental assessment of these reservoirs to ensure more reliable results. A previous study has shown that exceedances of Mn in surface waters correlate significantly with pH and reservoir sediments can release significant amounts of Mn into the water column at reducing environment [28]. The water body is under acidic condition, which can contribute to the release of Mn [29]. Our work found weakly alkaline environment for G-K1 and LD-K7 with pH values of 7.51 and 8.61, respectively, while Mn levels exceeded the standards, which can be attributed to anthropogenic behavior. To ensure the health risks to human beings, the enrichment of Mn in these waters should be further monitored.
Conclusion
The aim of this study is to investigate the enrichment levels, sources and risks of heavy metals in karst water bodies of reservoirs in southwest China. The research findings indicate that pH, ammonia nitrogen, nitrite, and nitrate levels in the Guishi, Lingdong, and Lingshui reservoirs were generally low, except for the Guishi reservoir, where ammonia nitrogen levels exceeded the fifth category of the Chinese Environmental Quality Standard for Surface Water. This finding suggests a negative risk for residents in the surrounding area. Additionally, the surface water levels of Cr, Mn, Co, Ni, Cu, As, Cd, and Pb in the three reservoirs were low, except for some regions of the Guishi and Lingdong reservoirs where Mn levels exceeded the established standard. The assessment of water quality based on HEI and HPI, as well as the human health risk analysis using HQ indicates that the water quality of the three reservoirs posed low health risk to humans. The cluster analysis of heavy metals suggests that trace heavy metals in the surface water of the three reservoirs are primarily derived from natural sources, whereas the excess of Mn in some areas is mainly influenced by anthropogenic activities. Based on these findings, the monitoring and the management of ammonia nitrogen and Mn exceedances are recommended.

