

Introduction
The availability of shallow groundwater resources has attracted attention in coal mining areas, due to its applications as a reliable municipal water source, in agriculture and mineral extraction, as well as in underground engineering construction [1-4]. In the coal mining area, mining has caused water from loose Cenozoic strata and Permian sandstone to infiltrate rapidly into the mine, causing a regional groundwater decrease. Shallow groundwater resources are facing depletion [5-9]. In addition, surface wells are drying up, which affects residents’ domestic water supply [10,11]. However, through a long series of processes, groundwater undergoes a variety of hydrogeochemical processes that lead to water quality deterioration and water resource depletion [12-14].
The evolution of groundwater composition can only be assessed through scientific studies, which are key for water resource management and control. In this regard, water chemistry data from different periods serve as a tool for research. Traditional water chemistry analysis methods such as Piper, Gibbs, and ion scatter diagrams have been widely used to study groundwater types and genesis mechanisms with remarkable results [15-20]. In recent years, multivariate statistical analysis has been widely used to analyze the evolution of groundwater composition. Zhang applied principal component analysis to study the hydrogeochemical evolution of a multi-aquifer system in the Huainan coalfield based on traditional water chemistry analysis and successfully determined the spatial distribution pattern of water-rock interactions [21]. Qu studied groundwater chemistry and quality using traditional multivariate statistical analysis in combination with self-organizing maps and successfully classified groundwater ion variables as well as water sampling sites [22]. Zhang investigated the source and control of groundwater composition in the Huabei coalfield based on conventional water chemistry analysis and multivariate statistical analysis, combined with multiple isotope (2H, 18O, 13C and 34S) verification identification [23, 24]. The above studies only analyzed the present groundwater characteristics, and no systematic analysis of the evolutionary characteristics of groundwater at different times under the influence of coal mining exists. Combining these methods in this study helps to reveal the evolutionary process of groundwater components at the time scale.
The shallow groundwater in the Sunan mining area is seriously affected by mining, and according to the Groundwater Quality Standard, about 90% of the groundwater is Class IV water, which does not meet the standard for residential use [25]. In this paper, we analyze the groundwater quality characteristics of different periods, use cluster analysis and principal component analysis to study the sources of groundwater components and their mechanisms of action in different periods, and use the inverse distance weight (IDW) interpolation method to study the spatial and temporal evolutionary characteristics of groundwater genesis.
Material and Methods
Study Area
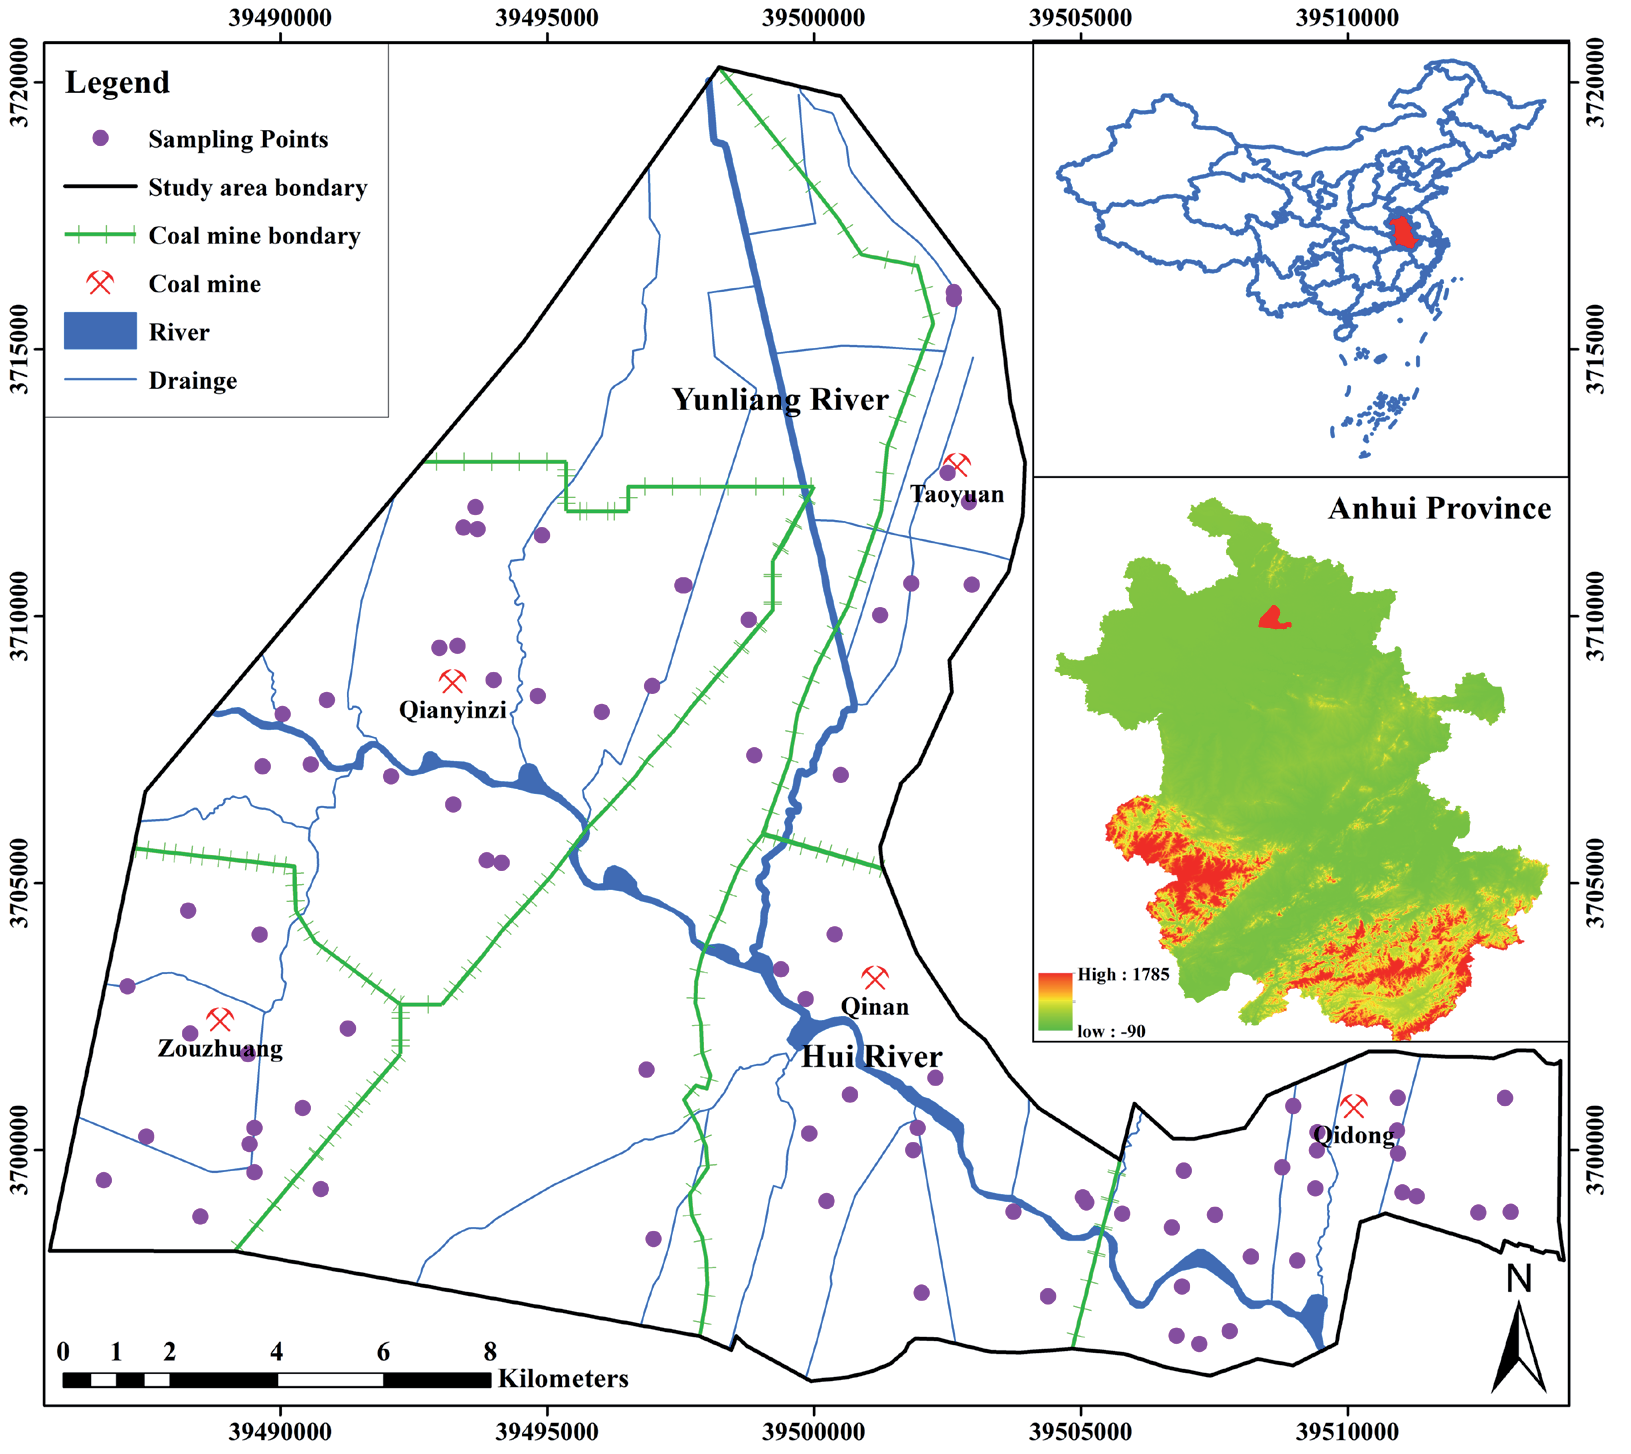
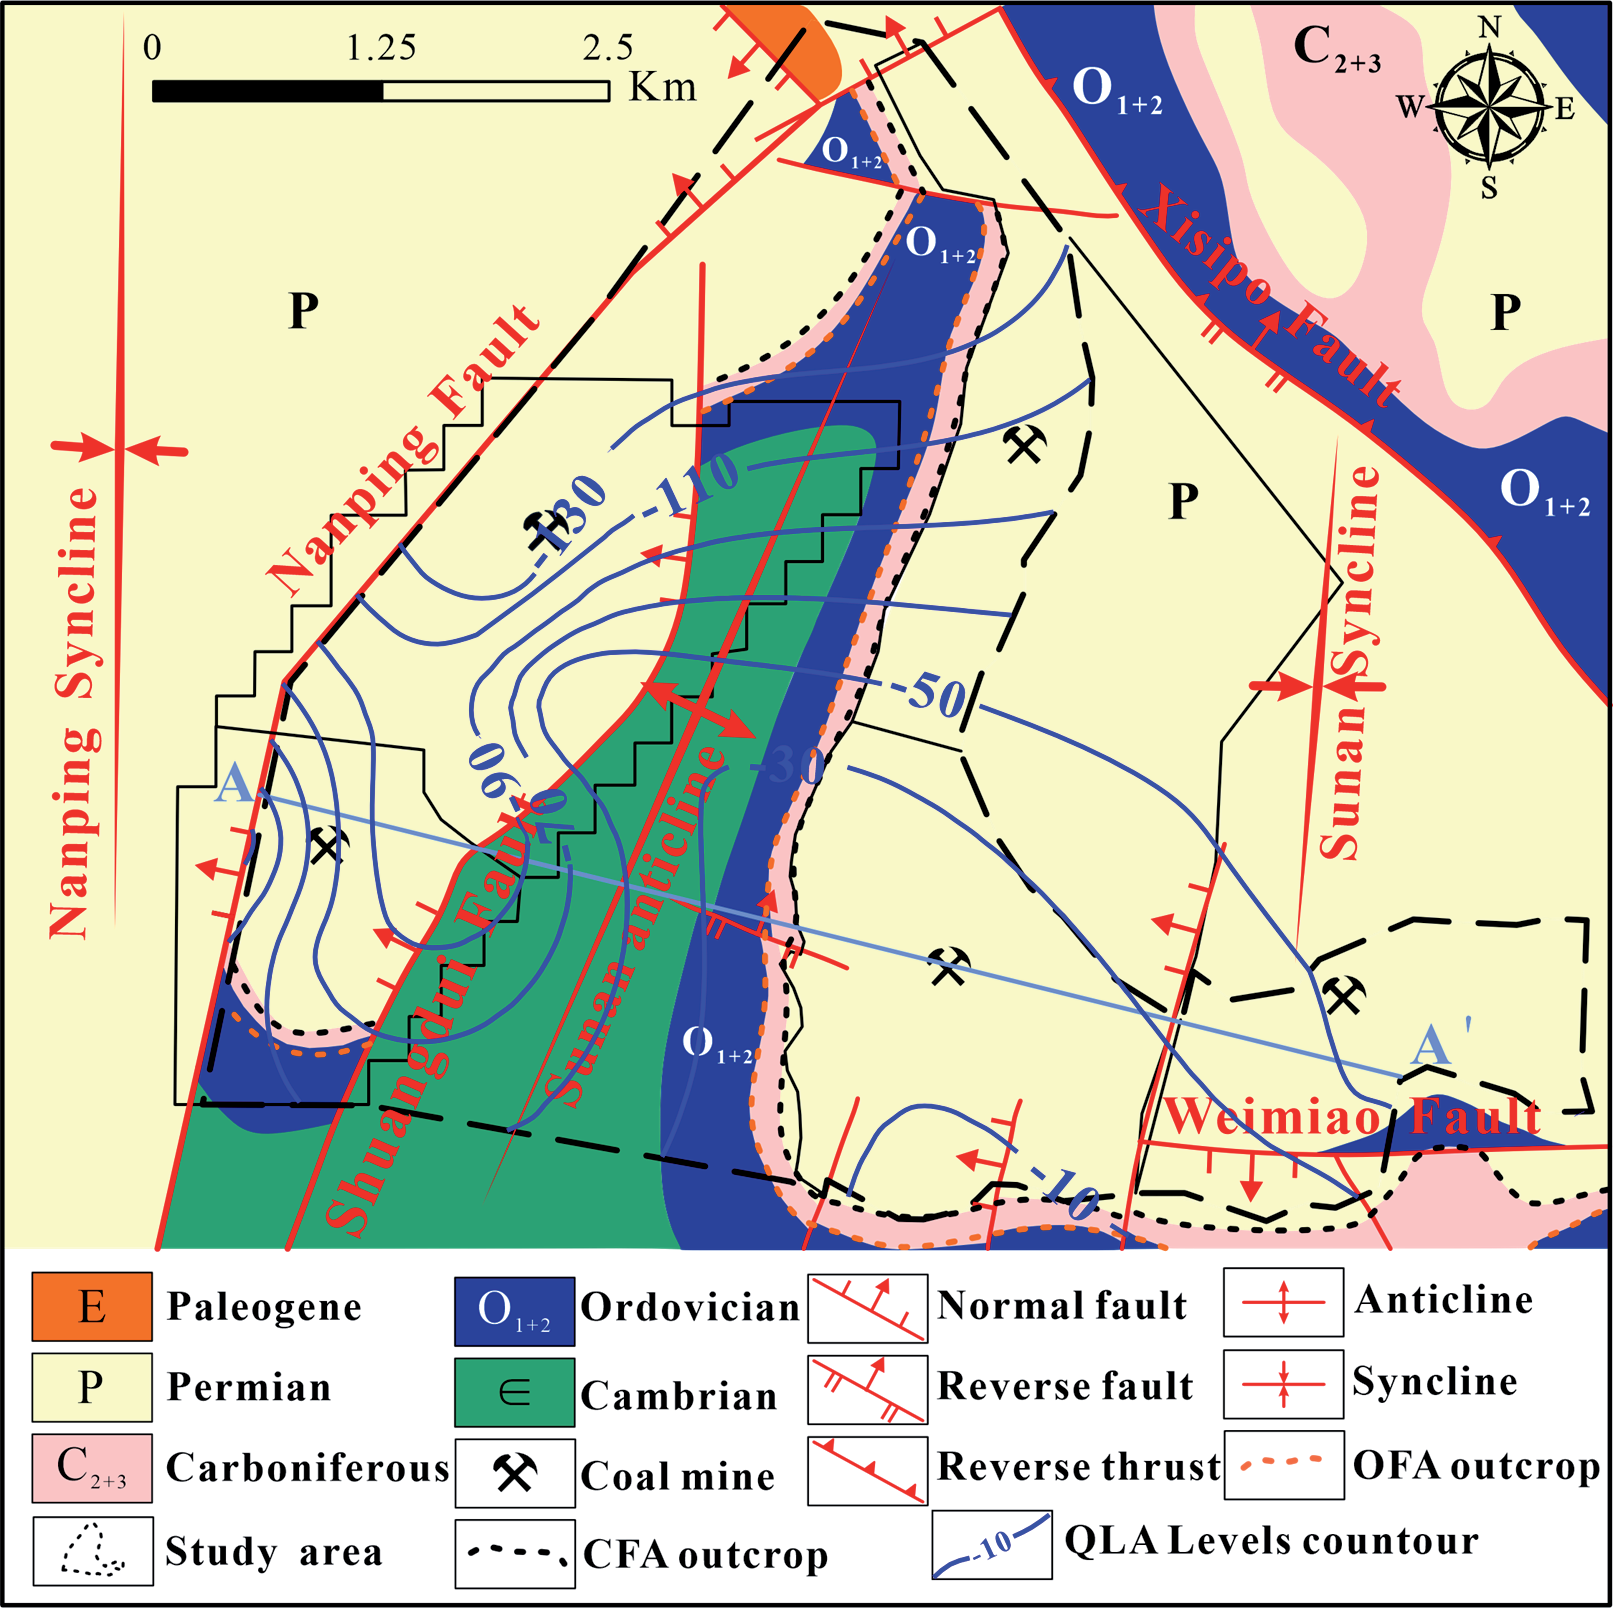
The Sunan Mining District is located in the north of Anhui Province, at the junction of Suzhou City, Huaibei City and Bengbu City (Fig. 1). The altitude of the study area is +23.5~24.5 m, the average annual rainfall is 750-900 m, the average annual temperature is 14~15ºC, the highest temperature is 40.2ºC, and the lowest is -14ºC. There are more northeast winds in spring and autumn, more southeast winds in summer, and more northwest winds in winter. There are a total of five coal mines within mining area, namely Qidong, Qinan, Taoyuan, Qianyingzi, and Zouzhuang. The aquifer system in the Sunan mine area can be divided into four main aquifers, namely Quaternary loose aquifer (QLA), Permian fractured sandstone aquifer (PFA), Carboniferous Taiyuan Formation fractured limestone aquifer (CFA), Ordovician fractured limestone aquifer (OFA) and Cambrian limestone aquifer (CLA). The QLA in the study area is 76.65~251.30 m thick, with an average thickness of 216.16 m. Its thickness variation is controlled by the paleotopography, roughly from north to south, and gradually thickens from east to west. Indeed, groundwater flowed from the south to north in coal mining (Fig. 2). After coal mining, groundwater levels will begin to recover.
Sampling and Testing
In this study, a total of 84 groundwater samples were collected in the Sunan mining area, and the locations of the sampling points are shown in Fig. 1. Sampling was performed using global positioning system (GPS) to record the coordinates of each sampling point. The 500 mL bottles had been rewashed with ultrapure water more than three times before sampling and sealed tightly with caps washed with pure water [7]. During sampling, volatile parameters such as EC and pH were measured using a portable water quality parameter analyzer under minimal atmospheric exposure and stored in a cold environment to prevent water quality changes at high temperatures. Water samples for major cation analysis were acidified with nitric acid to pH<2 [20]. Conventional chemical analysis was done at the School of Earth and Environment of Anhui University of Technology. The method mainly detects conventional ions (K++Na+, Ca2+, Mg2+, SO42-, HCO3-, Cl-).
Results and Discussion
Descriptive Statistics
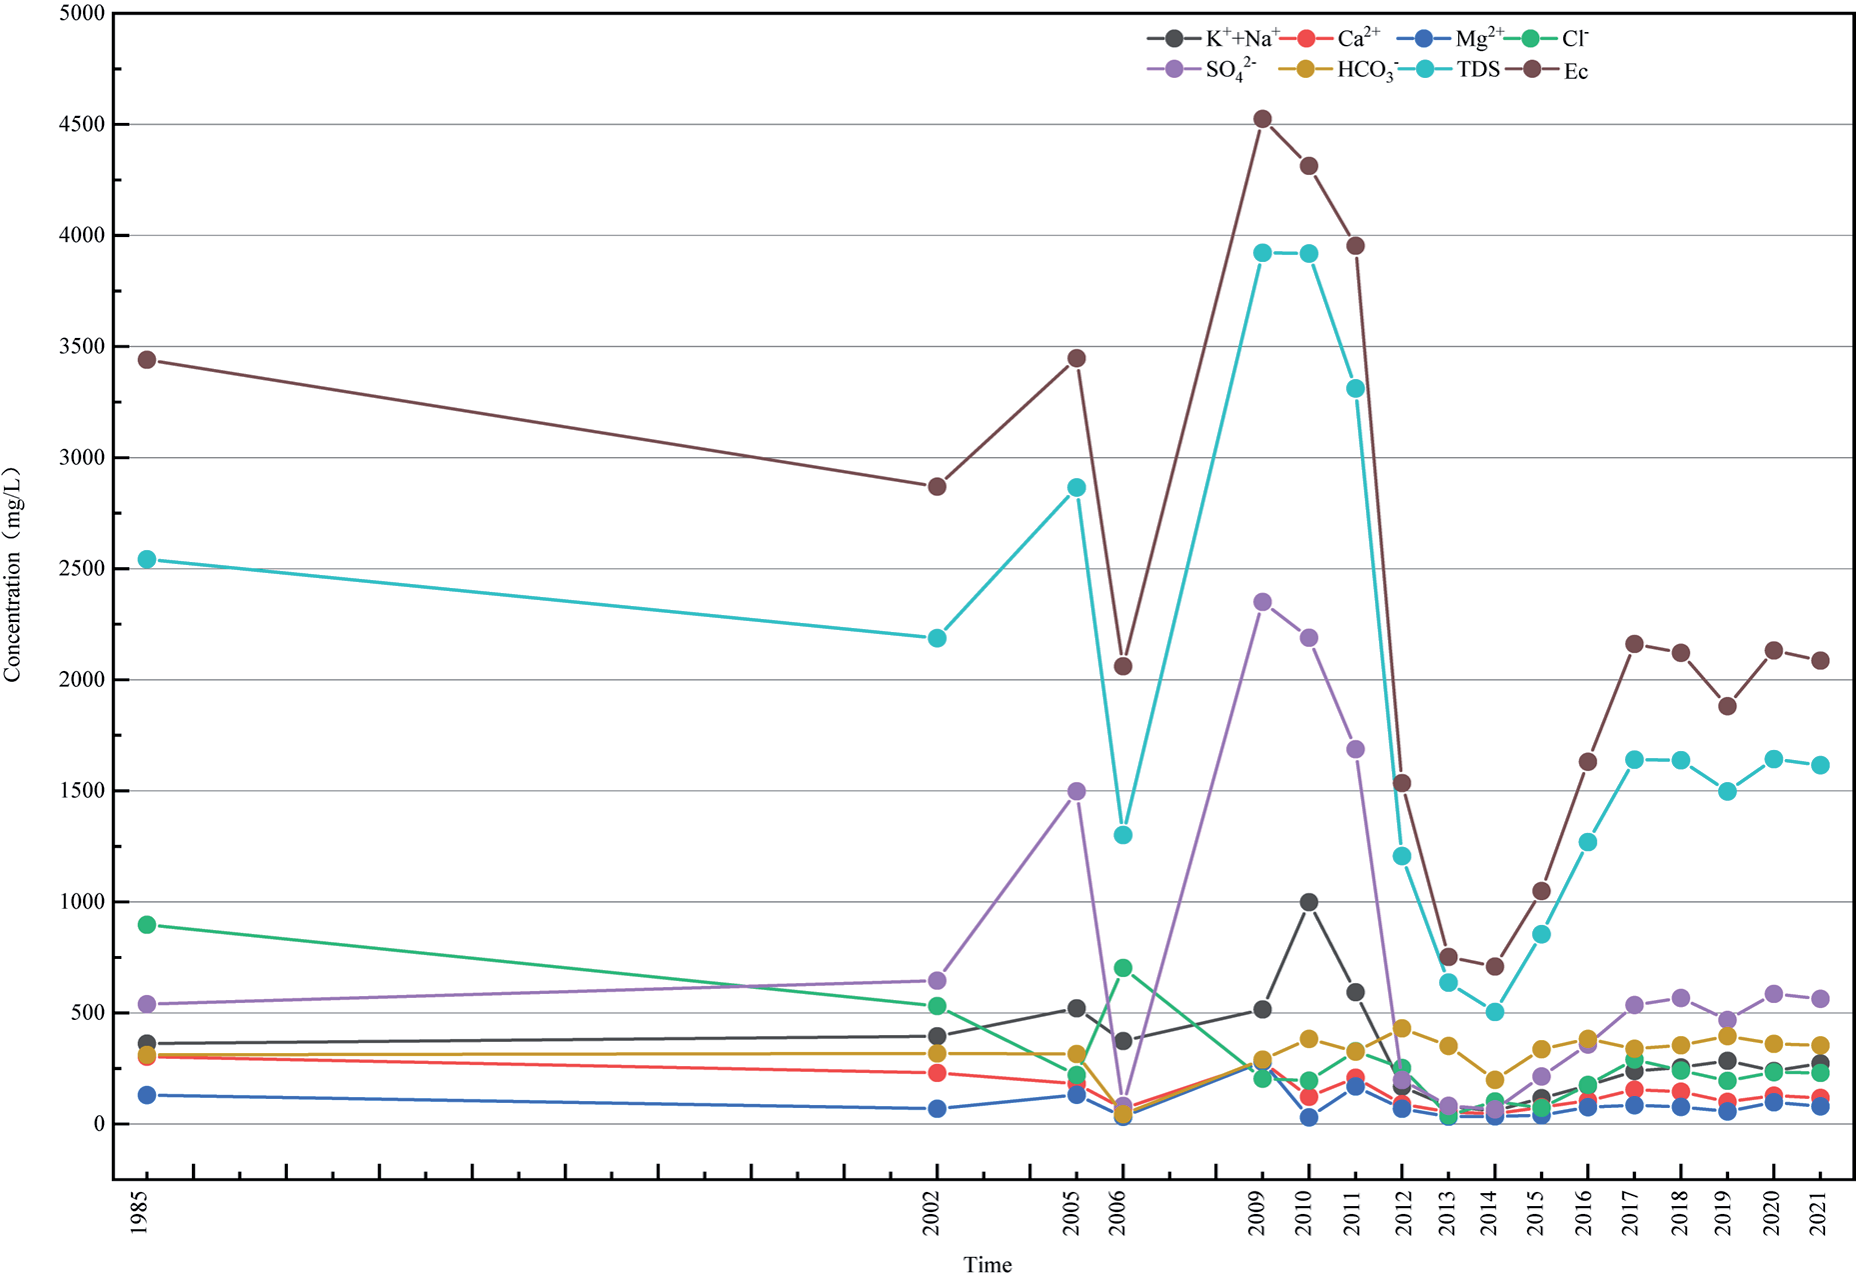
According to the geological and hydrological data from the mine, the Qidong coal mine was built from 1994-2001 and started production after 2002; Qinan coal mine was built in 1992 and started production in 2002; Taoyuan coal mine was built in 1995 and started production in 1996; Zouzhuang coal mine was built in 2009 and started production in 2014; Qiangyingz coal mine was built in 2006-2009 and started production in 2010. The above mines were built and put into operation from 2006-2009 and started production in 2010. The above mine construction and production dates provide the criteria for the classification of groundwater composition data below. The water quality assay information from these mines in previous years was collected and supplemented by water quality data from recent years. The collection and sampling test time period ranged from 1985-2021, and a total of 84 water samples were collected, primarily from the Quaternary loose aquifer (Table 1). The ion balance error (CBE) of all water samples was estimated to be within ±5%, ensuring the quality of the major ion test analysis. The pH value of shallow groundwater in the study area ranged from 7.1 to 10.7, making the groundwater environment neutral to weakly alkaline. The TDS of the water samples ranged from 306.2 to 5183.9 mg/L. The content characteristics of each aquifer component varied significantly, and the variation coefficients of each component of the QLA were generally large, indicating the existence of a certain degree of variation in groundwater hydrogeochemistry in various periods, which requires further exploration. The physicochemical parameters were averaged for each year in the QLA water, and the graphs of the physicochemical parameters over time were plotted (Fig. 3). The overall curves of ionic fractions in all aquifers remained basically the same in terms of magnitude, where the TDS and conductivity trends with time were exactly the same, indicating a linear correlation between them. According to the national Groundwater Quality Standard (GB/T 14848-2017), TDS, SO42-, and Na+, part of the judging indices for domestic drinking water sources, exceed the III water standard and are unsuitable for use as domestic drinking water. In Fig. 3, the peaks of all components except for Cl- are around 2011, after 2011 all mines had begun production, resulting in high levels of all components. Among them, SO42- was higher in 2009- 2011. Na+, Mg2+, and Ca2+ also increased, the natural cause of which is most likely sulfate dissolution as well as anthropogenic indirect recharge of agricultural fertilizers and pesticides into the loose aquifer through irrigation infiltration.
Correlation Analysis
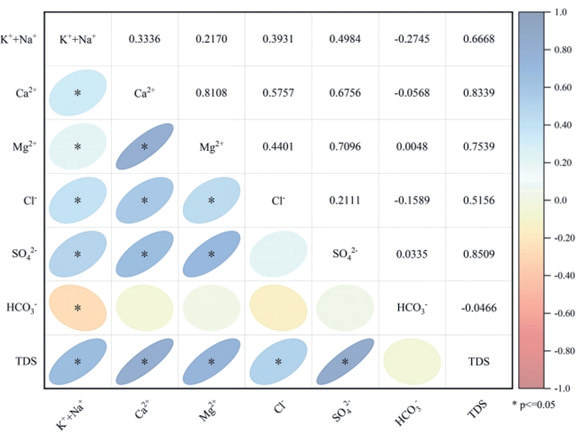
Normality test can examine whether quantitative data have normal distribution characteristics; Shapiro-Wilk (S-W) test is recommended for small samples (less than 50), and Kolmogorov-Smirnov (K-S) test is recommended for large samples (more than 50) [26]. As shown in Table 2, normality tests are performed for K++Na+, Ca2+, Mg2+, Cl-, SO42-, HCO3- and TDS. The sample size of this paper is more than 50, so Kolmogorov-Smirnov test is used. Judging whether the statistic shows significance (p value less than 0.05 or 0.01), if it shows significance, it means that the item does not have normal distribution characteristics, if it does not show significance (p>0.05), it means that the item has normal distribution characteristics. Specifically, in QLA water, Mg2+, Cl-, SO42-, HCO3- and TDS do not have normality, K++Na+ and Ca2+ have normality. Since the data for most of the variables were non-normally distributed, the Spearman correlation coefficient was used to calculate the bivariate correlations, and the correlation heat map for QLA was plotted using R software (Fig. 4). Groundwater genesis can be indicated by changes in a variety of water sample indicators. Correlation analysis among data variables is a common analytical method in statistics and is commonly applied in groundwater environmental chemistry, which can infer physicochemical reactions occurring in groundwater in complex environments and initially reveal the cause of groundwater genesis. In the QLA (Fig. 4), Cl- and SO42- significantly positively correlate with Ca2+, Mg2+, and K++Na+ at the 0.05 level, while HCO3- negatively correlates with all other cations such as Cl-, indicating that the cations in this aquifer originate from halite dissolution.
Table 1.
Descriptive statistics of main parameters of the QLA in the study area.
Hierarchical Cluster Analysis
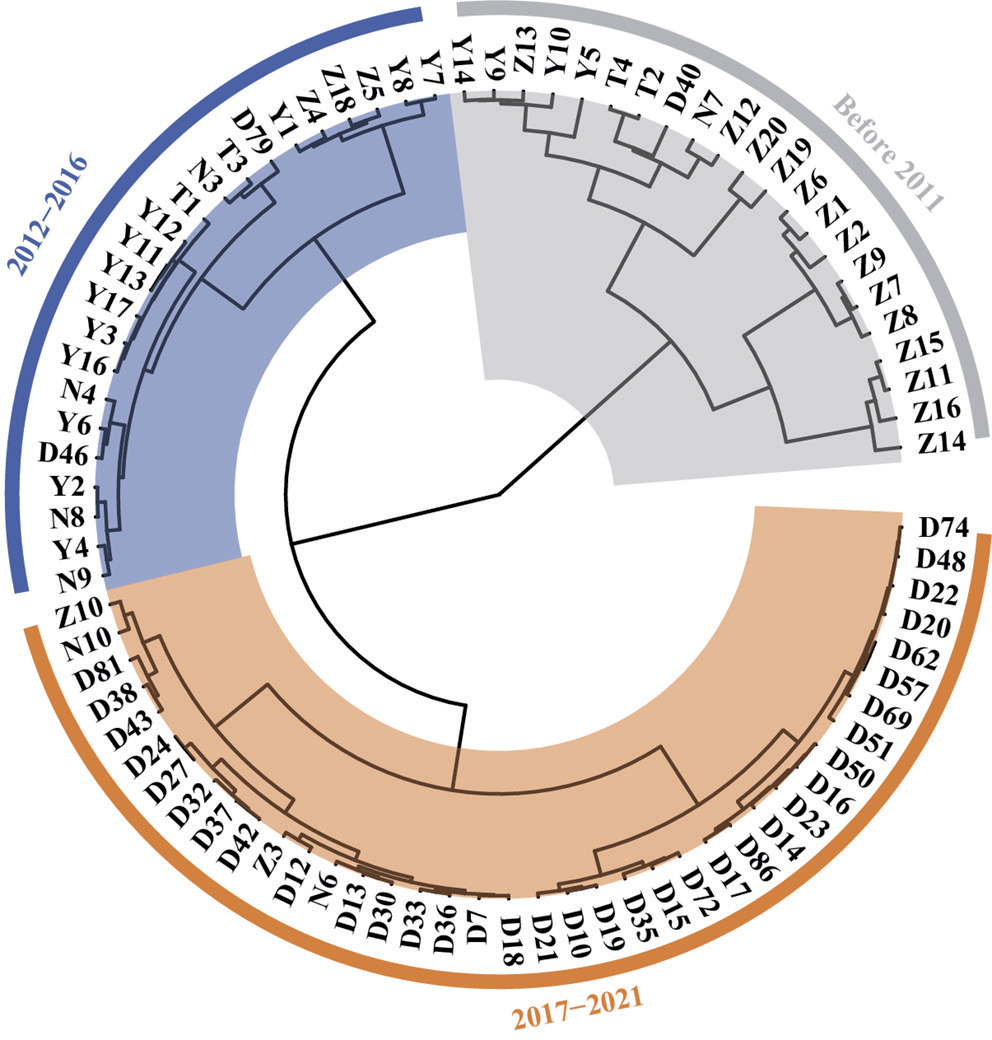
Since the collected data were from 1985 to 2021, the preliminary analysis combined with the previous section showed that groundwater chemistry clearly changed to varying degrees over a period of more than 30 years. When the aquifer is subjected to external disturbance under conditions similar to the aquifer endowment environment, insignificant short term changes in water chemistry generally occur. Therefore, Q-type clustering analysis of water sample data from the same aquifer is needed to determine if the clustering is on the time scale [4]. The object of Q-type hierarchical clustering analysis is primarily water sample analysis, using Euclidean distance as the metric as well as the Wald clustering method (Fig. 5). Based on the clustering results in relation to the temporal sequence, combined with the time of well construction and degree of extraction for each mine, they can be roughly divided into three stages: the early well construction stage (before 2011); middle extraction stage (2012-2016); and late extraction stage (2017-2021).
Hydrochemical Facies
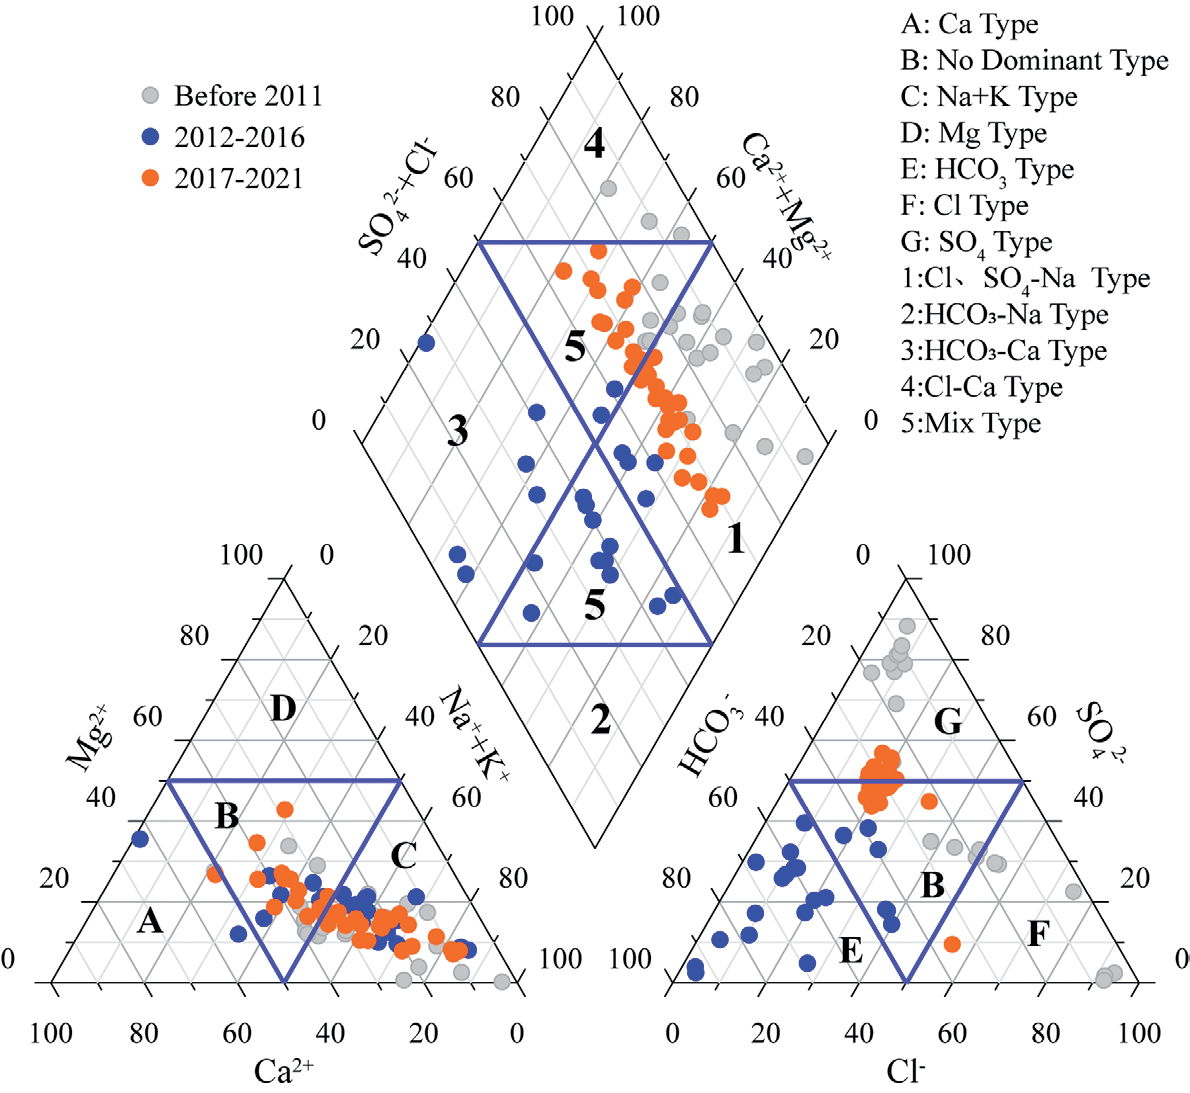
Piper trilinear diagrams were plotted for the fourth series loose water constant element data based from three time periods. The water chemical phase of the fourth series contains primarily Cl·SO4-Na·Ca at the early stage of mining (before 2011), HCO3-Na·Ca at the middle stage (2012-2016), and gradually evolves to SO4-Na·Ca in the later stage (2017-2021), indicating that the groundwater is gradually “desalinated”, probably due to rapid groundwater flow caused by mining disturbances (Fig. 6).
Source Analysis of Ca2+, Mg2+, SO42- and HCO3-.
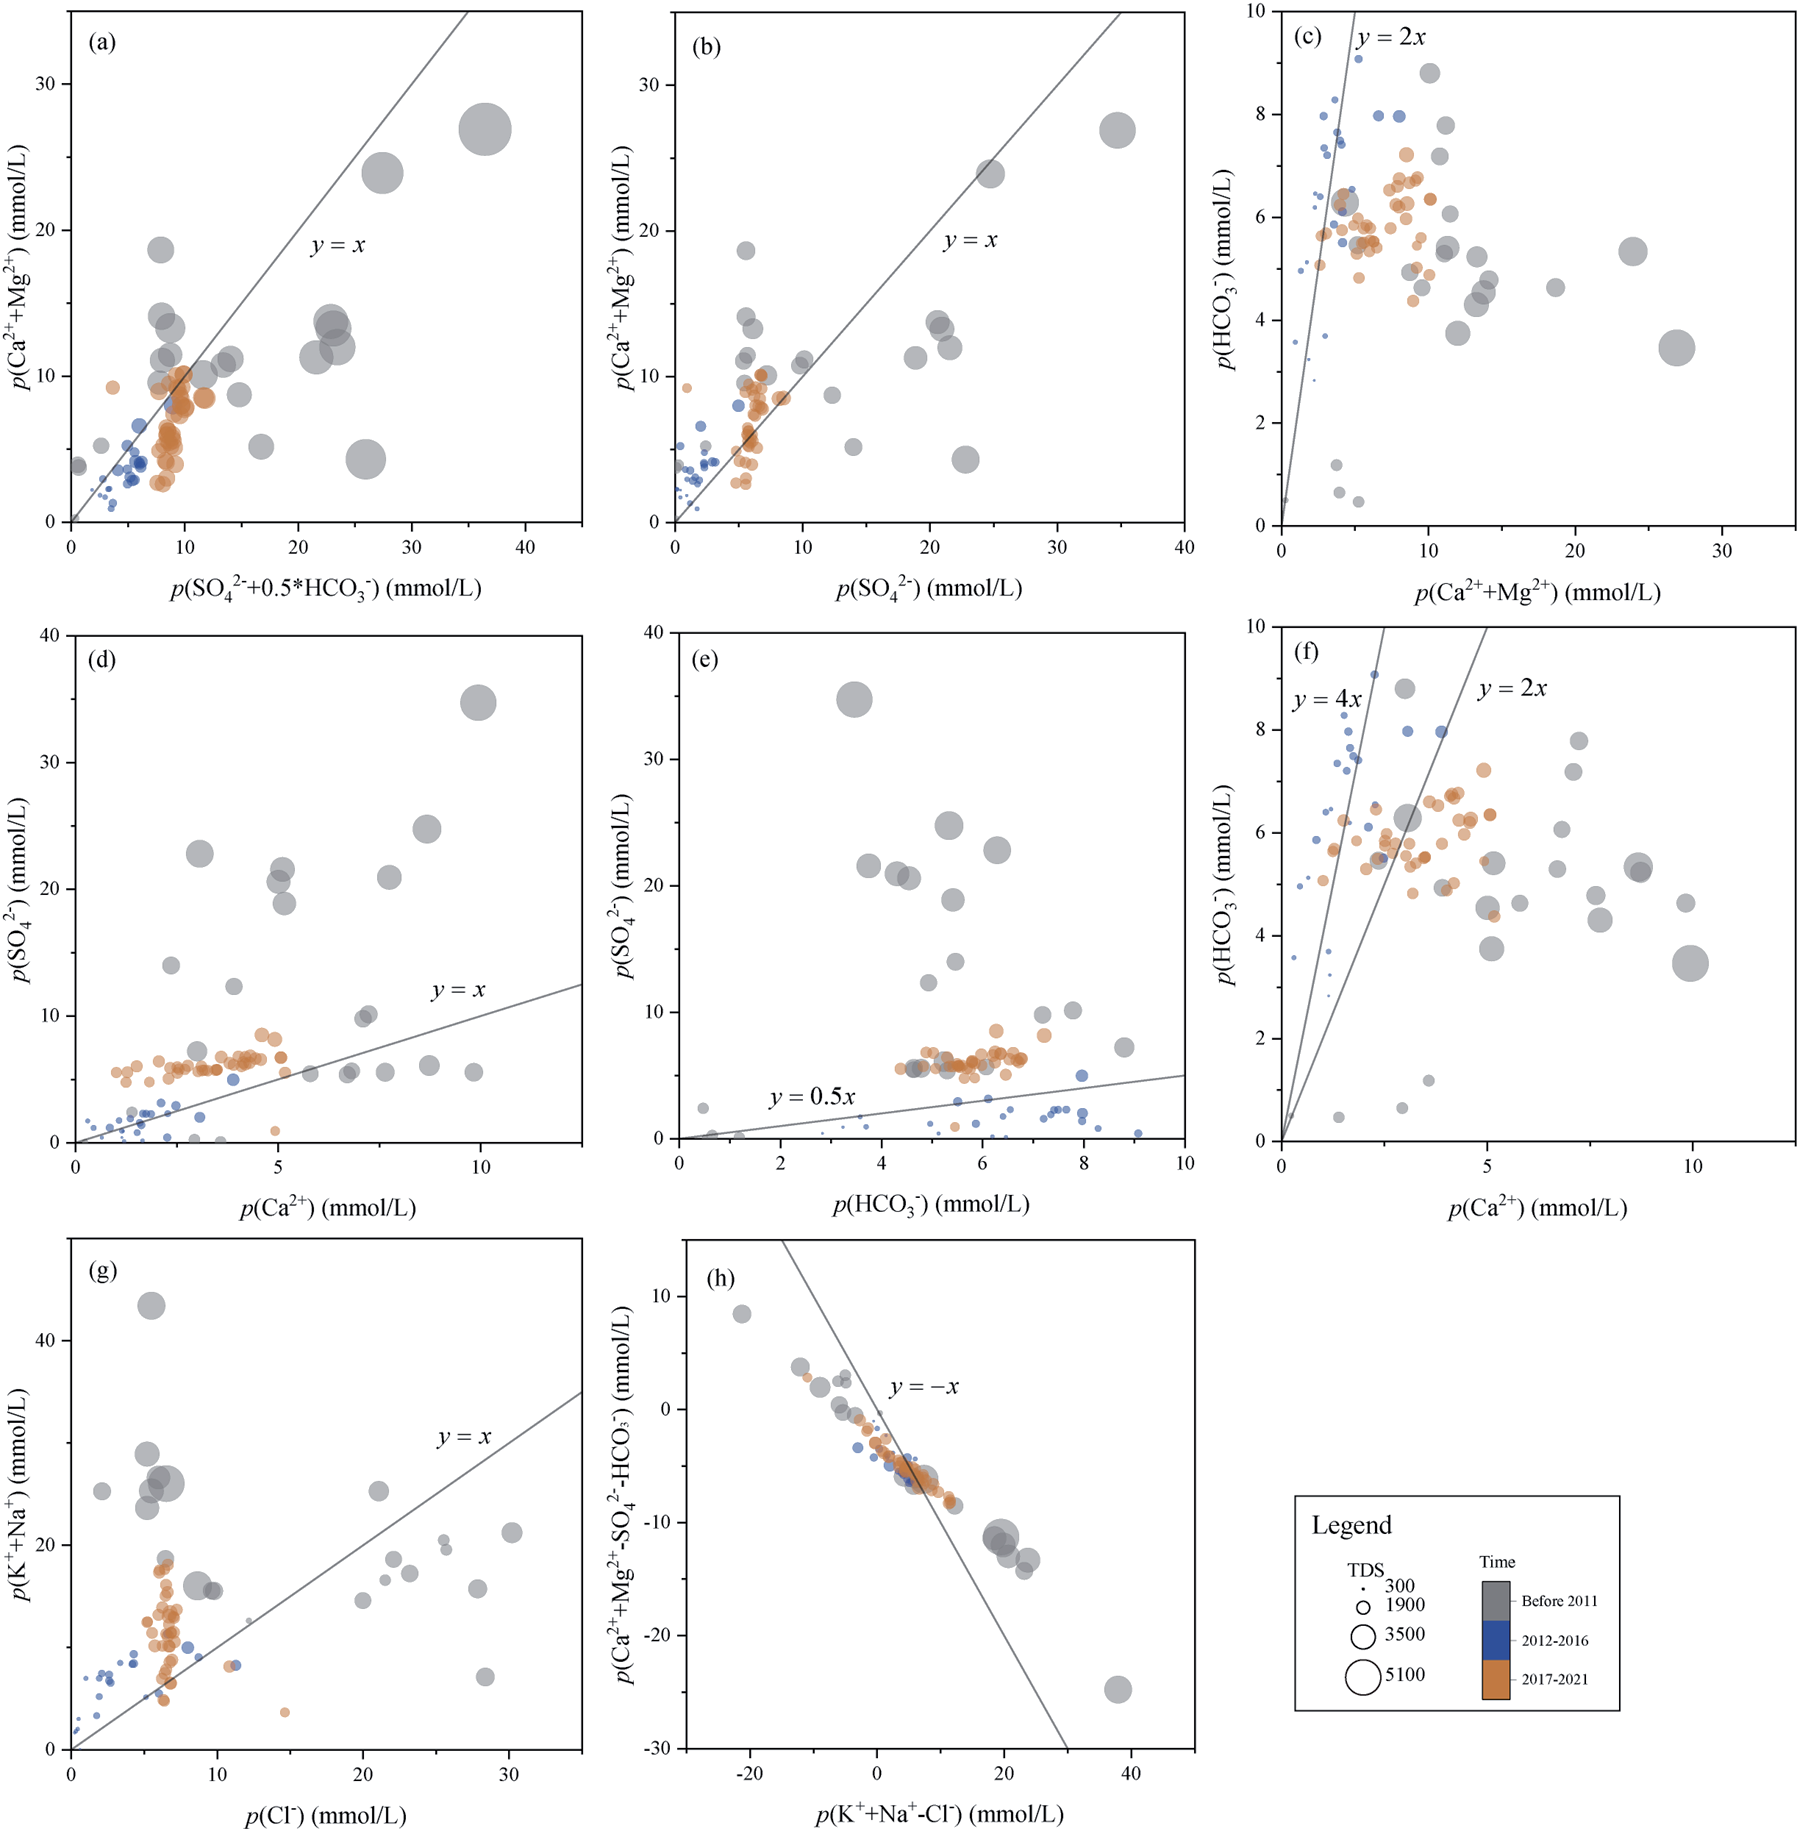
In the QLA (Fig. 7), the ratio of p(Ca2++Mg2+) to p(SO42-+0.5HCO3-) was close to 1 for most of the water samples (Fig. 7a), indicating that Ca2+ and Mg2+ in groundwater primarily originated from carbonate and sulfate dissolution [8]. The dissolution effect is more significant in the middle extraction stage than other stages, and a small number of water sample points are located below the y = x line, which may be related to cation exchange and desulfation, resulting in lower Ca2+ and Mg2+. The majority of water sample points in each period are located above and below the y = x line, indicating that the SO42- in these water samples is primarily sourced from gypsum dissolution (Fig. 7b) [9]. However, Ca2+ and Mg2+ concentrations were significantly higher in some water sample sites before 2011 than in other periods, which may be related to the fact that the water sample sites were characterized by a weakly acidic environment. The chemical reaction of H+ in weak acids with carbonate minerals leads to an increase in Ca2+ and Mg2+ content (Fig. 7e), with some water samples before 2011 having a p(SO42-) to p(HCO3-) ratio greater than 0.5. In Fig. 7c), most of the water samples lie below the straight line y = 2x, indicating that Ca2+ in groundwater in the late extraction period originates not only from carbonate dissolution but also cation exchange and sulfate dissolution, while the early and middle extraction periods are primarily associated with carbonate dissolution [10]. A majority of the water sample points in Fig. 7d) are located on the y = x line, indicating the presence of gypsum dissolution in all phases of the aquifer. The molar ratio of HCO3- and Ca2+ reflects the dissolution, cation exchange or desulfation of carbonate minerals[11]. A p(HCO3-) to p(Ca2+) ratio of 2 indicates that HCO3- and Ca2+ originate from calcite dissolution only, and a ratio of 4 indicates only dolomite dissolution. y = 2x and y = 4x divide the whole scatter plot into three parts, and the lower region shows relatively low HCO3-, which may be related to the water sample sites being in a weakly acid environment, resulting in high Ca2+, and the region contains all the water sample sites from before 2011 (Fig. 7f). The increased HCO3- in the middle region, where most of the water sample points belong to the middle and late extraction stages indicates that dolomite and calcite dissolution as well as cation exchange occurred.
Source Analysis of K++Na+ and Cl-
In general, Cl- concentration is relatively stable in groundwater, so the ratio of K++Na+ to Cl- is commonly used to determine the source of K++Na+ [22, 23]. The ratio of p(K++Na+) to p(Cl-) in most of the water sample points in each period was greater than 1, indicating that halite dissolution, cation exchange and evaporation effects occurred, and the ratio concentration for some of the four water sample points in the early extraction stage was less than 1 (Fig. 7g). The high Cl- content may be related to anthropogenic activities. All the water samples in each period are distributed above and below the y = -x line, confirming the existence of cation exchange (Fig. 7h).
Principal Component Analysis
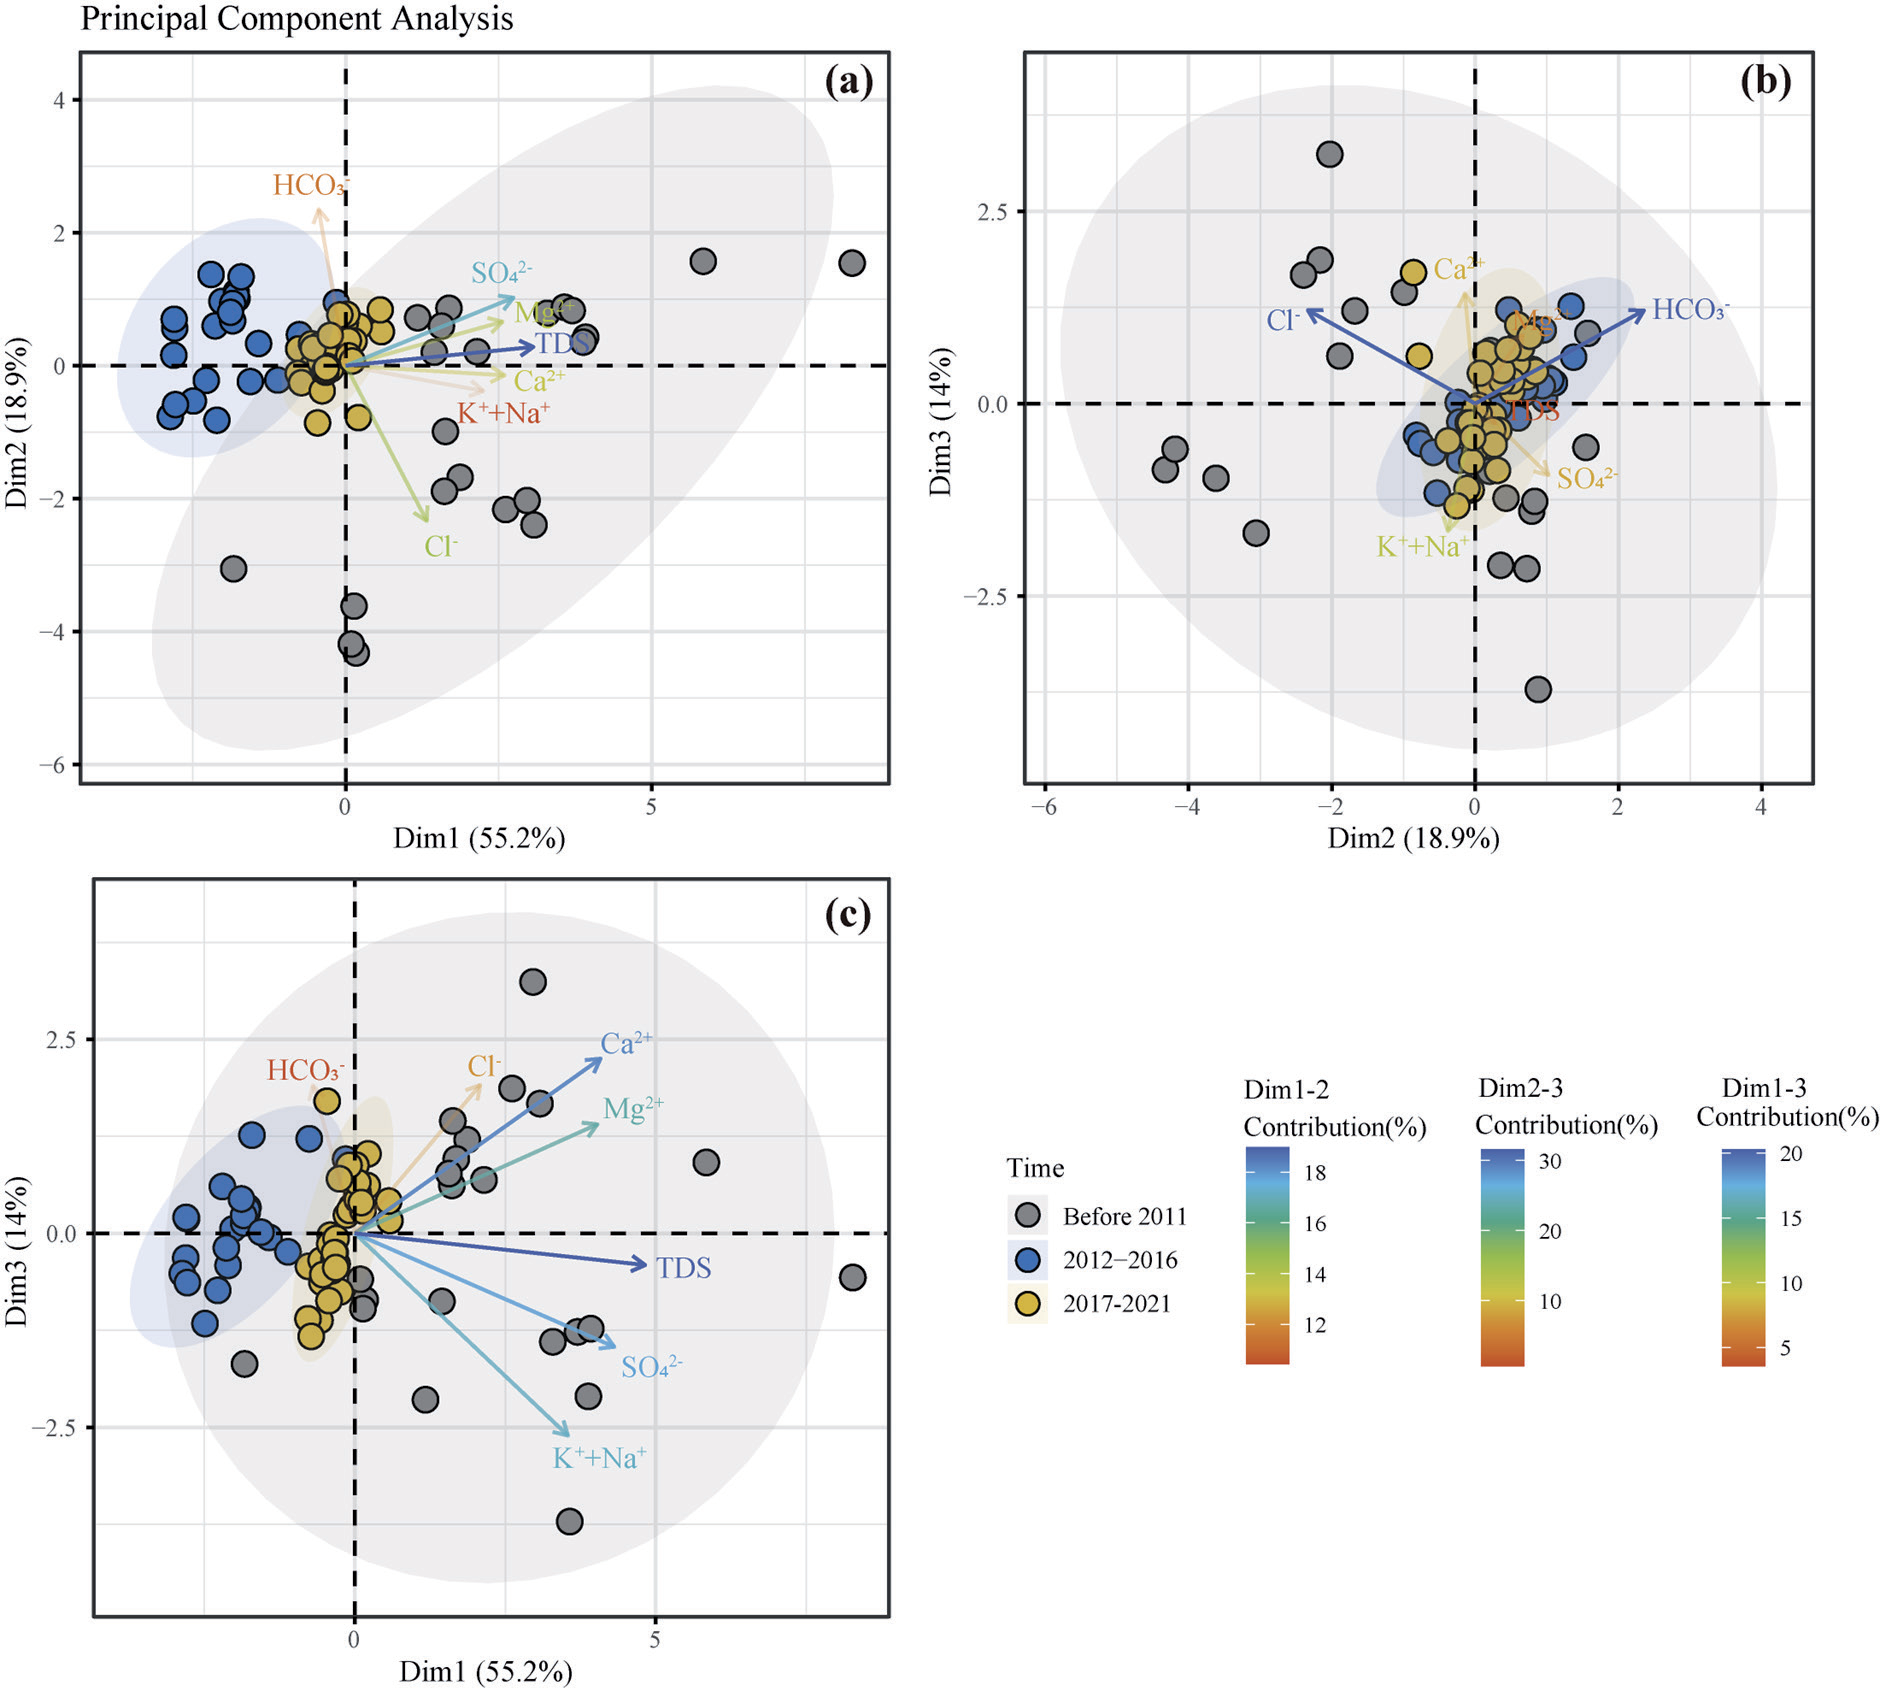
Principal component analysis (PCA) helps to summarize and visualize information in a sample dataset containing multiple variables of interest described by multiple variables. Each variable can be viewed as a different dimension, and it is difficult to visualize a multidimensional space if there are more than three variables in the dataset [15]. In other words, PCA reduces the dimensionality of multivariate data into two or three principal components within a visual graphical representation that minimizes information loss [23]. The primary purposes of using principal components for groundwater macronutrients in this paper are to identify the implied hydrochemical genesis mechanisms in groundwater macronutrient components, to reduce the dimensionality of variables by eliminating noise and redundancy in water sample variable data, and to identify relevant ionic variables. Three principal components, Dim1, Dim2, and Dim3, were extracted from the aquifer using the Kaiser criterion method and the gravel plot method (Fig. 8) [27].
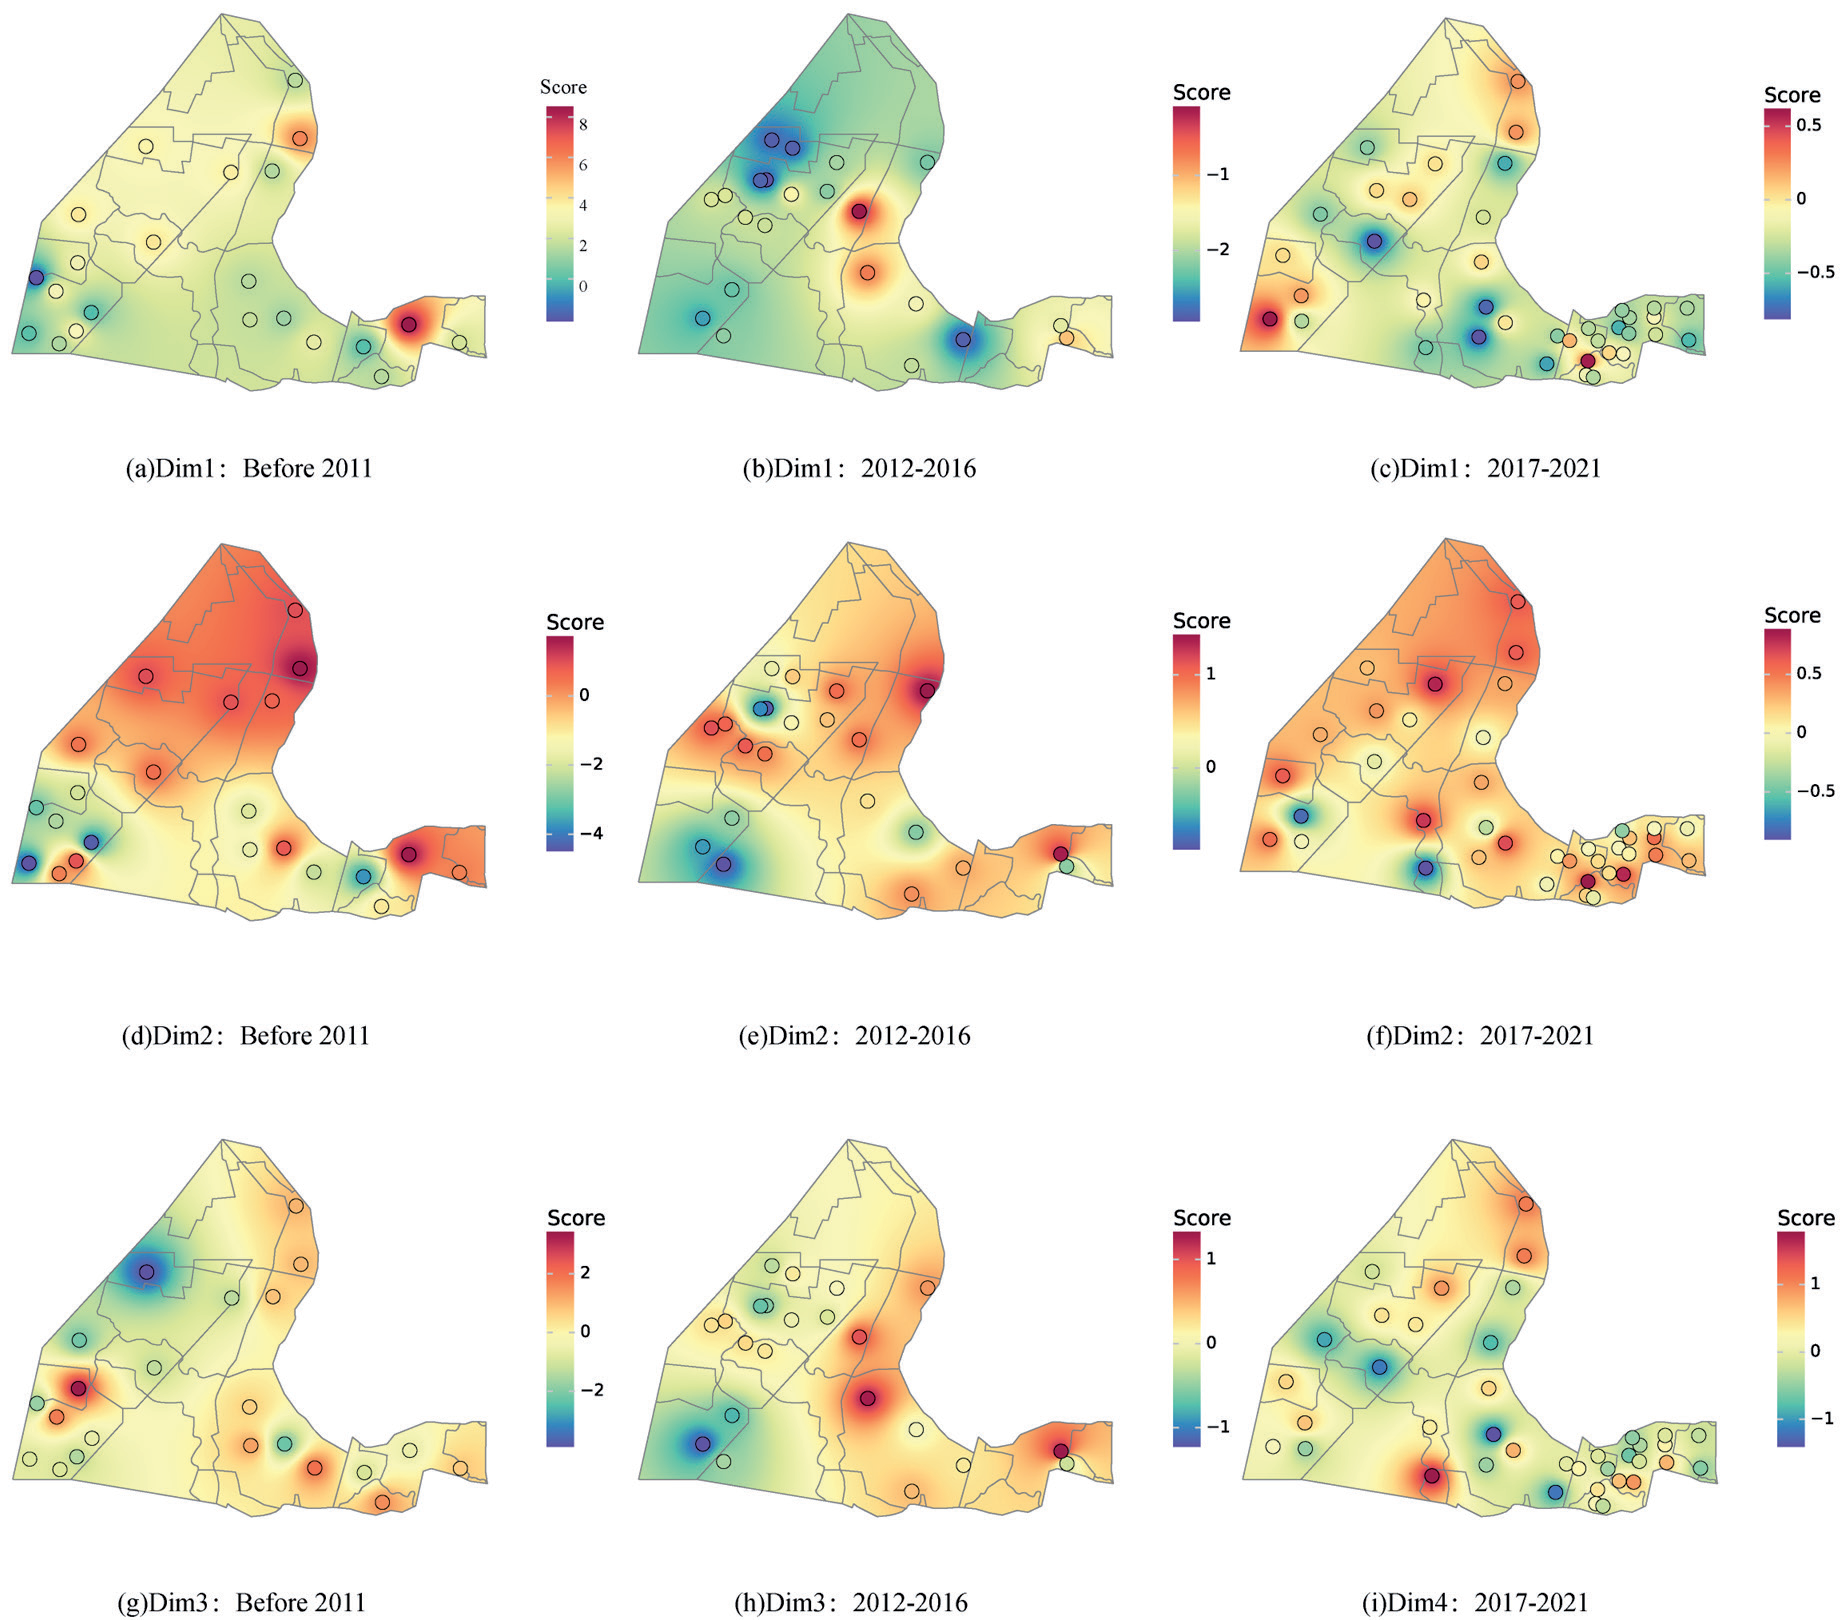
The cumulative variance contribution is 88.1% in the loose aquifer of the Fourth Series, and 55.2%, 18.9%, and 14% in Dim1, Dim2, and Dim3, respectively. The ion vectors in Figs. 8(a-c) show that Dim1 is primarily composed of K++Na+, TDS, Ca2+, and SO42, indicating that the Dim1 axis represents sulfate dissolution, Dim2 is primarily composed of SO42- and HCO3-, which is due to desulfurization, and Dim3 is primarily composed of Ca2+, Mg2+ and HCO3-, which is due to dolomite dissolution.
The spatial and temporal evolution of the Quaternary loose water hydrogeochemistry of each mine is shown in Figs 9(a-i). In the early mining stage, the score value from north to south gradually decreases (Fig. 9(a, d)), indicating that sulfate dissolution and desulfurization decrease, which is due to the fact that the water containing four is flowing from south to north (Fig. 2), the north is the runoff area, the groundwater and mineral action time is short, and the sulfate dissolution and desulfurization are relatively strong. The low scale score zone appears in the northern part of Qianyingzi coal mine (Fig. 9g) is due to the drainage area, slow groundwater flow, and weak dolomite dissolution in this area. In the middle of mining, Dim1 is basically negative (Fig. 9b), so the sulfate dissolution effect is weak in the Suinan mine, while Dim2 and Dim3 are positive in all other areas except for the low value area in Zouzhuang coal mine, indicating that dolomite dissolution and desulfation are dominant at this time, but the degree of the effect is weak compared with the early mining stage. In the final mining stage, Dim1, Dim2, and Dim3 in the northern part of the Sunan mine were significantly higher than those in the southern part (Fig. 9(c, f)), indicating that sulfate, dolomite dissolution, and desulfurization were stronger in the north, and only the degree of desulfurization was stronger compared to the early and middle stages, while all other effects were weaker compared to the first and middle stages.
Conclusions
Groundwater environmental destabilization due to the influence of mining activities is common in coal mining regions. The water quality types, water-rock actions, and hydrogeochemical spatial distribution characteristics of shallow groundwater were studied, and the following conclusions were drawn.
(1) Groundwater runoff is accelerated by mining, and groundwater quality evolves from Cl·SO4-Na·Ca type in the early mining stage to HCO3-Na·Ca type in the middle mining stage, and to SO4-Na·Ca type in the late mining stage.
(2) Halite dissolution and cation exchange occurred throughout the mining process. Among them, sulfate dissolution and dolomite dissolution primarily occurred in the early mining stage, and desulfate action as well as dolomite dissolution dominated in the middle and final mining stages.
(3) In the early mining stage, sulfate dissolution and desulfation are strong in the northern study area, while dolomite dissolution is weak. In the middle mining stage, to dolomite dissolution and desulfation are weak, with almost no sulfate dissolution. Sulfate and dolomite dissolution and desulfation are stronger in the northern part of the mining area than in the middle part of the mining area. Coal mining destroys the overlying rock structure to produce fissures, which accelerates groundwater flow and accelerates the dissolution of minerals and chemical reactions. The degree of water-rock action in the northern part of the study area is large, and the mineralization of groundwater is large, due to strength management and control to prevent further groundwater deterioration.

