Introduction
Mine mining activities have caused inevitable pollution and damage to surface water and groundwater [1]. Coal mining activities have led to the destruction of aquifer levels, a decline in groundwater levels, poor water quality, and a decrease in spring flow [2, 3]. Since the 1990s, with the closure of a large number of mines in Yunnan province, pit mine water may enter the adjacent soil-groundwater system, causing regional soil and groundwater pollution [4, 5]. Pit water, washing wastewater and leaching water from waste heap produced during coal mine production are the main sources of soil and water pollution, resulting in the exceedance of S, Fe, Mn and other indicators in the water bodies around the mine catchment area, and a tight supply of safe domestic water in the mine catchment area [6].
In recent years, the contradiction between the demand for water resources and the lack of resource storage has become increasingly intense. Years of underground coal mining has led to the destruction of aquifers, a general decline in the groundwater level, depletion of springs, deterioration of water quality, and an increase in the depth of mining wells year by year [7]. The irrigation of polluted water has led to increasing contamination in the soil, resulting in contaminated crops and vegetable also has seriously affected human health [8-10]. The shortage of water resources and the scientific and rational use of the problem has become an important challenge for the sustainable development of the economy. The mining concentration area of Fuyuan Laochang is one of the most prominent mining catchment areas in Yunnan, with more prominent environmental problems, among which water and soil environmental pollution caused by coal mines is the most prominent. Therefore, there is an urgent need to conduct systematic research on scientific issues such as the source and recharge mode of groundwater in the study area, in order to clarify the recharge mechanism and transport characteristics of groundwater in the typical basin of Rongjia River in Laochang, the degree of influence of surface water and groundwater transformation relationship on groundwater, and to promote the rational use of local water resources.
Stable hydrogen-oxygen isotope and water chemistry methods are effective methods for analyzing groundwater circulation, recharge sources and transformations, and are also the basis for understanding the conditions for recharge of drainage runoff in the mine and for determining the specific location of the source of sudden water in the mine [11-13], as well as for speculating the main sources of water chemistry in groundwater in the mine and the mechanism of its formation [14]. Wang et al. [15] used hydrogen-oxygen isotope methods and scanning electron microscopy of subminerals to conclude that the mineralizing fluids of the three mineralizations have different geochemical characteristics. Hao et al. [16] explored the causes of isotopic drift phenomenon and revealed the isotopic drift characteristics of karst water in Ordovician tuffs caused by coal mining. Chen et al. [17] used stable hydrogen-oxygen isotope and water chemistry to find that the mineralizing fluid of the Nuri deposit was a relatively high-temperature, highly mineralized magmatic fluid that mixed with low-temperature, low-mineralized atmospheric water during evolution. These studies have greatly improved the understanding of regional water cycle processes and laid the scientific foundation for the rational use of regional water resources. In general, many previous works have been carried out mainly from coal gangue leaching and surface groundwater pollution in mining areas, but the study of groundwater recharge-runoff-discharge relationship and groundwater chemical characteristics of different strata in the tectonic zone by analyzing typical watershed as a unit can be rare.
Based on the current limitations, we analyze the characteristics of the hydrochemical composition of surface water and groundwater and the sources of the main ions in groundwater through field sampling investigation and indoor analysis, using surface groundwater hydrogen and oxygen isotope techniques combined with water chemistry analysis methods and regional geological characteristics, to clarify the constraints on the evolution of groundwater and the spatial composition of hydrogen and oxygen isotopes, to clarify the main sources of recharge between surface water and groundwater, and to clarify the hydrological characteristics such as inter-recharge and inter-transformation relationships. It also provides a basis for rational development, protection and utilization of groundwater resources and evaluation of water quality in the mine area, and is of great significance for the study of the chemical causes and evolution of the groundwater in the old plant mine.
Materials and Methods
Sample Collection
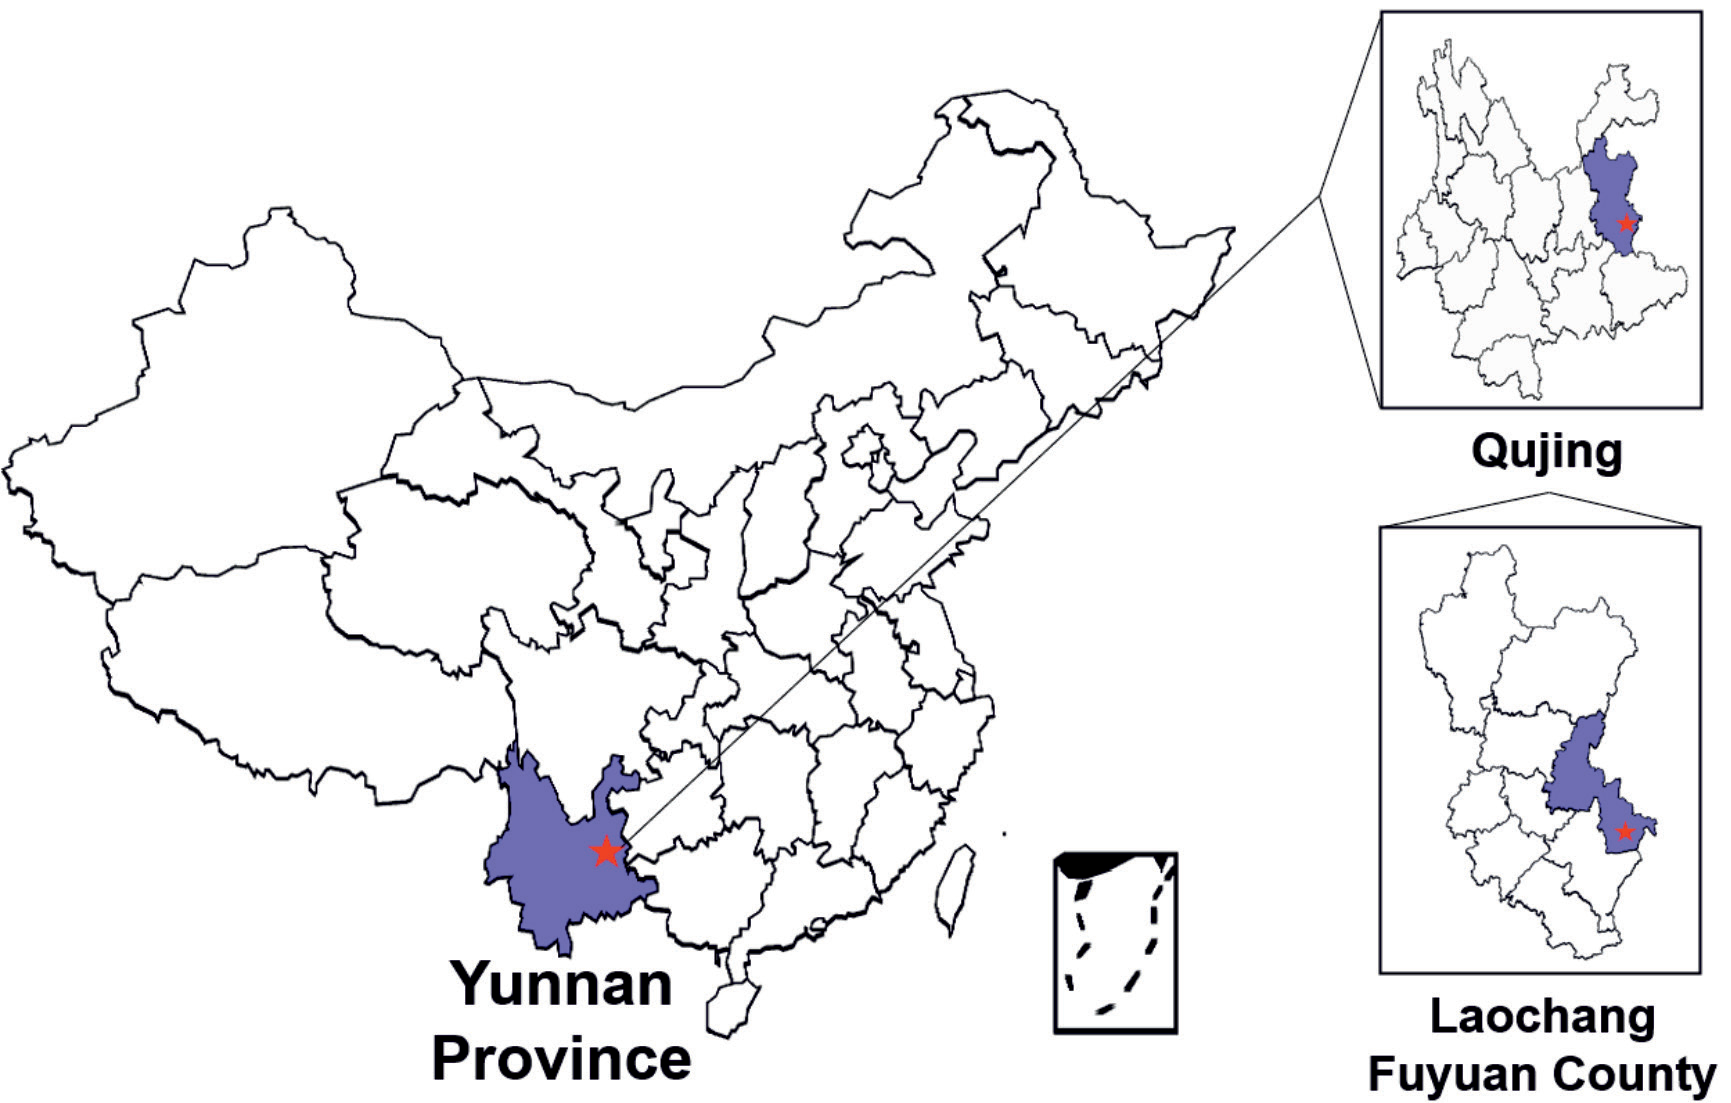
The study area is located in Laochang Town in the southeastern part of Fuyuan County, adjacent to Huangnihe Town in the east, with the geographical location ranging from 104°30′ to 104°35′E and 25°11′ to 25°16′N (Fig. 1). The area of Laochang Town is about 236 km2, and the terrain is mainly mountainous, with elevation of 1480~2460 m, of which the karst area is about 159 km2, located in the subtropical plateau monsoon climate area, with obvious three-dimensional climate, annual average temperature of 11-14ºC, rainfall mostly concentrated in May-October, annual rainfall of 1100-1500 mm, and average evaporation of 1885.5 mm. The regional geological work area is located in the old plant tectonic zone, which is oriented at 40°-45°N.E., with a length of about 20 km and a width of about 6 km.
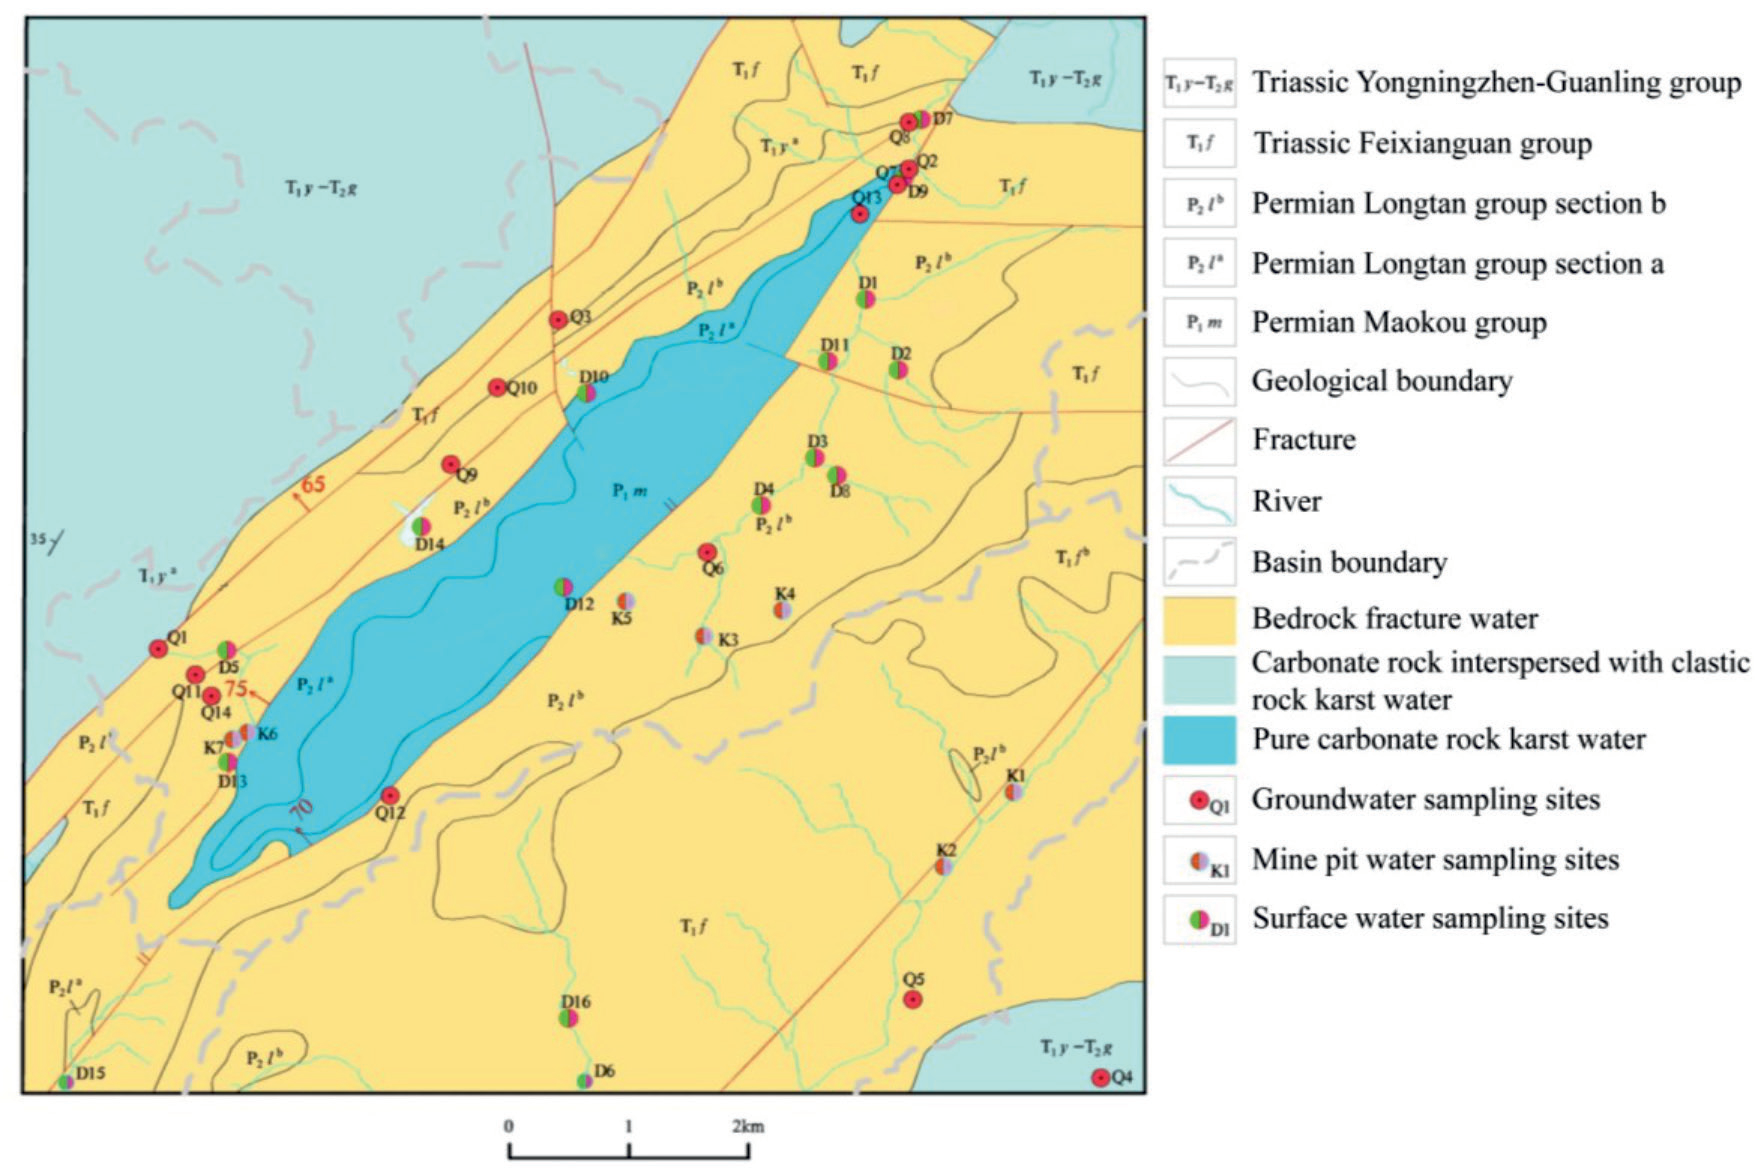
The tectonic zone is mainly composed of the Old Plant backslope, the foot fractures parallel to the backslope and the Sulphur Plant fracture, which are all compression-torsional in nature. The exposed strata in the study area consist of the Lower Permian Mao Kou Formation tuffs, Upper Permian Longtan Formation tuffs, mudstones, siltstones, sandstones and coal beds, and the Lower Triassic Feixianguan Formation chip sandstones, rock chip siltstones and muddy siltstones. Groundwater mainly includes pore water of the loose layer of the Fourth Series, fracture water of coal clastic rock and fracture water of carbonate karst, etc. In this experiment, water samples of river water, groundwater, mine pit water and coal gangue drainage water were collected from the mine catchment area of Rongjia River Basin in Laochang in September 2020 (abundant water period) and March 2021 (dry water period), respectively. A total of 14 groups of isotope water samples were collected, including 12 groups of groundwater samples, 2 groups of river water samples; 14 groups of groundwater full analysis samples, 7 groups of mine water analysis samples and 16 groups of surface water samples (Fig. 2). The groundwater was divided into groundwater from the clastic rocks of the Triassic Feixianguan group, groundwater from the coal bed of the Permian Longtan group and groundwater from the chert of the Permian Maokou group, and the groundwater samples collected in this paper were mainly springs and deep groundwater from boreholes.
Testing Method
Sampling apparatus in accordance with the prescribed standards using polyethylene plastic bottles and brown hard glass bottles, sample bottles cleaned in advance with distilled water, and then rinsed with water samples 3 times before sampling [18]. The sampling bottle into the water filled with no air bubbles, the scene to add a good protective agent after sealing, low temperature storage and avoid direct sunlight. Groundwater sampling before letting it flow for 3-5 minutes, borehole sampling before pumping 10-15 minutes, surface water sampling sample bottle to the central river below the liquid level sampling. On-site use of portable multi-parameter water quality meter (DZB-718, Leici Co., Ltd, China) to determine the pH, temperature (T), electrical conductivity (EC) and mineralization (TDS) and other physicochemical parameters of water samples at the sampling site. The physical and chemical parameters such as K+, Na+, Ca2+, Mg2+ and metal content in the water are determined according to the relevant national standards of China [19-21]. Hydrogen (δD) and oxygen (δ18O) isotopes were determined using stable gas isotope mass spectrometer (253Plus, ThermoFisher Scientific, USA). All samples are additionally tested for two parallel samples to control the quality of analysis and testing. The isotopes were tested by testing the standard samples at the same time to ensure the quality, which ensured the real credibility of the analysis results.
Results and Discussion
Type of Water Chemistry
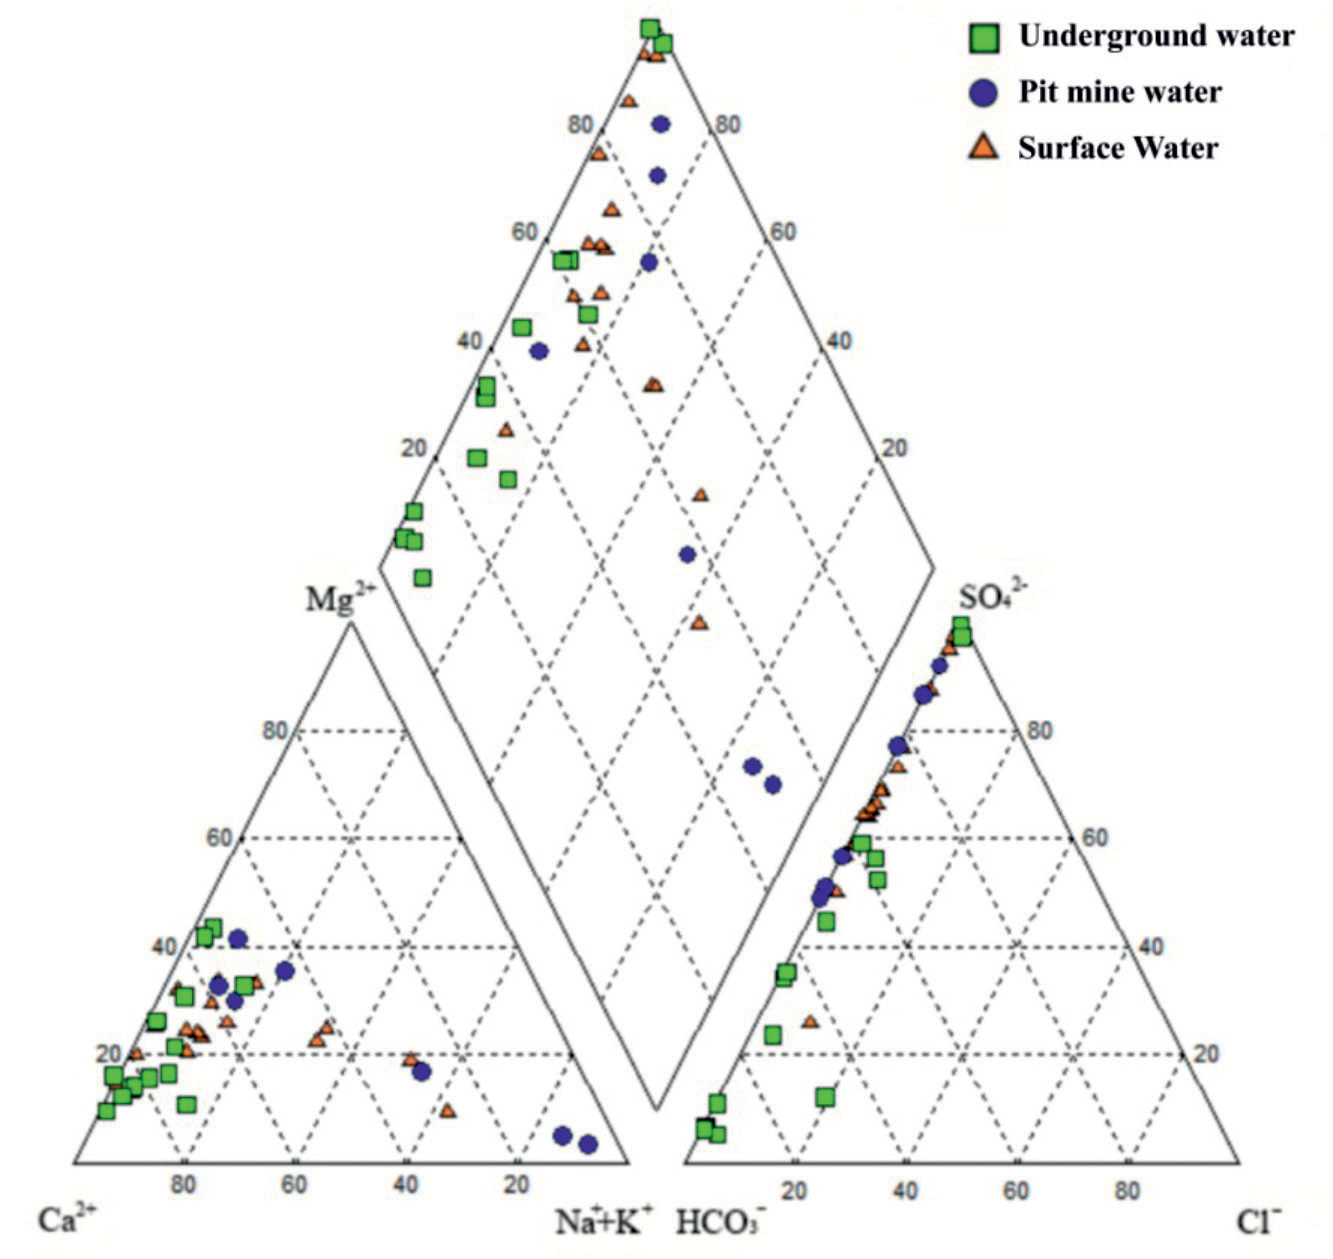
The results of water chemistry element testing at the water sample sites in the study area are shown in Table 1. Water chemistry type analysis was performed using Aquachem software to obtain the piper trilinear diagram (Fig. 3) [22]. The anions in the groundwater samples of the study area were dominated by HCO3- and SO42-, and the cations were dominated by Ca2+ and Mg2+. The water chemistry types can be divided into HCO3-Ca, SO4·HCO3-Ca·Mg, SO4·HCO3-Ca, HCO3·SO4-Ca, and HCO3·SO4-Ca·Mg, among which the HCO3-Ca type was dominant. The anions in the pit mine water samples are mainly SO42- and HCO3-, and the cations are mainly Na+, Ca2+ and Mg2+. The water chemistry types can be divided into SO4-HCO3-Na, SO4-HCO3-Ca-Mg, SO4-Ca-Mg, etc., among which SO4-HCO3-Na and SO4-Ca-Mg are mainly. The anions in surface water samples are mainly SO42- and HCO3-, and the cations are mainly Na+, Ca2+ and Mg2+, and the water chemistry types can be divided into SO4·HCO3-Ca·Mg, SO4·HCO3-Ca, SO4-Ca·Mg, SO4-Ca, SO4·HCO3-Na·Ca, HCO3·SO4-Ca, HCO3·SO4-Na·Ca, etc., with SO4·HCO3-Ca·Mg, SO4·HCO3-Ca, and SO4-Ca·Mg dominating (Fig. 3).
The study area is located in Yunnan, which is a typical karst landscape area [23], where the dissolution and precipitation of soluble rocks by groundwater and surface water are more obvious [24]. The reaction between the infiltrated recharged atmospheric precipitation and the overlying carbonate and saltstone minerals of the Maokou Formation and the pyrite and chalcopyrite minerals within the coal seam of the Longtan Formation, resulting in the generally high contents of HCO3-, SO42-, Ca2+ and Mg2+ in the water samples of the study area [25, 26]. Similarly higher HCO3-, SO42-, Ca2+ and Mg2+ were also observed in other study areas in Yunnan [25, 27, 28].
Recharge Characteristics of Groundwater
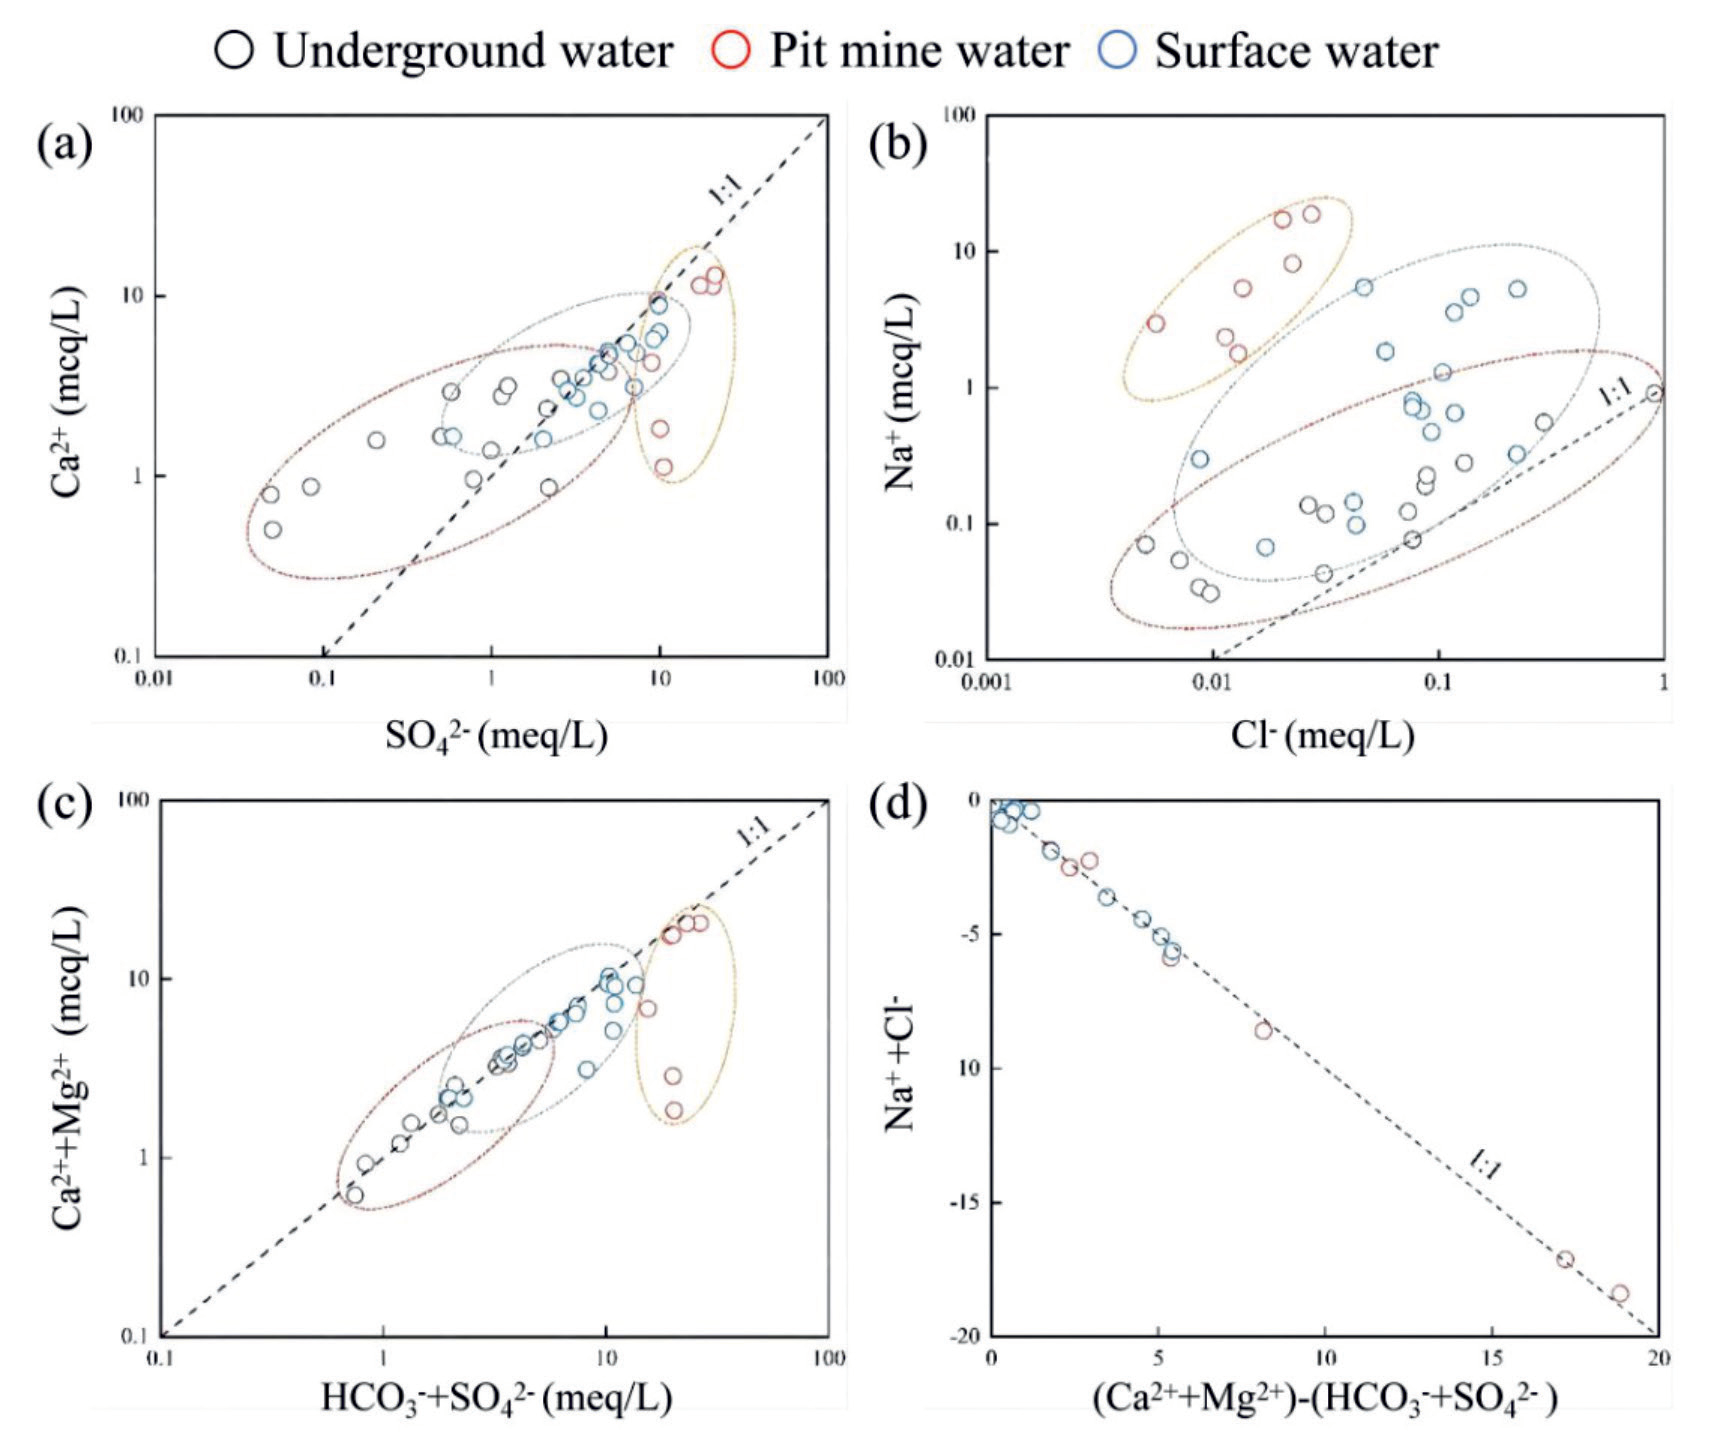
As can be seen from Table 1, the main ions of water samples in the study area are Ca2+, Mg2+, Na+, HCO3-, and SO42-, and their sources are closely related to the lithology of the aquifer [29]. The area is mainly carbonate rocks as well as clastic rocks, and the dissolution filtration or precipitation of carbonate as well as silicate minerals affects the ionic composition in the groundwater of the study area [28, 30]. The analysis of the ion scale factor (Fig. 4) can effectively determine the main water-rock action in the study area [31]. Fig. 4a) shows the ratio of Ca2+ to SO42-. The value of Ca2+/SO42- in groundwater is basically greater than 1:1, and there may be dissolution of carbonate minerals such as calcite (CaCO3) and dolomite (CaMg(CO3)2)), and the dissolution equation is shown in Equation (1) and Equation (2). The Ca2+/SO42- value of surface water is basically close to 1:1, which shows that Ca2+ and SO42- in water basically originate from the dissolution of gypsum (CaSO4·2H2O), and the dissolution equation is shown in Equation (3). The ratio of pit mine water and some surface water samples is less than 1:1, and the SO42- content is too much, so there may be a cation exchange process (Equation (4)), which makes some Ca2+ replaced by Na+ [32].
Fig. 4b) shows the ratio of Na+ to Cl-. The points of Na+/Cl- values in groundwater, pit mine water and surface water are all located above the rock salt dissolution line with a ratio of 1:1, indicating that feldspar weathering and silicate mineral reactions may have occurred, or cation exchange, where Ca2+ is adsorbed onto clay minerals, allowing Na+ ions to be replaced and their content to increase [33]. As shown in Fig. 4c), the values of (Ca2++Mg2+)/(HCO3-+SO42-) in groundwater and most of surface water are on the 1:1 line, indicating that Ca2+, Mg2+, HCO3-, and SO42- in water originate from the dissolution of carbonate minerals and sulfate minerals mainly, which verifies each other with the conclusion in Fig. 3a) [34]. Fig. 4d) shows the values of [(Ca2++Mg2+) -(HCO3-+SO42-)]/(Na+ -Cl-), and all points are very close to the ideal value of -1, indicating that silicate dissolution and ion exchange interactions jointly influence the type of hydro-chemical interactions in the study area [35].
The ion exchange can be analyzed by Chloro-Alkaline Indices (CAI) [36], as shown in Equation (5). If the CAI is negative, it means that Ca2+ and Mg2+ in groundwater exchange ions with Na+ in the aqueous medium; if its value is positive, the Na+ in groundwater is replaced by Ca2+ and Mg2+. As shown in Table 1, the CAI -I values of the water samples are all negative, indicating that the replacement of Ca2+ and Mg2+ in water by Na+ in the water-bearing medium minerals is the main ion exchange process in the study area [37].
Sources of Main Groundwater Components
Hydrogen-oxygen isotope and water chemistry methods of water bodies are effective ways to study the water cycle, and stable hydrogen-oxygen isotope composition is an effective tracer to reveal the physicochemical processes of the water cycle, which plays an important role in studying the source and mode of groundwater recharge in the basin and the mutual transformation process of surface water and groundwater [14, 38-41]. A total of 14 sets of water samples were collected for hydrogen and oxygen isotope testing (Table 2), including 10 sets of groundwater samples, 2 sets of pit mine water samples, and 2 sets of surface water samples. The δD values of groundwater and pit mine water in the study area varied from -82.9 to -75.3 with a mean value of -78.82, and the δ18O values varied from -14.16 to -11.01 with a mean value of -12.13.
Craig (1961) proposed that the hydrogen-oxygen isotopic composition of atmospheric precipitation is linearly correlated [42]: δD = 8δ18O + 10, which is the accepted global meteoric water line (GMWL) [43]. The atmospheric precipitation line in the study area was selected from the east Yunnan-Qianxi atmospheric precipitation line with the relationship: δD = 7.848δ18O + 11. As shown in Fig. 5, the surface water sample points in the study area were distributed on the local atmospheric precipitation line, and most of the groundwater and surface water samples were distributed near the local atmospheric precipitation line, indicating that the groundwater mainly originated from atmospheric precipitation; however, the pit mine water and three groundwater samples, TW02, TW03 and TW05, were shifted, and the δ18O values decreased and were located to the left of the atmospheric precipitation line. According to Pang et al. (2016) the relationship between hydrogen and oxygen isotopes is divided into 13 lines [44], the points in the study area that are offset from the local atmospheric precipitation line are close to line 10 (Eq. (6)). For example, there is condensation of water vapor, resulting in low values of both hydrogen and oxygen isotopes with small slopes [45].
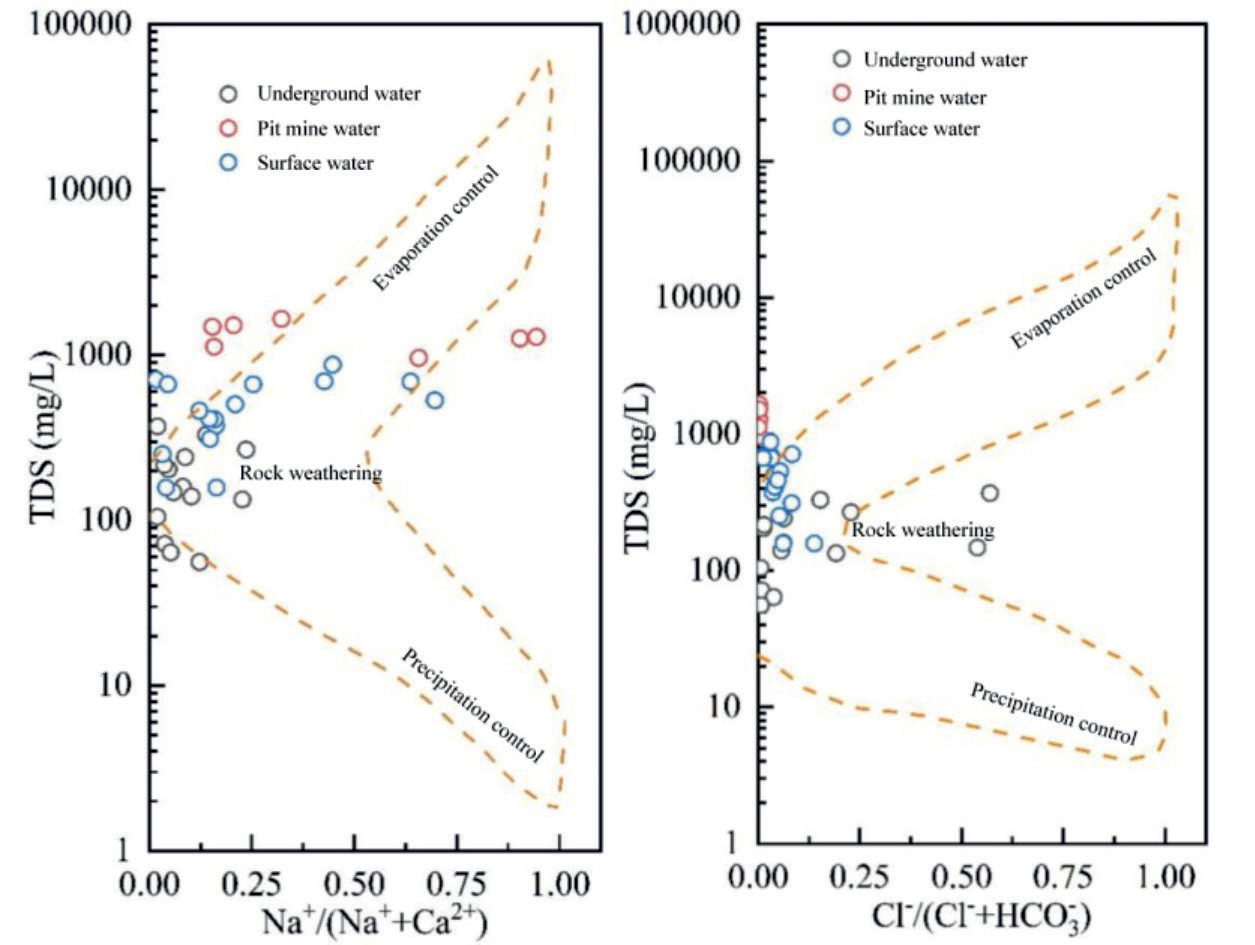
Gibbs plot can be effectively analyzed by Na+/ (Na++Ca2+) and Cl-/(Cl-+HCO3-) compared with TDS, respectively (Fig. 7). The types of water chemistry can be classified into: “evaporation-controlled”, “rock-weathering” and “precipitation-controlled” [46]. Fig. 7 shows the Gibbs plot of the sampling points in the study area. The TDS ranges of groundwater and surface water are 56~370 mg/L and 158~876 mg/L, respectively, which are freshwater; the pit mine water has the highest TDS, ranging from 962~1656 mg/L, which are brackish water except for point KKS11. All water sample points fall in the rock weathering control area, which shows that the groundwater in the study area is mainly controlled by rock weathering [47].
Table 1.
Results of water chemistry in the study area.
Water-Rock Action Analysis
The saturation index (SI) is a parameter to study the saturation state of minerals in groundwater, which has an important indication in the study of water-rock interaction and is defined as [48]:
In Equation (7), LAP is the activity product of the relevant ions in the dissolution reaction of minerals; K is the equilibrium constant of the dissolution reaction of minerals at a specific temperature. When SI<0, it indicates that the mineral is in an unsaturated state in solution; when SI = 0, the mineral is in dissolution equilibrium in solution; when SI>0, the mineral is supersaturated in solution.
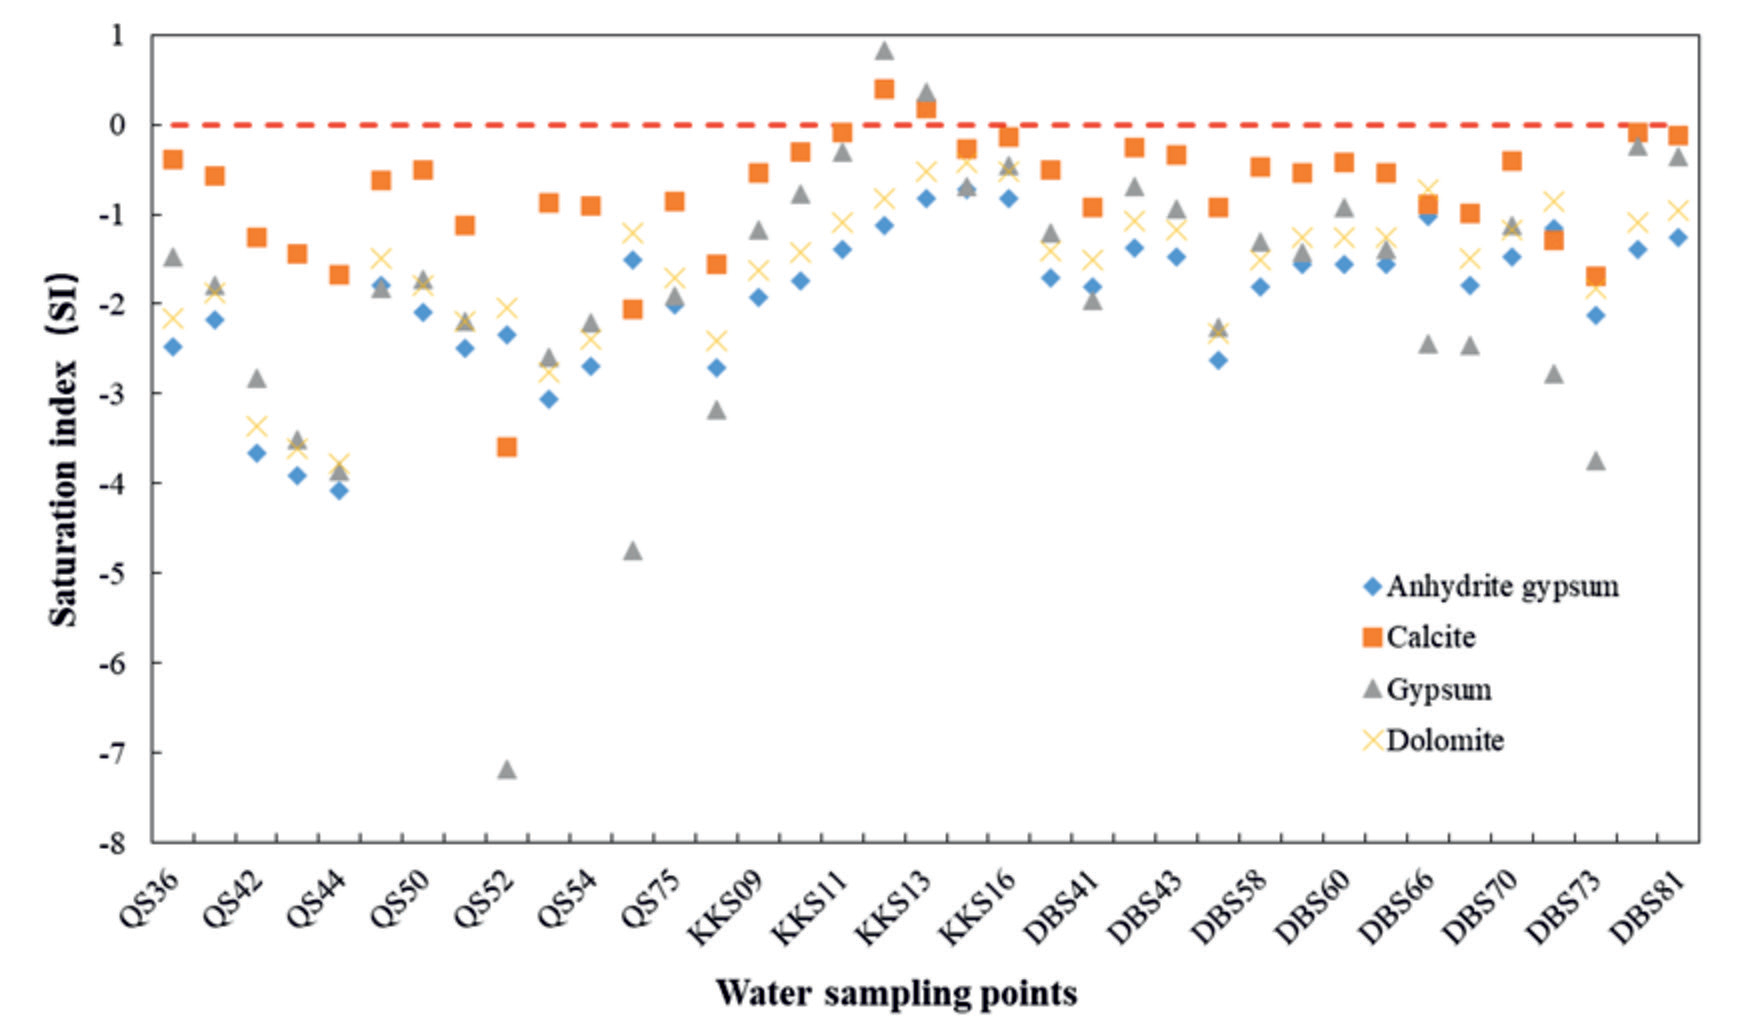
According to the water chemistry results, the main cations at the water sample sites are Na+, Ca2+, and Mg2+, and the main anions are SO42- and HCO3-. Therefore, the possible mineral phases in the study area are calcite, dolomite, gypsum, and anhydrous gypsum. The saturation index of each mineral was calculated using PHREEQC geochemical software [49], and the results are shown in Fig. 8. The SI values of calcite at each water sample point are close to 0, that is, calcite is basically in dissolution equilibrium, and there may be mineral precipitation if it continues to dissolve [50]; the SI values of the remaining minerals (dolomite, gypsum, anhydrous gypsum) are basically less than 0, which are in unsaturated state, indicating that the water samples in the study area have the ability to continue to dissolve the surrounding rocks [48]. Furthermore, the ratio of pit mine water to some surface water is on the 1 :1 line (Fig. 3c), suggesting that other water-rock interactions are involved [51].
Water Risk Assessment in Mining Areas
It is worth noting that the study area contains relatively extensive semi-metallic deposits, so the risk of elemental exceedances in this area requires special attention [52, 53]. We can see from the data in Table 1 that groundwater is a little more polluted than surface water. Compared with surface water pollution, groundwater contamination is much more challenging to address once it has occurred. The most direct route of contamination of aquifers in the present study area is through open pit mining or underground mining below the water table [54]. According to the groundwater quality standards in the geological and mining industry standards of the People’s Republic of China (DZ/T 0290-2015). The pH values of groundwater sampling sites Q3, Q9 and Q12 reached Class IV and V category, respectively. In terms of SO4‑ content, Q2, Q6, Q7, Q9 and Q13 sampling points are category II, and Q12 is category III. Fe content of Q13 reached IV category; Q6, Q8, and Q12 have Mn levels up to Category IV. Class IV and V waters are not suitable for direct use as drinking water because of their high chemical content. Excessive levels of iron and manganese not only affect the color, odor and taste of drinking water, but also have a negative impact on human health [55]. For example, excessive iron intake may cause bacterial infections, acute iron toxicity, hemochromatosis and other diseases in patients [56]; excessive manganese may cause negative reactions in the gastrointestinal tract, lesions in the oral mucosa, and neurological damage [57]. Therefore, groundwater from the above exceedance sites requires some treatment before drinking, and future research should emphasize the migration and transformation of contaminants in groundwater.
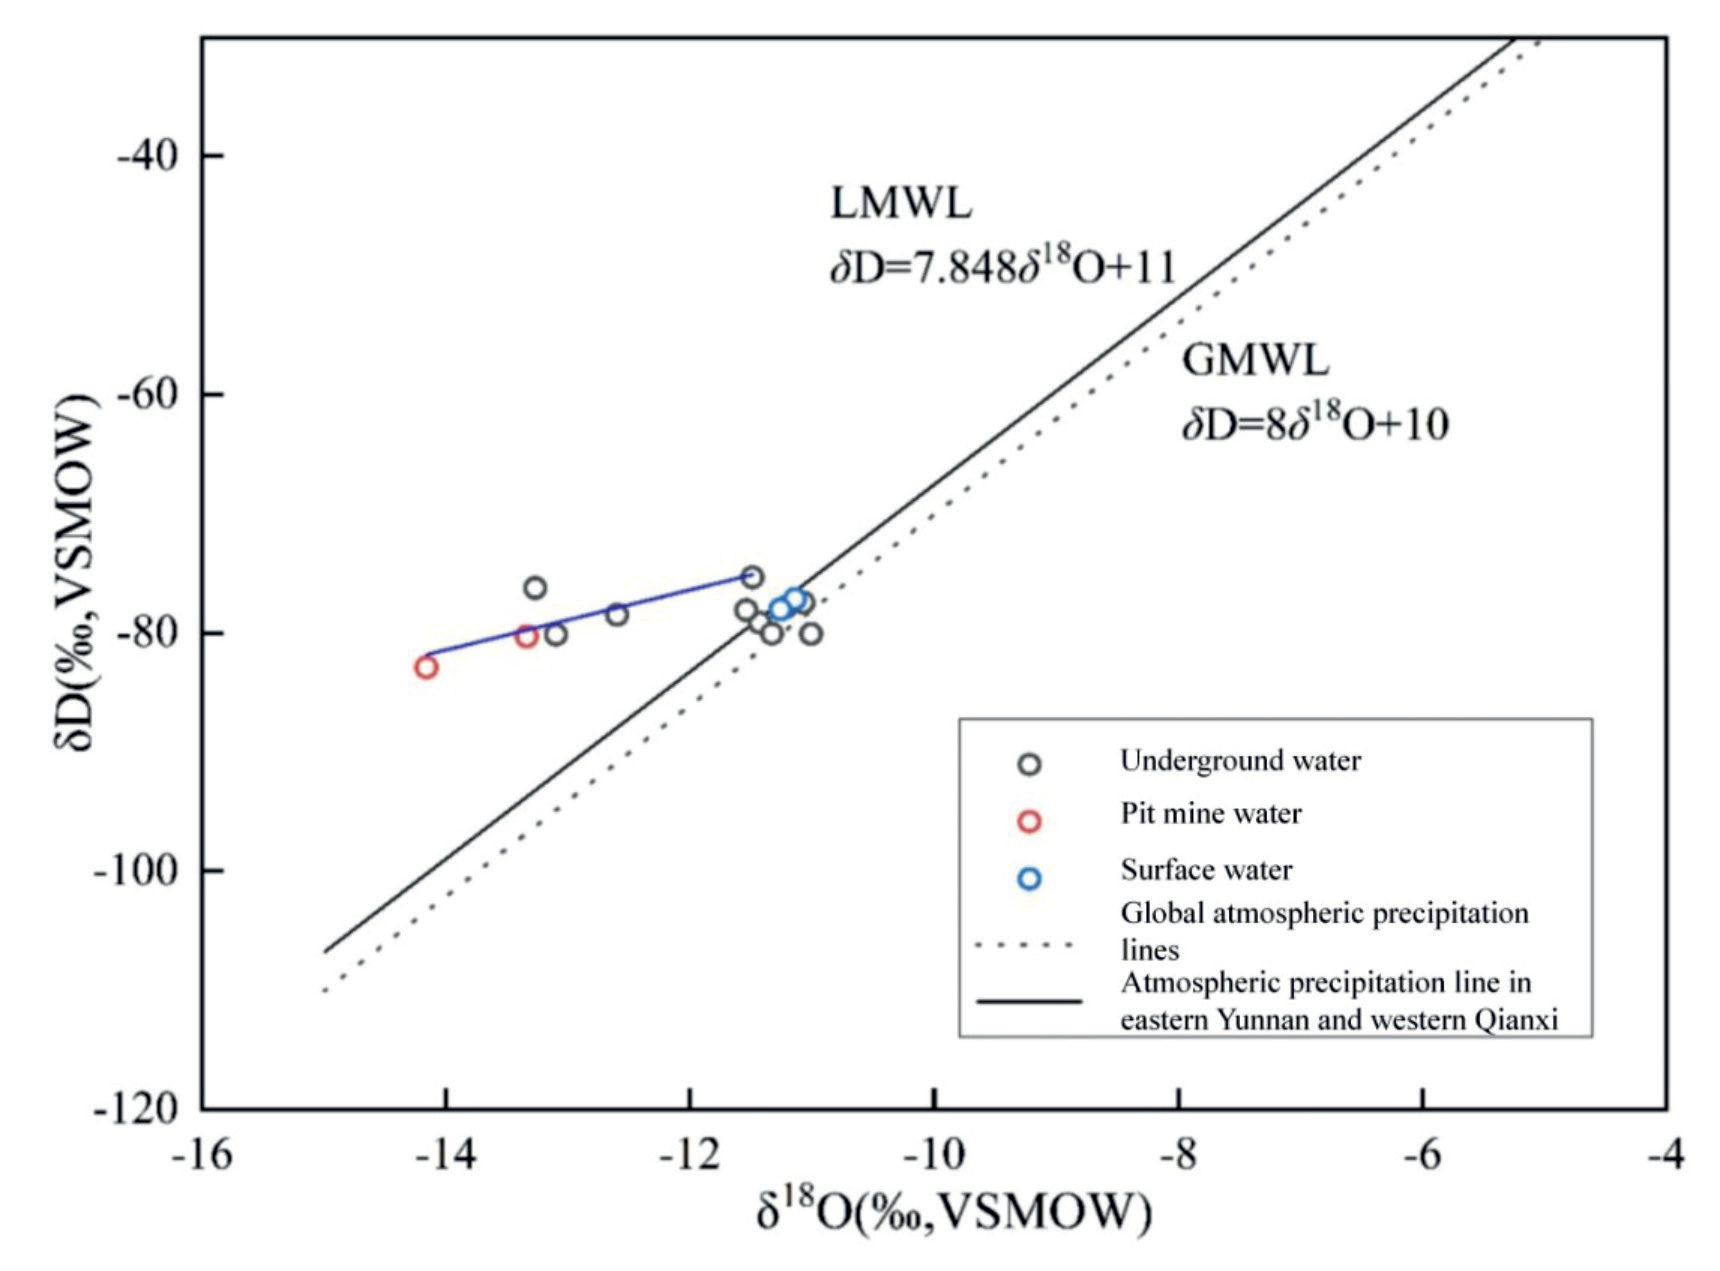
Fig. 6.
Isotope geological indicators and water-rock interaction processes: (1) Global atmospheric precipitation line GMWL (2) Moisture cycle (3) H2S exchange (4) CO2 exchange (5) Water-rock action in underground hot water (6) Water mixing in andesite medium (7) Evaporation operation (8) Seawater mixing (9) Silicate hydrolysis (10) Water vapor condensation (11) Paleo-atmospheric water (12) Hydrocarbon exchange (13) Clay mineral exchange.
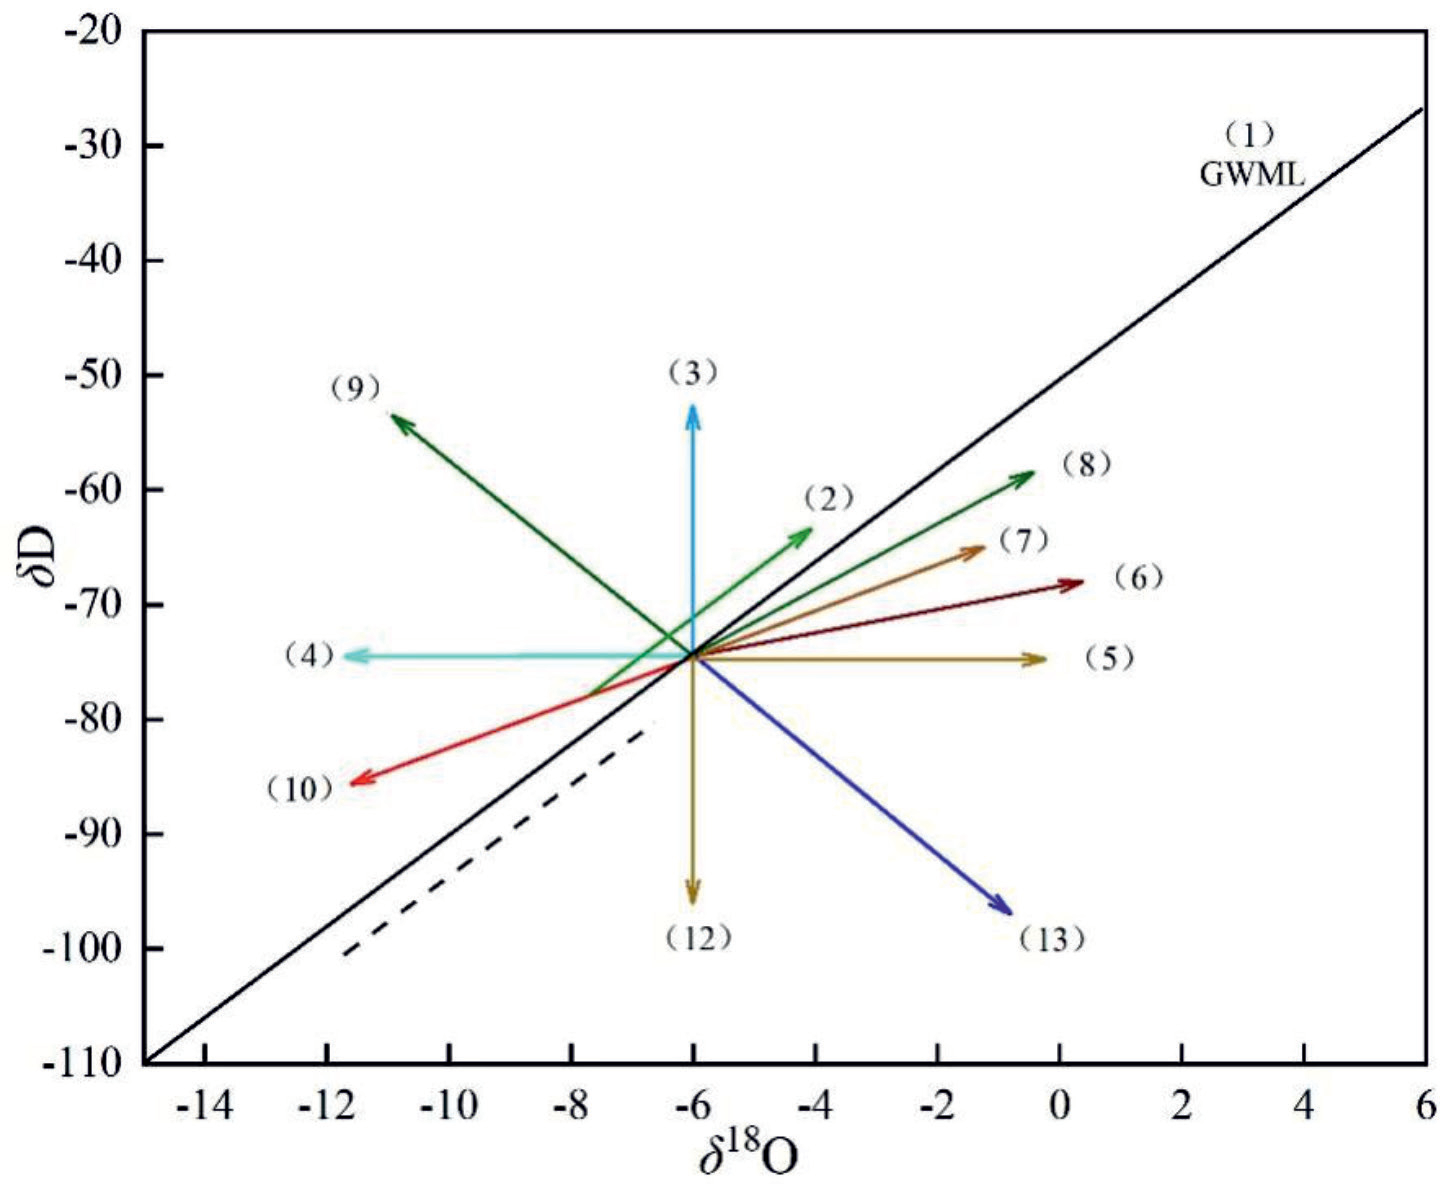
Table 2.
Hydrogen and oxygen isotope test results of water samples in the study area.
Conclusions
In this study, water chemical characteristics, source and evolution, water-rock interaction and risk assessment of water in Laochang study area were comprehensively explored through field investigation observations and sampling tests. It was found that the anions in the water samples in the study area were mainly SO42- and HCO3-, and the cations were mainly Na+, Ca2+ and Mg2+, and their water chemical element contents were closely related to the lithology of the aquifer. The results of hydrogen-oxygen isotope correlation analysis show that the groundwater in this area mainly comes from atmospheric precipitation, in which the pit mine water and some groundwater samples are offset, and there may be the phenomenon of water vapor condensation. In addition, the Gibbs diagram shows that the groundwater in the study area is mainly controlled by rock weathering. Finally, we also conducted a risk assessment of the Laochang study area, which identified some contamination exceedance points. The results of this study shed light on the water chemistry, water sources and evolution, and water-rock interactions in the Old Field, and the results of the risk assessment can also be an effective guide to improving the quality and safety of drinking water in the area.