

Introduction
In engineering practices, such as tunneling and coal and oil mining, the deformation and damage of rock materials are usually related to water. The interaction between water and rock will degrade the physical and mechanical properties of rock, which is considered to be one of the important factors affecting the stability and safety of geotechnical engineering structures [1-3]. Among the many factors affecting the safety of rock engineering, water is the most active one. Wang [4] studied the coal pillar dams in a complex environment where the dynamic-static superimposed stress fields and water immersion are combined, showing that the coal pillar dams subjected to stress and seepage are more vulnerable to damage and even collapse.
The interaction between groundwater and rock-soil aggregate changes the physical, chemical, and mechanical properties of rock-soil aggregate on the one hand, and also changes the physical, mechanical properties and chemical composition of groundwater itself on the other hand [5]. Water-rock interaction in sediments is a natural trend for the solid-water aggregates to achieve equilibrium [6]. In the process of mud diagenesis, pore water not only changes its own properties, but also actively participates in the diagenesis reaction, and is involved in the production of some mineral resources (oil and gas, biogas, methane hydrates, etc.) directly or indirectly [7]. Through his study of gypsum ore, Ma [8] found that its uniaxial compressive strength and tensile strength decreased gradually with increasing immersion time, and that defects in the rock developed gradually; However, macroscopic failure has a transitional process from "shearing to splitting" to the final "mixing of shearing and splitting".
Some scholars have studied the effect of hydro-chemical solutions on rock strength. Sun [9] has studied the influence of the interaction between hydro-chemical solutions and rocks on the failure process of sandstones through experiments. The pore water pressure generated by the hydro-chemical solution will reduce the effective stress that the rock skeleton can bear, thus reducing the effective strength of the rock. After immersion in different types of chemical solutions, the mechanical properties of coal deteriorate, and the chemical solution erosion reduces the strength of coal samples. According to Chen [10], the deterioration of sandstone's mechanical characteristics is mostly an external manifestation of the pressure, chemical, and physical consequences that result from the interaction of water rock. Through an experimental study of the deformation and strength characteristics of hard brittle limestone under chemical erosion, Yao [11] pointed out that the expansion of clay minerals led to the closure of some pores and cracks, and the secondary minerals precipitated to fill the pores and the contact between particles of cement improved the rock strength. In addition, the hydro chemical-solution has some adverse chemical effects on the mineral composition of rocks and the cementation properties between mineral particles, which plays an important role in changing the original structure of rocks and can even produce new minerals [12, 13]. Ion changes are one of the major elements that regulate the concentration, isotopic composition, and radiogenic ratios in water-rock systems, according to Huang [14]. The internal structure damage of altered rock is exacerbated by the action of water intrusion-water loss circulation, which leads to a significant reduction in rock strength [15, 16]. Zhou [17] showed that the water-rock interaction causes the rocks in the fissures and collapse zones to suffer extra damage, which causes the nearby coal and rock masses to bear heavier loads. Through nuclear magnetic resonance (NMR) and uniaxial compression acoustic emission experiments, Yao [18] studied the temporal and spatial variation of the water content of coal samples before and after water immersion, as well as the characteristics of crack extension and failure, and found that the increase of water content contributed to a change in the macroscopic failure pattern of coal samples from tensile failure to combined tensile-shear failure. Feng [19] studied the variation of failure behavior of shales in the ScCO2 immersion environment with different adsorption periods and delamination directions and obtained that the failure of ScCO2 to shales led to the formation of fragmented structures, and also made the failure a mixed mode of tensile-shear failure. Zhao [20] studied the effect of water on the stress intensity of cracks and found that when the internal friction angle is higher than the crack dip angle, the increase of water pressure will cause a sharp decline in rock strength. Deng [21] found that the creep fracture strength and long-term strength of the red bed soft rock decreased significantly during the water-rock interaction by treating the red rock and simulating the Three Gorges Reservoir shoreline environment. Lu [22] carried out a series of water absorption and uniaxial compression experiments on mudstone and sandstone samples with a self-designed thermostatic water tank and obtained the water absorption characteristics at different temperatures and the effects of water and temperature on mechanical strength, deformation, and failure pattern. Wang [23] took the gray sandstone as the research object, carried out a series of immersion tests and triaxial compression experiments based on the erosion effects of chemical solution with different pH values, concentrations, and components, and found that with the acidity and alkalinity of the chemical solution getting stronger, the concentration becoming greater, its corrosion effects on the grey sandstone sample also get stronger. The chemical corrosion makes the grey sandstone sample have a tendency to transform from brittle to ductile, while causing deterioration of its mechanical parameters. A sandstone-water coupling constitutive model was put forth by Jiang [24] and is based on statistical strength theory and damage mechanics. A computational model was developed by Qu [25] that takes the influence of water-rock interaction on the mechanical characteristics of geology into account. Jia [26] constructed a water-mechanical damage coupling model of coal seam tunnel surrounding rock and proposed the water-rock interaction of permeable tunnel surrounding rock.
Coal rock is a typical inhomogeneous brittle material, rich in internal defects and accompanied by a large amount of acoustic emission during compression. Acoustic emission (AE), also called stress wave emission, refers to the phenomenon of a material being deformed or fractured under external or internal forces, releasing stress-strain energy in the form of elastic waves. Some scholars have studied the acoustic emission phenomenon of coal rock under different loading rates [27]. Yang [28] completed the triaxial compression AE test by placing the geophone in the triaxial chamber and obtained the AE characteristics of coal rock under triaxial compression failure; Guo [29] analyzed the AE characteristic parameters obtained from the test and found that the AE phenomenon of rock is closely related to rock failure; Li et al. [30] carried out AE experiments on samples with different water content, and analyzed their AE parameters and stress distribution rule at each stage. Some have also studied the correlation of compressive strength under the water-rock action with the concentration of the solution and the multivariate influencing factors of coal rock solids and developed a multivariate prediction model of compressive strength [31].
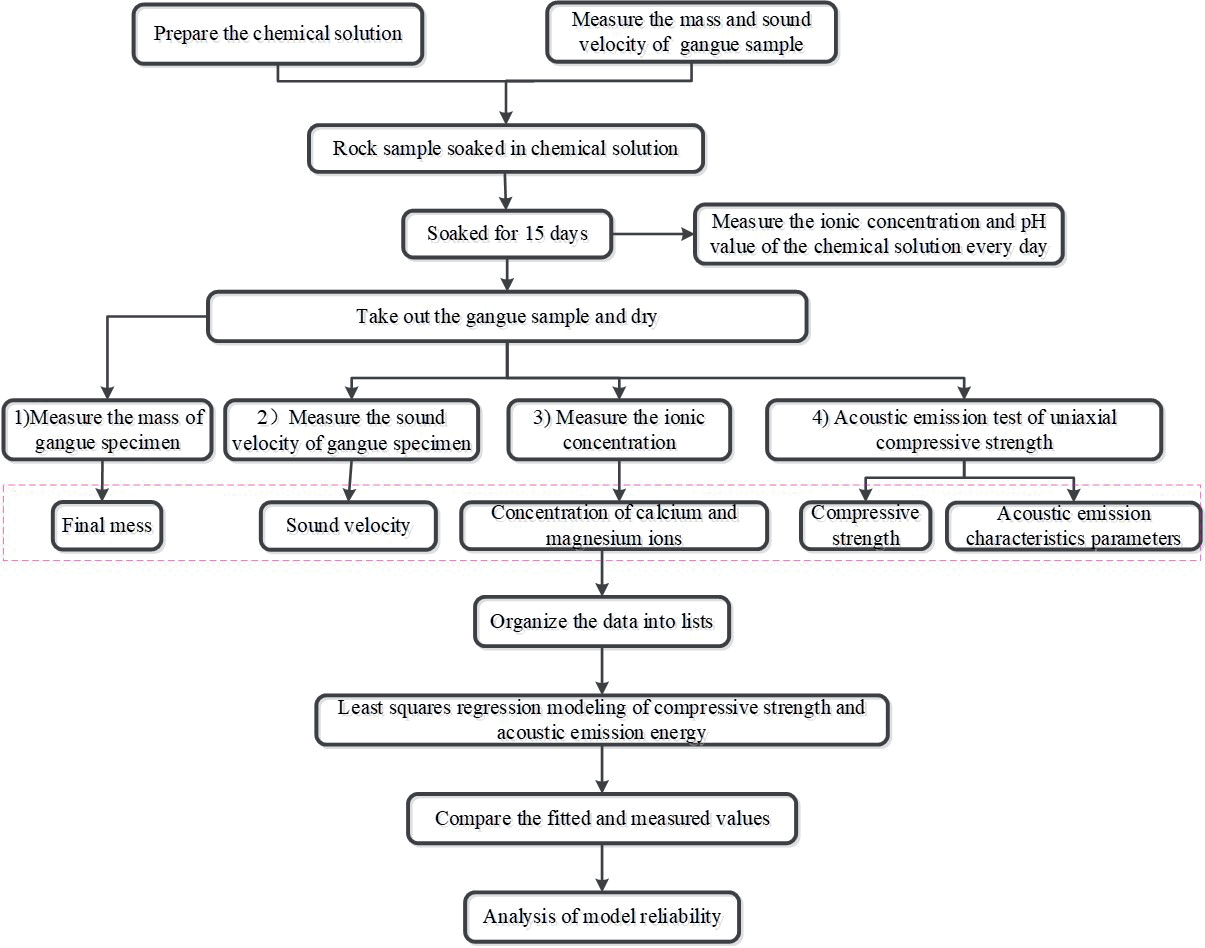
In this paper, we soak the gangue in the chemical solution for 15 days, and then conduct the sound velocity test and the AE test during the whole uniaxial compression process, then the time-varying pattern of the sample mass, the sound velocity in the sample, the pH value of the chemical solution, and the concentration of calcium and magnesium ions can be obtained. We obtain the time course curve of stress and AE characteristics of the gangue compression process. Through correlation theory, we analyze the main factors affecting the strength and AE characteristic parameters of the soaked gangue and establish a multiple regression model of the compression strength and the AE characteristic parameters. The detailed research approach is shown in Fig. 1.
Experimental
Sample and Equipment
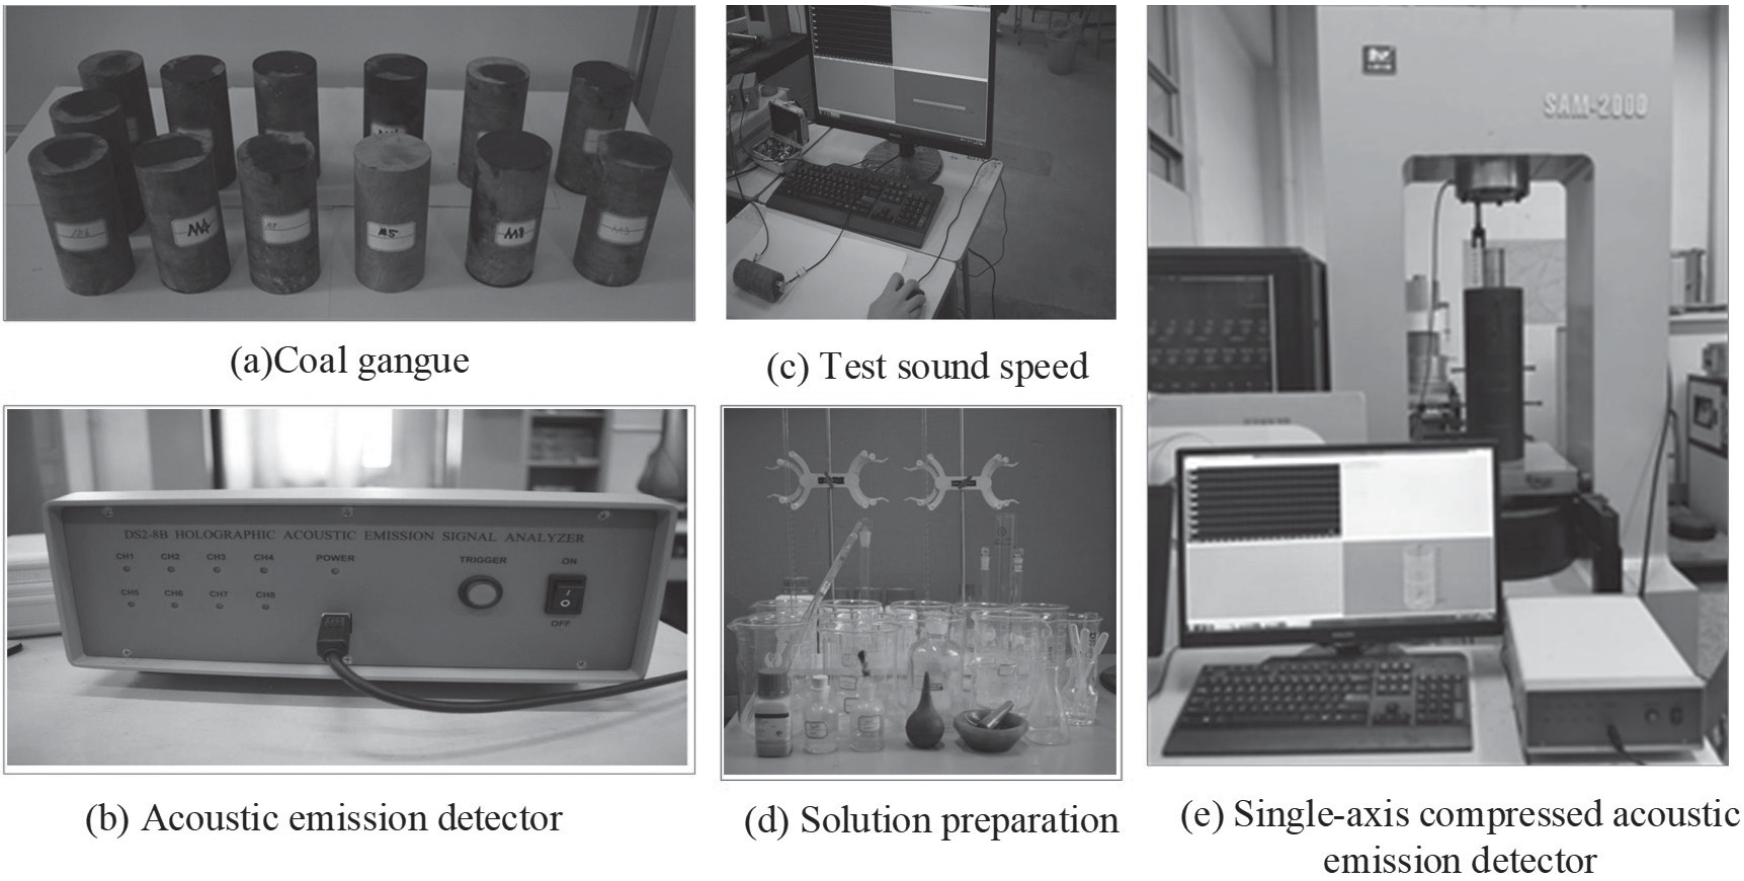
In the tests we use cylindrical gangue rock samples with nominal diameter d for 50 mm, height h for 100 mm, and soak it after using the Acoustic Emission Method or AST (Auto Sensor Test) Method to measure the sound velocity in the gangue, using acoustic emission detector to collect AE signal. A burette, cage, volumetric flask, conical flask, beaker, and other instruments were used to prepare the chemical solution. The SAM-2000 rock triaxial testing machine produced by Changchun Kexin was used to conduct the uniaxial compression test of coal rock. The sample and the main instruments and equipment are shown in Fig. 2.
Test Procedures
The test procedures are as follows:
(1) Sample preparation. Measure the height h, diameter d (measured in different orientations 3 times to take the average value), and the initial mass m0 of each gangue sample before immersion and calculate the initial mass density ρ0 of each sample. Use an acoustic emission detector to measure the sound velocity v0 of each gangue sample.
Due to the high dispersion of mechanical properties of coal gangue, 13 samples with similar density or sound velocity are selected, of which 10 samples are used for the immersion test and the other 3 samples are used for the comparison test (no immersion). Table 1 shows the average value and coefficient of variation of the density, mass, and sound velocity of the 10 samples. We can see that the coefficient of variation of mass, density, and sound velocity of the coal gangue are 1.81%, 1.69%, and 9.88% respectively, and the coefficient of variation of density is small. The selected samples are put into the five kinds of solutions with different pH values, and to prevent test errors and data loss, we prepare two samples to be soaked for each kind of solution. The coal gangue sample number is ‘M’.
(2) Prepare the chemical solution. In order to simulate the composition of groundwater, a solution containing four ions (Na+, K+, SO42+ and Cl-) is chosen for this experiment. The solution concentrations and pH values are set with reference to the solutions prepared in documents [32, 33]. The concentration of NaCl, KCl, and Na2SO4 in each of the 5 solutions is 0.1 mol/L. The set pH value is achieved by adding HCL or NaOH solutions, and the initial pH values of the 5 solutions are 3.0, 4.0, 7.0, 10.0, and 13.0.
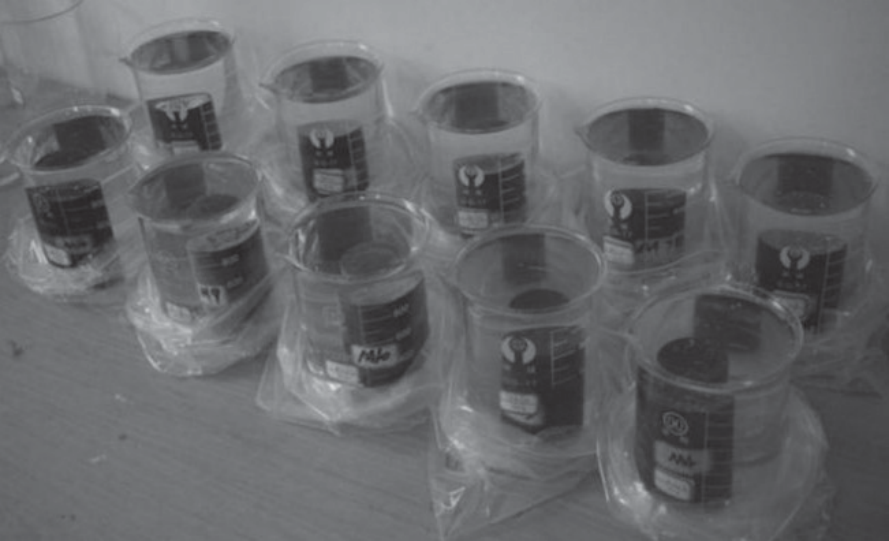
(3) Soak the coal gangue samples and measure the ionic concentration and pH value of the solution. Soak coal gangue samples in solutions of different pH values according to the scheme in Table 1, as shown in Fig. 3. Use EDTA complex metric daily to determine the concentration of calcium and magnesium ions in the solution, measure the pH value of the solution with the accurate test paper, and then take out the sample to measure its mass and record it. In this test, each coal gangue sample is soaked for 15 days.
Table 1.
Physical parameters of coal rocks before immersion.
(4) The sound velocity, mass, diameter, and height of the coal gangue samples are measured daily to calculate the density. The acoustic emission detector is used to measure the sound velocity in the coal gangue samples through the AST Method every day, and the quality and density of the coal gangue samples are measured and recorded at the same time.
(5) Dry the coal gangue samples, and measure and record the final parameters of the sample and chemical solution. Remove the gangue samples after the 15th day of immersion and put them into the drying box. After drying at 120℃ for 8 hours, take out the samples and measure the final mass mu, sound velocity v, pH value of the solution, concentration of calcium ion c1, and concentration of magnesium ion c2.
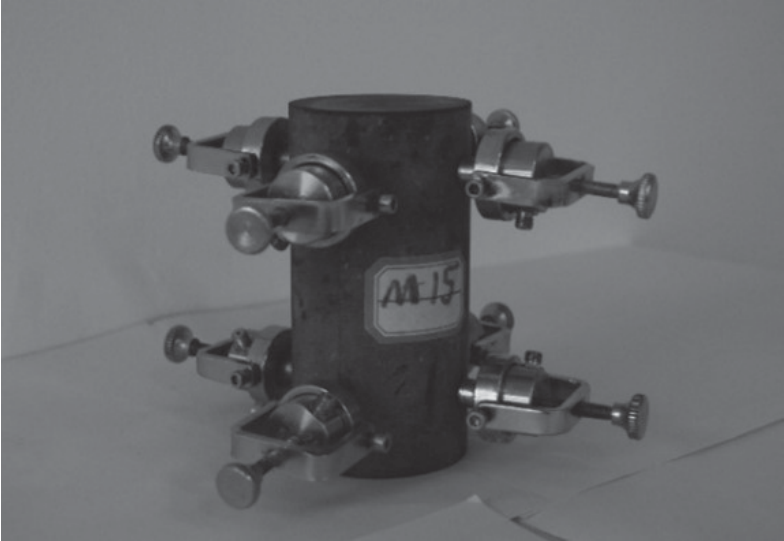
(6) Set the acoustic emission sensors. 8 acoustic emission sensors are pasted on the side of the gangue, as shown in Fig. 4. The contact between the sensor and the sample surface is coupled with a coupling agent and fixed with 502 type glue to ensure a good reception effect of the signal.
(7) Complete the AE test during the whole uniaxial compression process. The sample equipped with the acoustic emission sensor was placed on the compression loading platform of SAM-2000 compression testing machine, and the uniaxial compression of the coal gangue samples was carried out with a loading rate of 0.12mm/min. In order to facilitate later data processing and analysis, it is necessary to ensure that the AE test system and the axial compression loading system synchronize the acquisition of the AE characteristic signal and compressive load-deformation signal.
(8) Collect mechanical data and AE data. The testing system can automatically collect the mechanical parameters, such as load, displacement, stress, strain, compression rate, and AE characteristics parameters, such as amplitude, ringing count, impact number, energy, AE signal, and so on, during the whole process of sample compression.
(9) End of the test. Remove the acoustic emission sensors, sample, and debris at the end of the compression test (as shown in Fig. 5). Save the test data, observe and take photos of the failure surface; seal the sample, leave it for subsequent analysis, and turn off the power of the test machine.
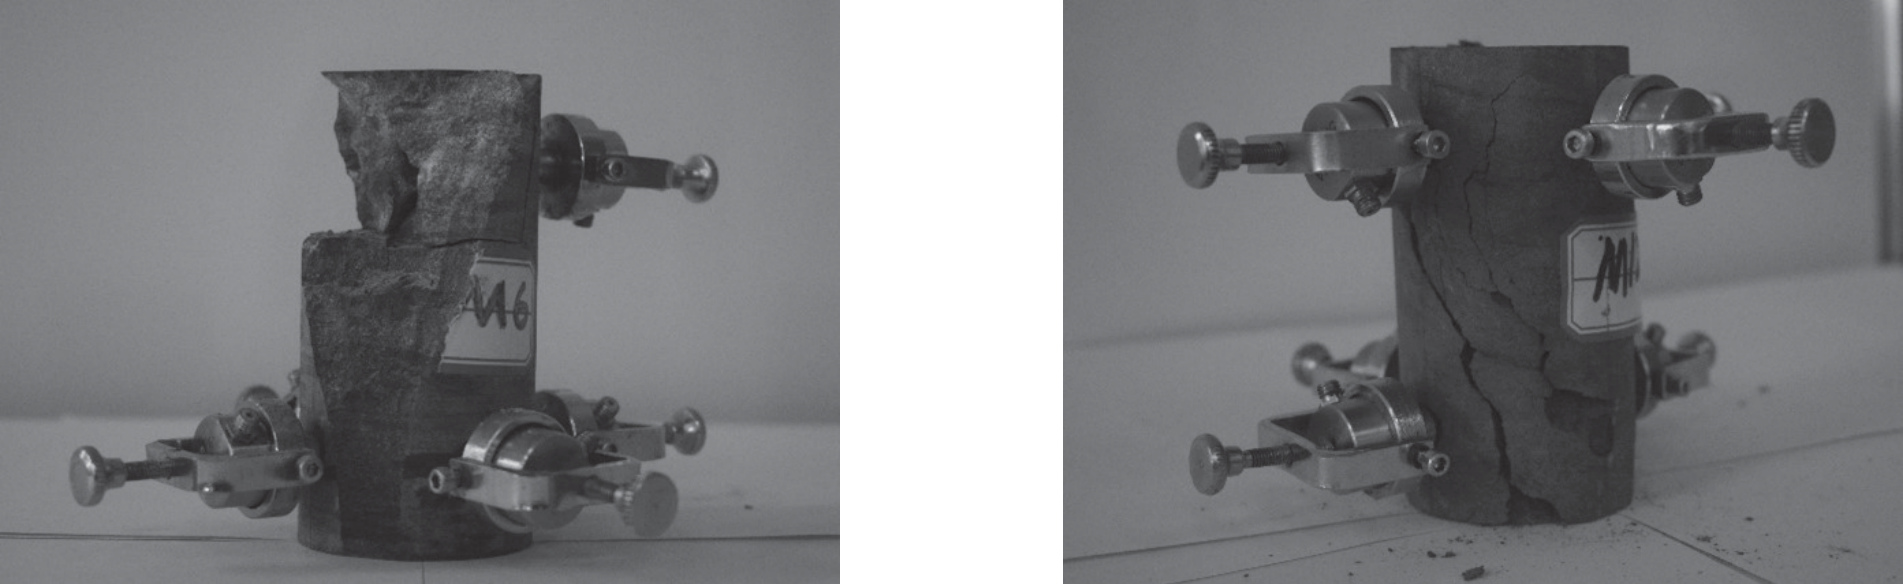
Table 2.
The mass of coal gangue samples after soaking m/g.
Results and Discussion
Physical Performance Parameters of Coal Gangue Samples after Immersion
The mass and volume of coal gangue samples were measured for 15 consecutive days after immersion in solution, the mass m and mass density ρ are shown in Table 2. According to Table 2 and Table 3, the time-variation pattern of m and ρ is shown in Fig. 6.
According to Fig. 6(a), at the first stage of soaking, the mass of each coal gangue sample increased because of the absorption of water, and at a later stage, the mass change slowed down with a downward trend. The mass increment of coal gangue samples soaked in an acidic solution is larger than that of the samples soaked in an alkaline solution. In Fig. 6(b), the mass density of gangue soaked in neutral solution increased at the first stage, while the density of other groups of samples decreased. Fig. 6(c) shows that the mass change ratio of coal gangue soaked in neutral solution is the largest; when soaked in pH=4/13 solution, the ratio fluctuates considerably at the first 5 days, and the change of 5 groups of the sample tends to be consistent in the following days.
Table 3.
Mass density of rock samples after immersion ρ/kg·m-3.
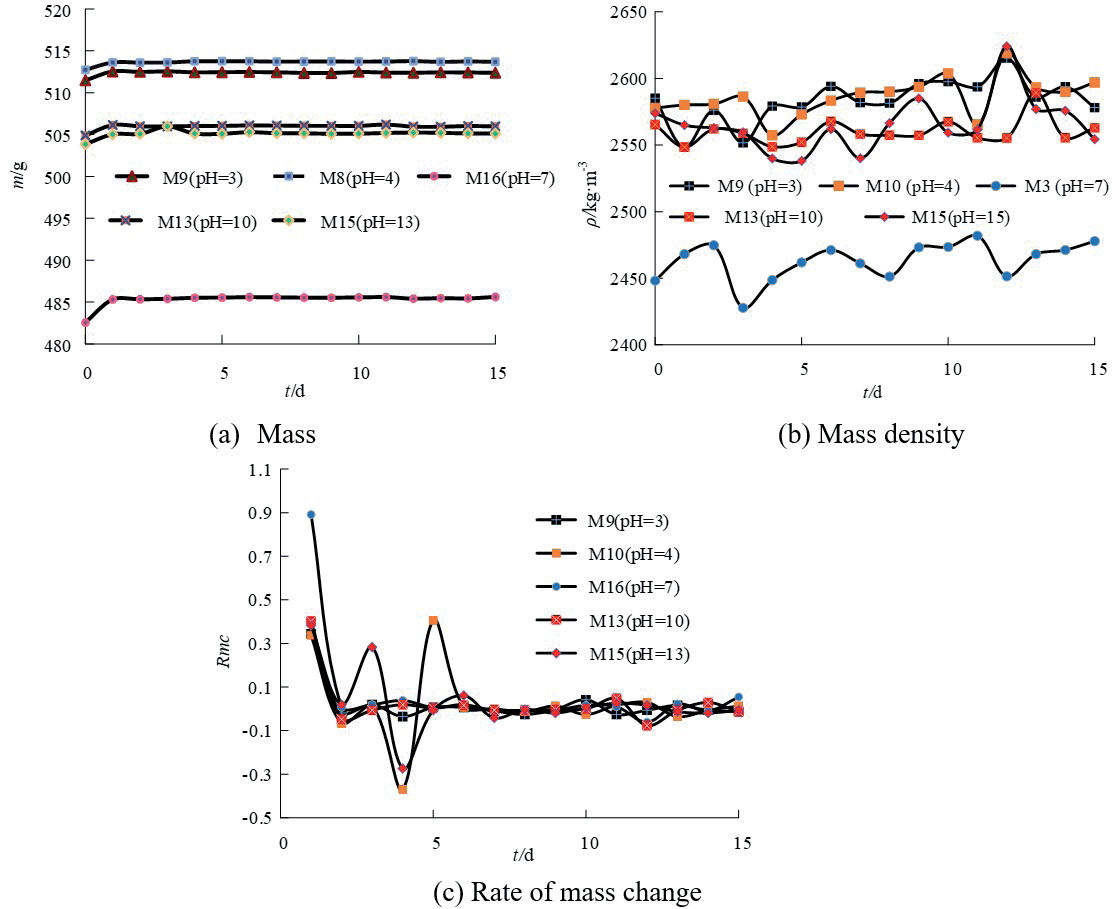
Table 4.
Sound velocity of coal gangue samples after immersion v(m·s-1).
Time-Variation Pattern of Sound Velocity in the Coal Gangue
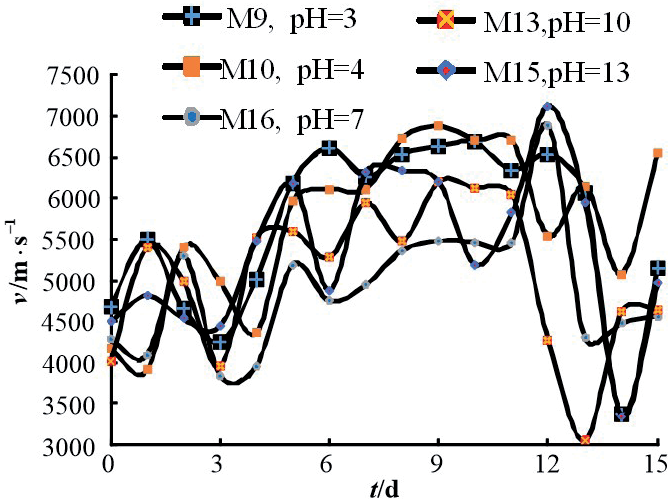
Using acoustic emission lead breaking method daily to measure the sound velocity v of the soaked coal gangue, and the results are shown in Table 4. Fig. 7 shows the time-variation pattern of sound velocity of 5 groups of rock samples after soaking in different pH value solutions.
It can be seen from Fig. 7 that the sound velocity of the coal gangue samples increased significantly after soaking for 1 to 3 days; there was another upward period from the 5th to 12th day of soaking, during which the change of velocity is more obvious than the first rising period, and the value decreased significantly after the 12th day.
Changes in Ion Concentration in Chemical Solution after Immersion
The Ca2+ concentration c1 and Mg2+ concentration c2 in the solution were measured daily. Fig. 8 shows the variation patterns of c1 and c2 with time t measured for 15 consecutive days of some samples. It can be seen from Fig. 8 that the initial pH value has a significant effect on the concentration of calcium and magnesium ions in the solution. 5 solutions were prepared with the same initial concentration of calcium and magnesium ions. After soaking the coal gangue, the acidic solution had the highest volumetric concentration of calcium and magnesium ions. The higher the initial pH value, the lower the volumetric concentration of calcium and magnesium ions in the solution.
After 15 days of immersion, we took out the coal gangue samples and dried them, measured their final mass m and sound velocity v, while measuring the solution pH, Ca2+ concentration C1, and Mg2+ concentration C2, as shown in Table 5.
The Time-Varying Curve of Stress-AE Energy of the Sample during Uniaxial Compression
During uniaxial compression, the system can collect signal characteristics of mechanics (such as stress, strain, etc.) and AE characteristic parameters (such as ringing count, average AE energy, maximum AE energy, number of AE events, etc.) simultaneously. As an example, Fig. 9 shows the time course curves of stress-AE energy of selected samples during uniaxial compression.
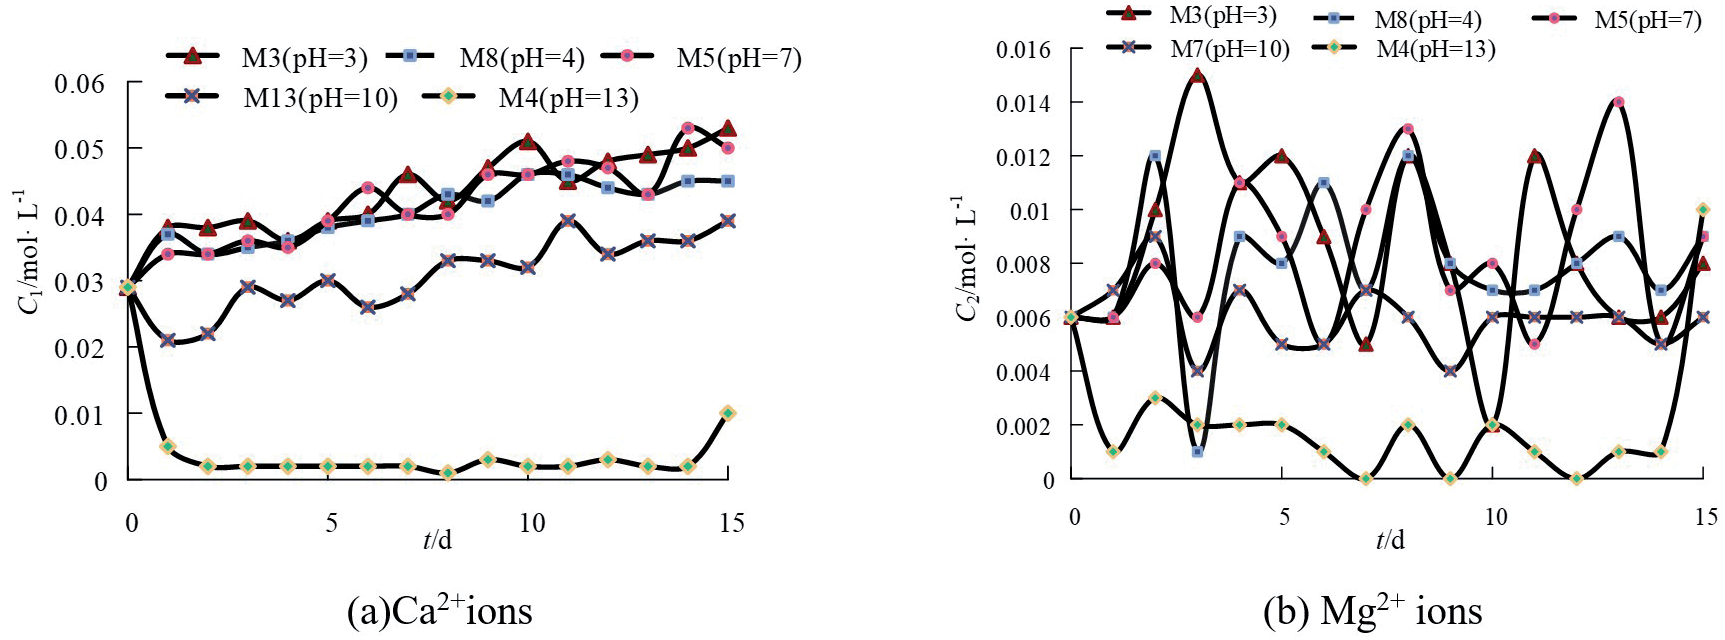
Table 5.
Physicochemical parameters of the dried samples and the soaked solution.
When subjected to uniaxial compression of basalt, granite, and sandstone, the trend of accumulated energy change is basically the same. In the stage of unstable crack propagation and post-peak macroscopic failure, when the load exceeds the damage stress, the internal cracks of the rock begin to propagate unstably and gradually converge and connect. The frictional effect becomes more and more obvious, and the released energy continues to increase until the load reaches the peak stress, and the rock suddenly undergoes macroscopic failure, At this point, the accumulated energy increases sharply in a straight line and reaches its maximum value [34]. According to Fig. 9, we can see that the AE energy of the samples during the uniaxial compression process is obviously phased: there is a significant AE phenomenon when the stress level increases. The release form of AE energy of rock samples is solitary vibration type mainly, and the energy release of samples soaked in alkaline solution is vibration group mainly. Near the compression limit, the AE energy of the sample increases sharply, indicating that a large number of micro-cracks in the sample gather to form larger cracks and gradually connect to form a main crack under the load, leading to the failure of the sample along the main crack.
3D Localization Map of AE Events and Time Course Curve of Stress
Under the action of external force, a large number of micro-cracks in the sample grow up and even merge, which leads to local failure and AE phenomenon. By processing and analyzing the received AE signals, the process of crack generation and expansion of rock can be obtained, and the precursor information of failure of the sample can be captured. Fig. 10 shows the AE event localization map of the sample during compression.
According to Fig. 10, the number of AE points prior to fracture is lower for acid-soaked samples, and the number of AE points only increases rapidly near the peak value of stress. The AE points of the M5 sample are concentrated near the inclined plane at 50 degrees to the cross section, which is more in line with the physical image after fracture. The AE points of M10 sample are concentrated at the 1/3 upper part. The AE points of M7 are concentrated at the 1/4 lower part. M9 AE points are concentrated in the middle and distributed along the conjugate 45-degree section.
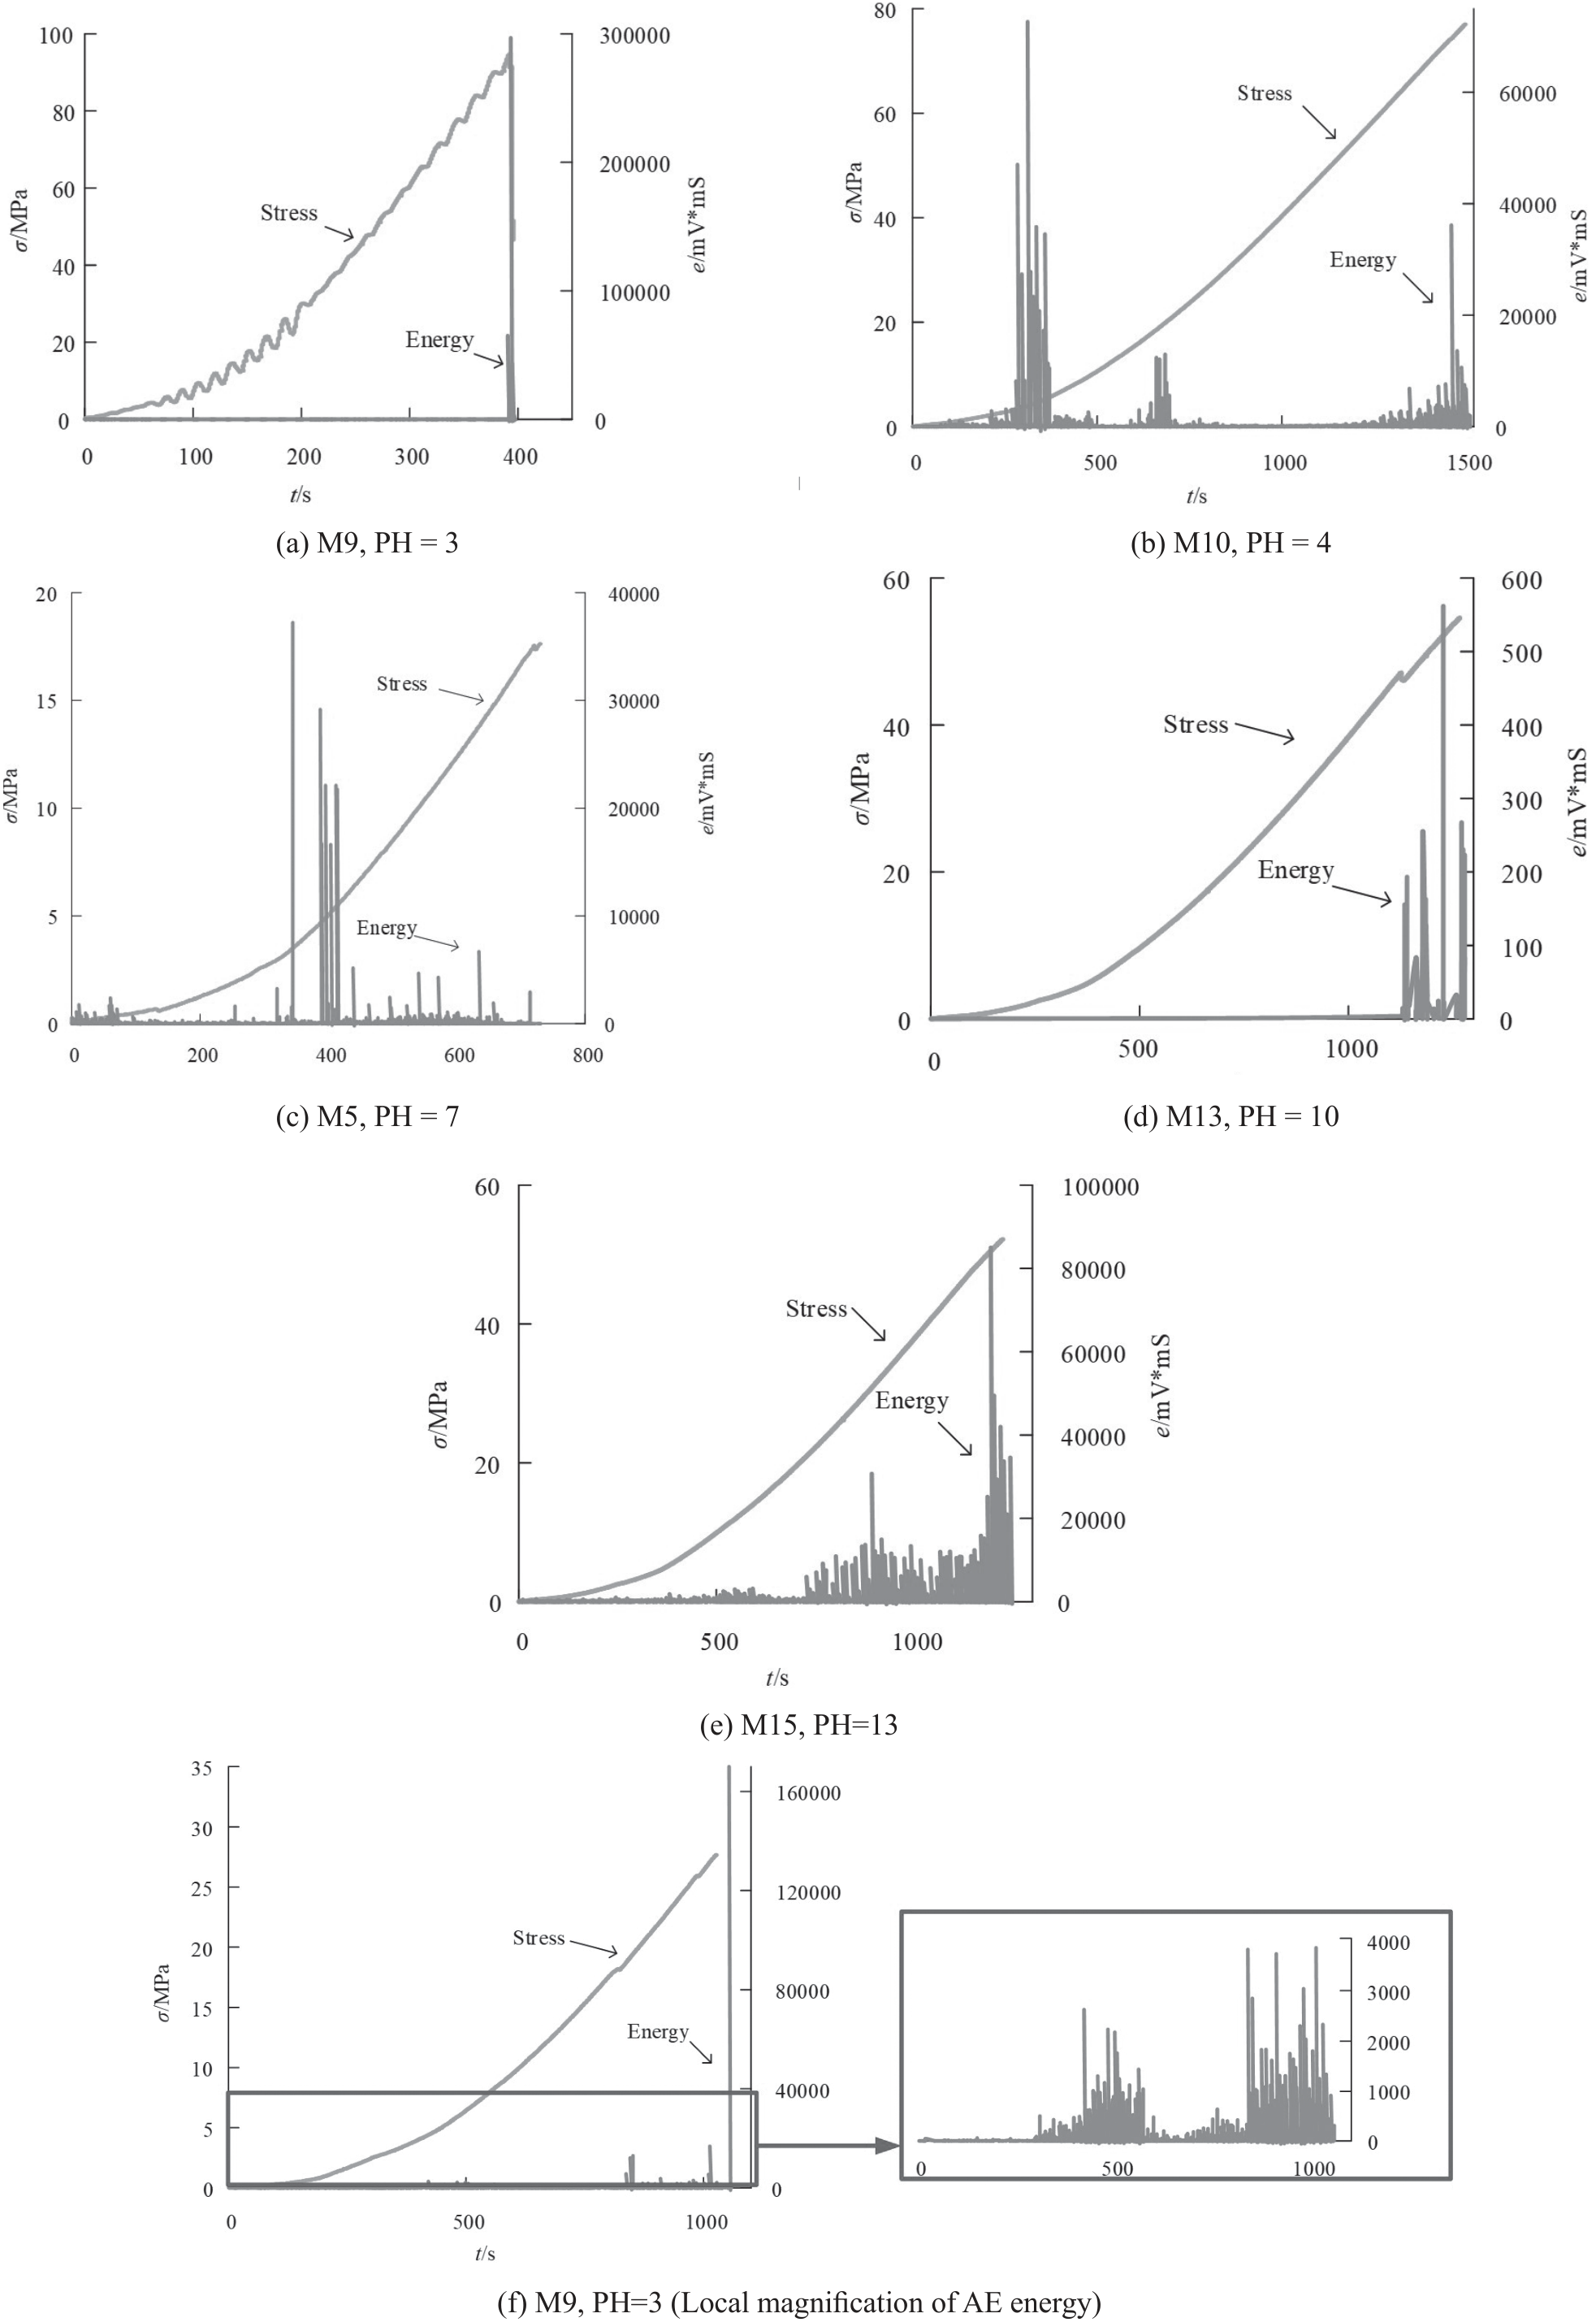
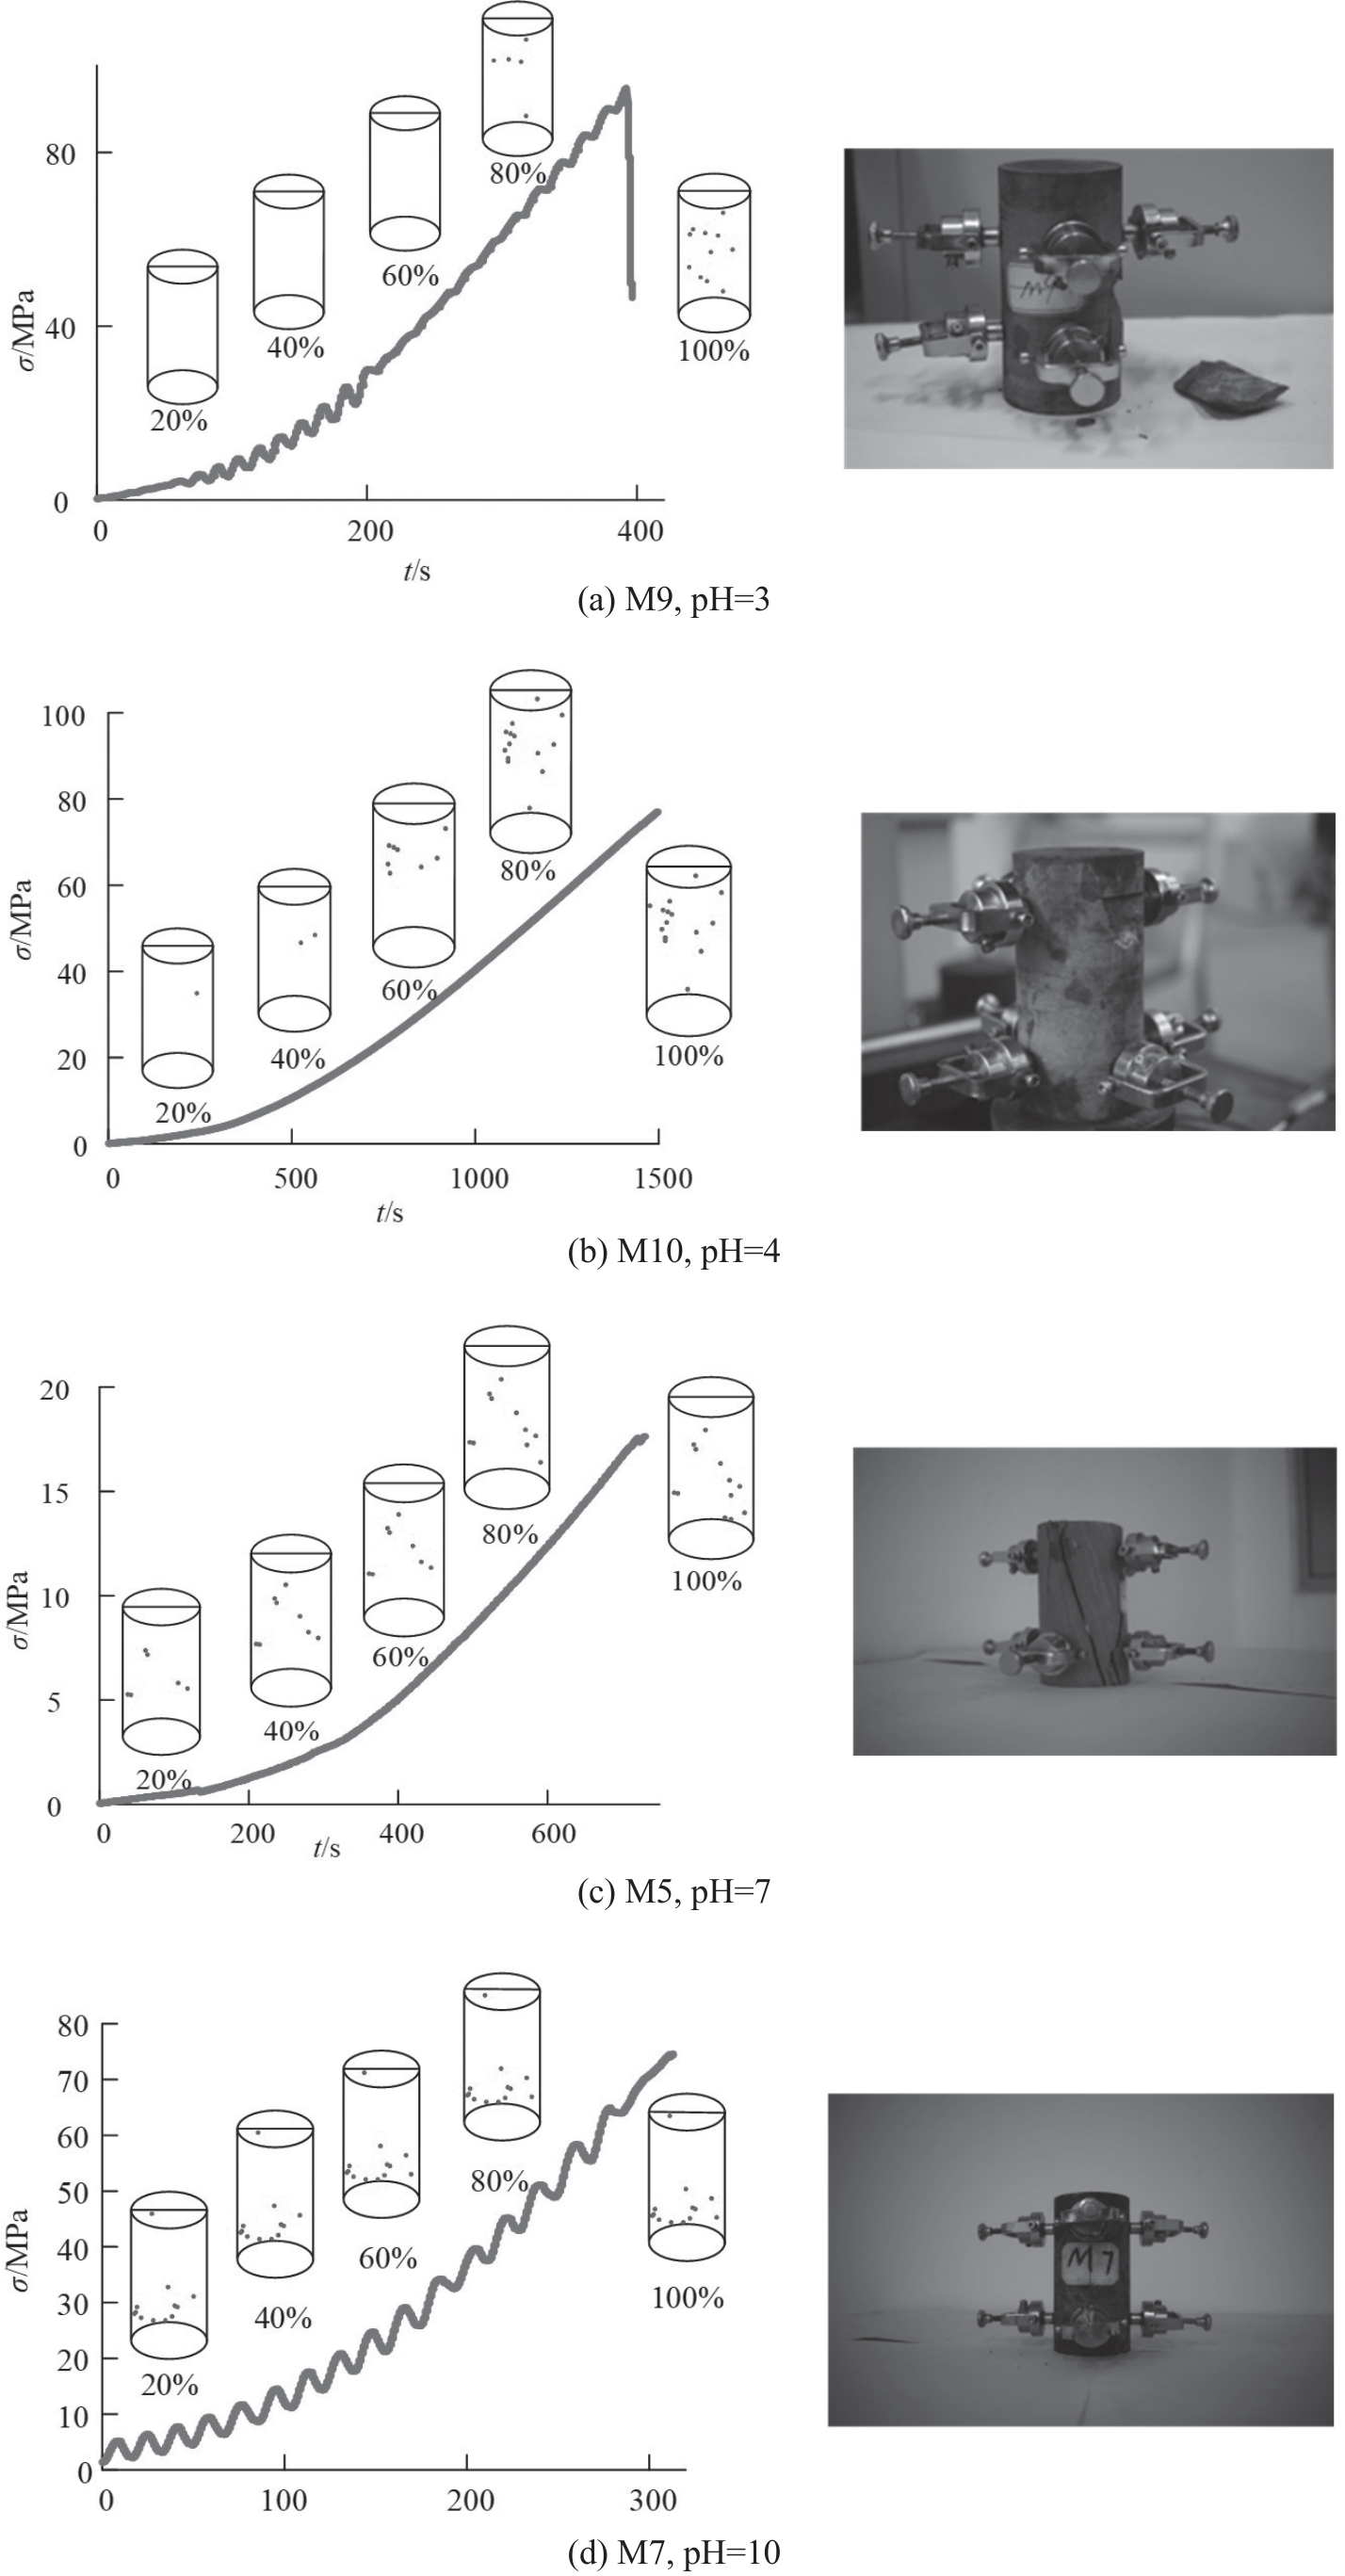
Table 6.
AE parameters and compressive resistance of coal gangue samples after immersion.
Table 7.
Calculated grey relational degree between the maximum AE energy e and each influencing factor.
| Number | X0 | Influence parameters X1 | Grey relational degree | Significance |
|---|---|---|---|---|
| 1 | emax | σb | 0.5085 | 10 |
| 2 | ρ0 | 0.5258 | 4 | |
| 3 | c1 | 0.5206 | 9 | |
| 4 | c2 | 0.5258 | 6 | |
| 5 | pH | 0.7853 | 3 | |
| 6 | pH0 | 0.8013 | 1 | |
| 7 | m0 | 0.8013 | 2 | |
| 8 | m | 0.5258 | 5 | |
| 9 | v0 | 0.5229 | 7 | |
| 10 | v | 0.5217 | 8 |
After the test, the compressive strength σb and AE characteristics (maximum AE energy e, average AE energy em, maximum value of ringing count N, average value of ringing count Nm) of each sample in the whole compression process were counted as shown in Table 6. According to Table 6, the following section analyzes the main factors affecting the AE energy from two aspects of water and rock.
Compared with coal gangue samples soaked in neutral solution, the uniaxial compressive strength of the coal gangue samples increases significantly after the action of acid and alkali solution. The lower the pH value of the solution, the greater the uniaxial compressive strength of the samples, and the acid chemical solution has a greater impact on the characteristics of coal gangue samples.
Factors Affecting the AE Energy
Under the water-rock interaction, the factors affecting the maximum AE energy e of coal gangue samples include the density ρ0 of coal gangue, calcium ion concentration C1, magnesium ion concentration C2, pH value of the solution after immersion, compressive strength σb, and sound velocity v after immersion, etc. Based on the test data and the grey relational theory [25, 27], the grey relational degree between the AE energy e and each influencing factor was calculated respectively. The larger the value of the grey relational degree, the greater the influence of the parameter, and thus the most significant influencing parameter was analyzed.
First, we calculate the average value of each parameter, and then we divide the actual parameter value measured in each test by the corresponding average value to obtain the average image of each parameter. We set the average image of the maximum AE energy e of the coal gangue sample as X0, and set each influencing factor (such as density ρ0 of the coal gangue sample before immersion, pH of the solution after immersion, calcium ion concentration C1, magnesium ion concentration C2, compressive strength σb and sound velocity v after immersion) as X1. Based on Matlab software programming, the grey relational degree between the maximum AE energy e and each influencing factor can be obtained, as shown in Table 7.
As can be seen from Table 7, all relational degree coefficients are larger than 0.5. In the influencing factors of the maximum AE energy of samples, the largest influencing factor is the pH value of the solution before immersion, followed by the mass of the sample before immersion m0, the pH value of the solution after immersion, the density of coal gangue samples ρ0, the mass of coal gangue after immersion m. The results show that the pH of the solution under the water-rock action has a significant impact on the maximum AE energy of the sample, and the sample density and ion concentration of the solution also have a certain impact.
Multiple Regression Model of Compressive Strength
According to the grey correlation analysis, it is known that the calcium ion concentration C1 after immersion, the density ρ0 of the sample before immersion, and the sound velocity v after immersion will affect the mechanical properties of coal gangue samples. According to Table 1 and Table 5, we can establish a fitted model for the compressive strength of the coal gangue sample with respect to C1, ρ0, and v. Based on the least square method to establish a multiple regression model, where the independent variables of the regression model are C1, ρ0, and v, and the regression target variable is the uniaxial compressive strength of the coal gangue sample, assuming:
In equation (1): the calcium ion concentration after immersion C1, the sample density ρ0 before immersion, and the sound velocity v after immersion are the fitted values of the uniaxial compressive strength of the coal sample. C, x, y, and z are parameters to be determined.
By taking logarithms on both sides of equation (1), we can obtain the following equation (2):
Record the measured value of the compressive strength values in each test as
According to equation (3), the sum of the squares of the errors is as follows:
Let
According to the least square method, let
We obtained four equations, using σb, C1, and v to solve the equations using MATLAB software, and obtained the unknown parameters x, y, z, η, then got the values of the parameters x, y, z, and C in the model. Finally, the multivariate regression fitting model of σb with respect to the calcium ion concentration C1 after immersion, the density ρ0 of the sample before immersion, and the sound velocity v after immersion as in equation (5):
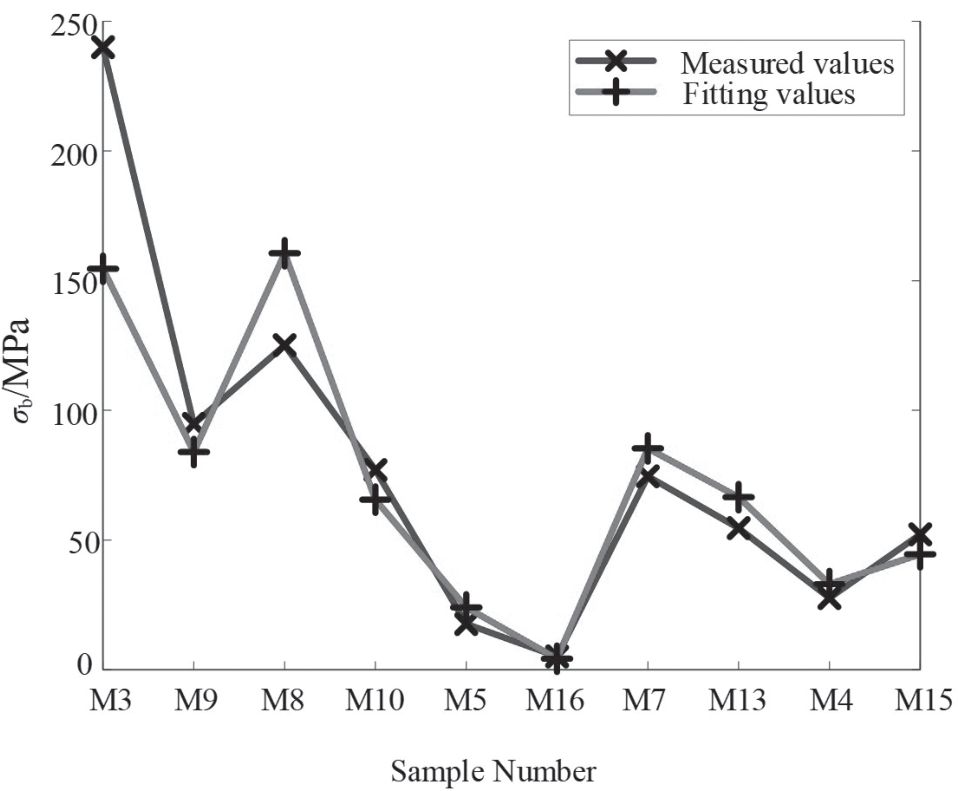
The correlation coefficient R=0.89 and the probability of zero correlation P=0.0005, indicating that the reliability of the regression model is high. The comparison curve between the fitting value and the measured value of the compressive strength of the coal gangue samples is shown in Fig. 11.
Multiple Regression Model for Maximum Emission Energy
Similarly, the least square method was used to establish a fitted model of the maximum AE energy with respect to the pH value of the solution before immersion, the initial density ρ0 of the sample before immersion, the initial mass m0, and the sound velocity v0 before immersion, and the following regression equation was obtained:
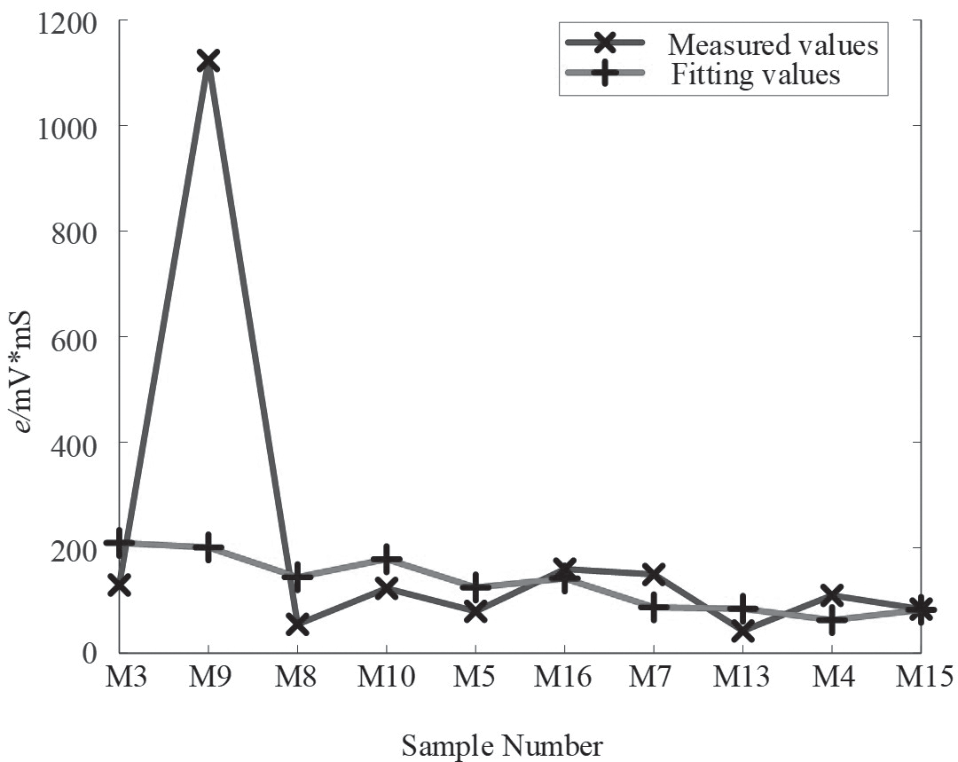
The correlation coefficient R=0.98 and the probability of zero correlation P=0.001, indicating that the reliability of the regression model is high. The fitted value of the maximum value of AE energy of the coal gangue sample and the comparison curve of the measured value are shown in Fig. 11. The comparison curve between the fitting value and the measured value of the maximum AE energy of the coal gangue samples is shown in Fig. 12.
It can be concluded that: with the pH value of the solution before immersion, the initial density ρ0 of the coal gangue sample before immersion, the initial mass m0, and the sound velocity v0 in the coal gangue sample before immersion, we can predict the maximum value of AE energy of coal gangue samples from the same geological source during uniaxial compression.
Conclusion
By experiments of soaking coal gangue in 5 kinds of solutions and acoustic emission test during the compression process, we obtained the following results:
(1) The mass of the coal gangue samples changed after immersion in chemical solution, its changes were significantly affected by pH and more sensitive to acidic solution.
(2) After the action of acid and alkali solution, the uniaxial compressive strength of the coal gangue sample is significantly higher than that of the sample soaked in neutral solution. The lower the pH values of the solution, the greater the compressive strength. Moreover, an acidic chemical solution has a great influence on the characteristics of coal gangue samples. The reason may be that after the coal gangue sample is soaked in an acid/alkali solution, some minerals around the pores and cracks expand under the action of the acid/alkali solution, resulting in the closure of these cracks and pores.
(3) The AE energy phenomenon of coal gangue samples exhibits periodic changes during the uniaxial compression process; when the stress level increases, there is an obvious AE phenomenon. The cumulative AE energy of the coal gangue sample during uniaxial compression increased sharply, indicating that a large number of micro-cracks at the internal structure of the coal gangue sample gathered at this time to form a large crack, and linked up gradually to form a main crack under the action of load, along which the coal gangue sample destabilized and broke.
(4) We analyze the factors affecting the compressive strength and the maximum AE energy by the grey relation analysis. Based on the least square method, we establish the multiple regression models of the compressive strength and the maximum AE energy, which can provide theoretical references for the mechanical analysis of coal samples and other subsequent studies.
In this paper, only a kind of rock sample was used in the experiment, so in the future, we can conduct experiments on other coal samples other than coal gangue. In addition, electron microscopy scanning tests can be conducted to analyze the changes in the composition of rock samples before and after immersion; In addition, acoustic emission tests during the compression process of rock samples that have not been soaked can also be conducted for comparison.

