

Introduction
Ecological Health (EH) is one of the most important issues in environmental management. How to evaluate the regional ecosystem health quantitatively is of great significance to the sustainable development of cities [1-3]. The research focuses on the relationship between urbanization and ecosystem health [4-6]. Especially in the study of developing countries [7, 8]. Among them, the ecosystem health of coal cities is affected by both urbanization and coal mining activities [9, 10]. Due to the different development stages and geological conditions of coal cities, there are not many related studies, and the impact mechanism is not clear, which leads to challenges in environmental management and urban development.
Ecosystem health is mainly manifested in the ability of an ecosystem to meet the reasonable needs of human development, and its health will directly or indirectly affect the well-being of human beings [1]. Although previous studies have conducted comprehensive assessments of regional ecosystem health, establishing a unified framework for monitoring and assessing ecological health is a challenge due to the heterogeneity of regional landscapes [11]. In the field of ecosystem health assessment, the commonly used frameworks include pressure-state-response (PSR) [12], Driving Force Pressure State Influence Response Management (DPSIRM) [13], and “Vitality-Organization-Resilience-Ecosystem Services” [14]. The improved “Vitality-Organization-Resilience-Ecosystem Services” (VORE) model can effectively realize the combination of ecosystem function and state attributes. In general, the established assessment framework cannot reflect the evolution characteristics of regional ecosystems, especially since there are few studies on the spatio-temporal changes of ecosystem health in ecologically fragile coal-resource-based cities. Therefore, it is urgent to evaluate the evolution law of ecosystem health of coal-resource-based cities from the space-time dimension and provide the basis for the development strategy of coal-resource-based cities.
China is in a period of rapid urbanization, and the demand and scale of construction land are expanding. The regional socio-economic and ecological problems caused by construction sprawl occur frequently [15- 19]. In particular, China’s coal resource-based cities, along with a large number of coal mining subsidence areas, result in a large number of landscape patterns increasingly broken, and the mature coal resource-based city is the most serious (construction sprawl and dynamic change of mining subsidence are the most serious). These problems are closely related to the changes in regional land use structure and ecosystem health. For example, Land Use and Land Cover (LULC) changes affect the spatial structure of ecosystems [20]. Urbanization is one of the major anthropogenic disturbances [21]. Rapid construction expansion is directly or indirectly associated with ecosystem degradation [22, 23]. Although some scholars pay attention to the research on coal-resource cities [24, 25], including ecosystem services and ecosystem health, there are few studies on the relationship between the evolution of coal-mining subsidence area, water system, LULC change, and ecosystem health. Only a few scholars have studied the relationship between EH and urban development [26]. Therefore, this paper analyzes the evolution characteristics of EH during the expansion of coal resource-based cities, analyzes the influence of coal mining subsidence areas on EH, constructs ecological control areas, and puts forward urban development strategies. It is not only the basis to solve these urban diseases, but also provides a scientific basis for the optimization of LULC structure and urban planning.
It is generally believed that urbanization has a direct or indirect impact on the degradation of ecosystem health. However, few scholars have explored the impact of urbanization and coal mining activities on ecosystem health, and few scholars have explored the development strategy of coal cities from the perspective of ecosystem health. The purpose of this study is to analyze the spatial and temporal evolution characteristics of EH in the Jining Metropolitan Area of Shandong Province, China, from 1990 to 2020, study the dual impact of urbanization and coal mining activities on the ecosystem health of coal cities, and then propose urban development strategies. It includes three research objectives: (1) LULC change in the Jining Metropolitan Area from 1990 to 2020. (2) the evolution of ecosystem physical health (EPH), ecosystem services (ES), and ecosystem health (EH) in the Jining Metropolitan Area (JMA) from 1990 to 2020. (3) urban development strategies of the five cities in JMA (Jiaxiang, Rencheng, Yanzhou, Qufu, and Zoucheng). The findings of this work are crucial for understanding the impact of coal mining activities and urbanization on EH in coal resource-based cities and will provide a scientific basis for urban planning and management of coal resource-based cities.
Methods
Study Area and Data
Jining City (34°25’~35°55’N, 115°54’~117°06’E) is located in Shandong Province, China, and it is one of China’s 14 major coal bases. The is 3551.2 km2. The population is 3.93 million.
The main data used in this paper are LULC, the Normalized Difference Vegetation Index (NDVI), and coal mining subsidence data for 1990, 2000, 2010, and 2020. The data on coal mining subsidence area were obtained from Shandong Provincial Lunan Geology and Exploration Institute. LULC and NDVI were obtained from the China National Geographic Information Resources catalog service (https://www. webmap.cn).
Research Framework and Methods
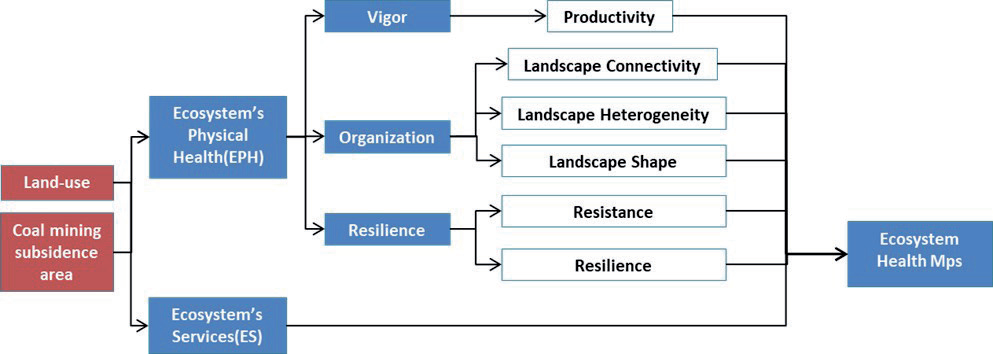
The author adopts the “vitality-organization-resilience-ecosystem services” framework system in this study [27], evaluation of ecosystem health (EH) from two aspects: Ecosystem Physical Health (EPH) and Ecosystem Services (ES). The formula can be expressed as:
The research framework of ecosystem health is shown in Fig. 1, which is divided into three steps to build ecosystem health maps.
The first step is to extract the relevant data by gridding the LULC and then use the Fragstats4.2 software to calculate the relevant landscape index. Finally, the VOR model will be used to evaluate the EPH.
The second step is to estimate the service value and analyze the spatial change combined with the grid method based on the LULC data.
The third step is to calculate the value of Ecosystem Health (EH) based on the previous calculation results, use the data normalization formula to normalize the value (0-1) in Excel, use the display function of ArcGIS, and divide it into 5 files (0-0.2, 0.2-0.4, 0.4-0.6, 0.6-0.8, 0.8-1).
The study area grid used in this paper is calculated using the grid method in ArcGIS software (the grid size is 2×2 km, and the study area generates 1017 grid cells in total).
Ecosystem Physical Health Assessment Model (VOR)
Ecosystem Vigor (EV)
The definition of ecosystem vitality (EV) is the primary productivity, activity, and metabolic capacity of the ecosystem. NDVI is the most widely used method for assessing ecosystem viability [28]. The value of “vitality” ranges from “0” to “1”. A value close to “0” indicates a relatively low productivity, and a value close to “1” indicates a relatively high productivity.
Ecosystem Organization (EO)
Different calculation methods can be used to evaluate ecosystem organization (EO) indicators. It can be analyzed from the perspective of landscape aggregation/fragmentation, landscape fractal dimension, and landscape diversity [27]. In order to evaluate EO, reference scholars used landscape heterogeneity, landscape connectivity, and landscape shape indicators [29, 30]. Three landscape indicators are used to measure landscape heterogeneity: AWMFDI, SHEI, and SHDI. IJI, CONTAG, and DIVISION are used to calculate landscape connectivity. Finally, the Perimeter-Area Fractal Dimension (PAFRAC) is used to evaluate the landscape shape (LS). The weights of LH, LC, and LS are obtained by combining the research results of related scholars and the characteristics of the study area [29, 30]. Landscape heterogeneity (LH) is 0.45, and landscape connectivity (LC) is 0.42. Finally, the Perimeter-Area Fractal Dimension (PAFRAC) is used to evaluate the shape of the landscape. The weight of this index is 0.13 because it has a small impact on the landscape pattern [14, 22, 23] (Table 1).
EO calculation formula:
EO stands for ecosystem organization, while LH, LC, and LS refer to landscape heterogeneity, landscape connectivity, and landscape shape.
Ecosystem Resilience (ER)
After long-term resistance and recovery, the ecosystem is healthy [31]. According to the research results of related scholars [22, 23, 29, 30], the formula and its coefficients are as follows:
Table 1.
Weight of each parameter.
| EO | Weight | Sub-index layer | Weight |
|---|---|---|---|
| LH | 0.45 | AWMFDI | 0.20 |
| SHDI | 0.15 | ||
| SHEI | 0.10 | ||
| LC | 0.42 | IJI | 0.17 |
| CONTAG | 0.15 | ||
| DIVISION | 0.10 | ||
| LS | 0.13 | PAFRAC | 0.13 |
Table 2.
ER coefficient of each LULC type in JMA.
| Land use type | Cultivated | Forest | Grass | Water | constru | Unused |
|---|---|---|---|---|---|---|
| Resilience Coefficient | 0.4 | 0.8 | 0.8 | 0.7 | 0.2 | 0.3 |
| Resistance Coefficient | 0.6 | 1.0 | 0.6 | 0.8 | 0.3 | 0.5 |
ER refers to ecosystem resilience, “Resil” refers to the resilience of the ecosystem, and “Resist” refers to the resistance of the ecosystem.
Due to the disorderly expansion of JMA and serious human interference, this study emphasizes resilience. Therefore, give the weight of resilience (0.6) and the weight of resistance (0.4). The coefficients of each LULC type are shown in Table 2.
VOR Model
The formula of the VOR model is as follows:
Among them are EPH (ecosystem physical health), V (vitality), O (organization), and R (resilience).
The comprehensive EPH of a region depends on the health of the ecosystem. The EPH criterion is based on meeting the supply capacity of human ecosystem services (ES) and the needs of animals [32].
The EPH index (vitality-organization-resilience) and the comprehensive EPH value are normalized (0-1) to be similar. EPH statues are divided into five categories: very good (0.80 to 1), good (0.60 to 0.80), average (0.40 to 0.60), weak (0.20 to 0.40), and very weak (0 to 0.20).
Ecosystem Service Value (ESV) Coefficient of LULC Type
Xie Based on the expertise of 700 ecologists in China, the ecosystem service classification and equivalent tables were revised using the method of Costanza [33, 34]. Specifically, the ESV equivalence coefficient per unit area is defined as equal to 1/7 of the average economic value of grain production per unit area of cultivated land. The formula is as follows:
Based on the results of previous studies [26, 35], ESV coefficients of each LULC type in JMA were obtained (Table 3), and their accuracy was verified.
EH LISA Analysis
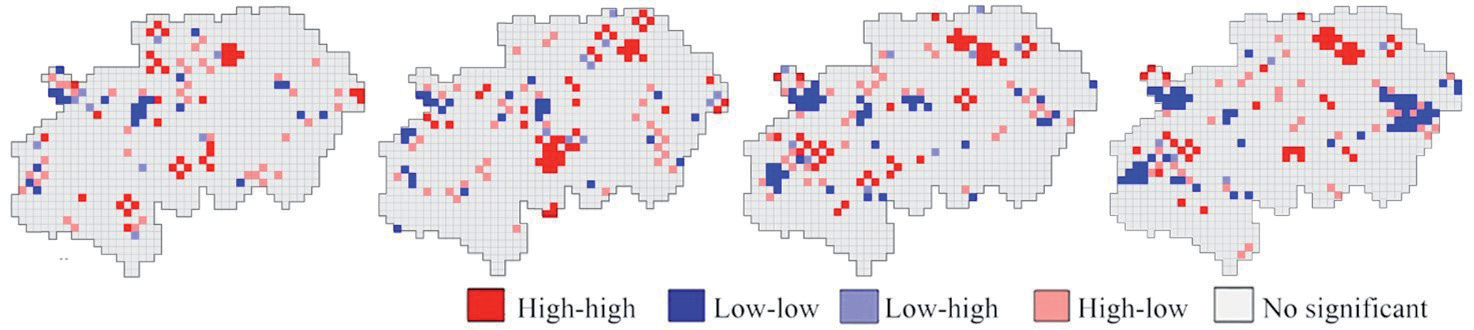
Local Moran’s I Index is used to measure the spatial autocorrelation [36].LISA is divided into four different cluster types: high-high (HH), low-low (LL), high-low (HL), and low-high (LH). It was used to determine the EH model for 1990, 2000, 2010, and 2020. Use GeoDa software for spatial analysis.
Table 3.
ESV coefficients of each LULC type in JMA (Yuan/ha/year).
Results
Dynamic Changes in LULC from 1990 to 2020
Table 4, 5 shows that the LULC of JMA has undergone tremendous changes from 1990 to 2020. From 2000 to 2010, cultivated land and construction land experienced the greatest decrease and increase. Fig. 2 shows the evolution of LULC in the study area and shows the rapid expansion of construction and the rapid decline of agricultural land. In general, cultivated land, grassland, and forest land have been converted into construction in a large amount.
Ecosystem Physical Health (EPH) Assessment
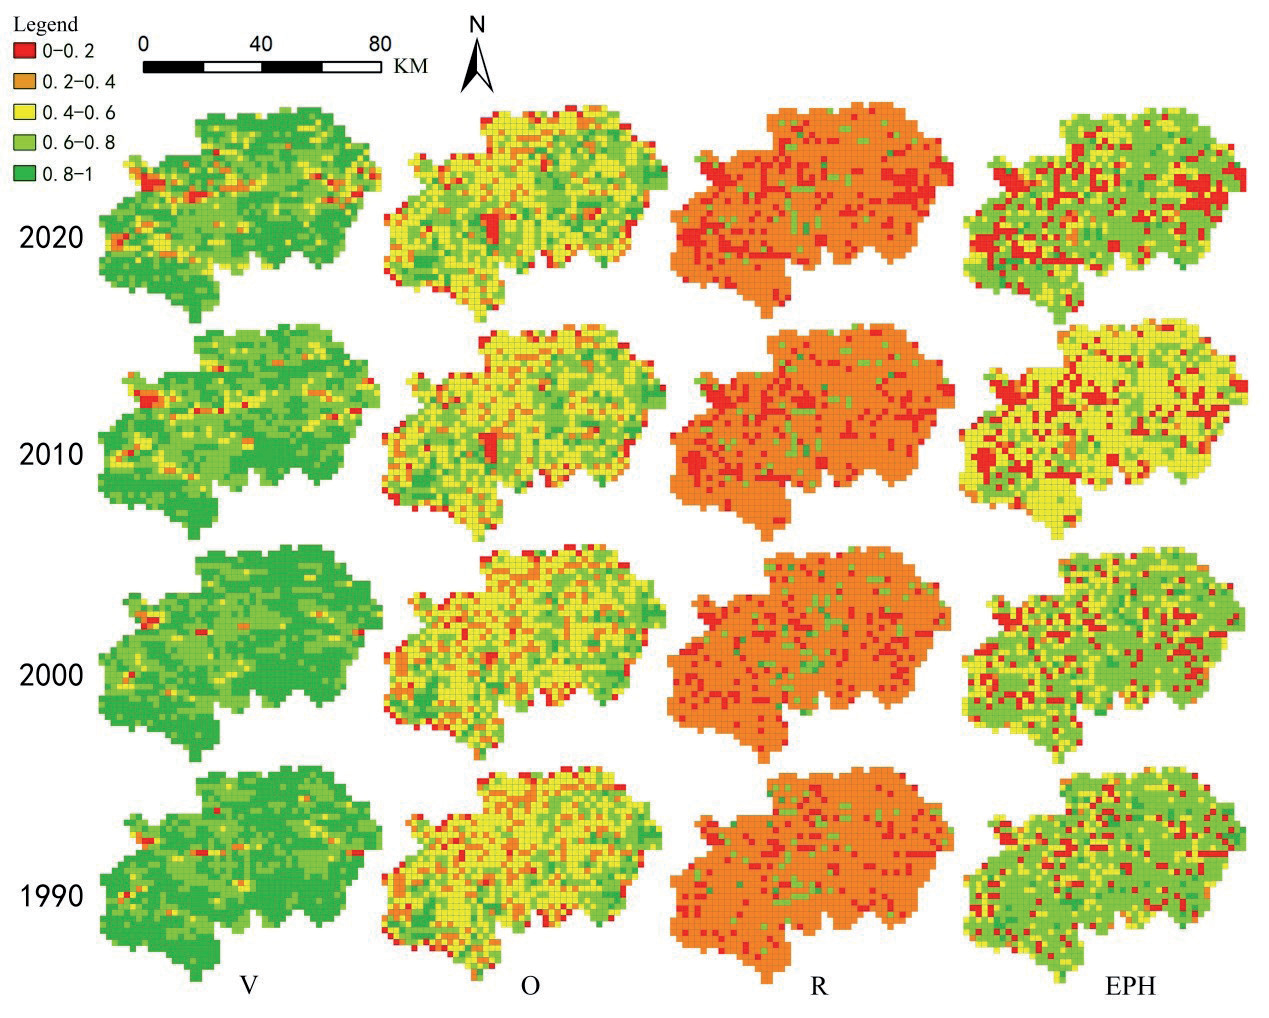
Fig. 3 show the temporal and spatial pattern of the EPH and its VOR index. From 1990 to 2020, the level of EPH and its VOR in the study area showed a gradual downward trend. Regions with very low EPH values are increasing, and regions with very high EPH values are decreasing, and they are all constantly changing. Regarding the influence of the coal mining subsidence area on the EPH value, it can be found that from 1990 to 2020, the areas with very low EPH values were not within the coal mining subsidence area. On the contrary, the areas with very high EPH values are mostly in or near the coal mining subsidence area. In addition, most of the areas with very high EPH values are also within or near the coal mining subsidence area, showing a certain degree of human intervention and governance effects. However, the areas with very low EPH values are basically not within or near the coal mining subsidence area, and most of them are not even within the coal mining authority area, which excludes the assumption of direct interference from the coal mining subsidence area. Regions with very low EPH are mainly distributed in cities and their surrounding areas, such as Jiaxiang, Rencheng, Yanzhou, Zoucheng, and Qufu. This is due to the environmental damage caused by the urbanization of coal resource-based cities with coal mining as the pillar industry. According to the analysis, vegetation destruction (vitality) and reduced resilience are the main reasons, showing the process and results of urbanization disturbing the environment and promoting the deterioration of EPH.
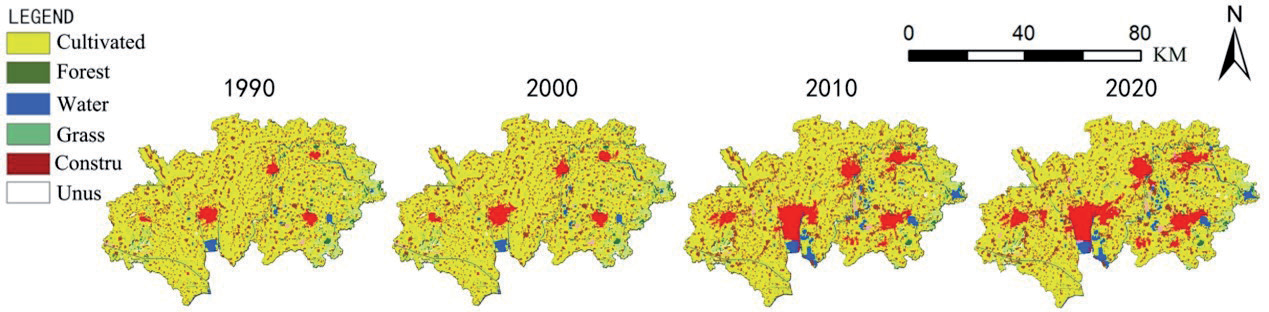
Table 4.
LULC changes in years in JMA from 1990 to 2020.
Table 5.
LULC interval area changes in JMA from 1990 to 2020 (ha).
| LULC types | Year | |||
|---|---|---|---|---|
| 1990-2000 | 2000-2010 | 2010-2020 | 1990-2020 | |
| Cultivated | -5605 | -18753 | -8473 | -32831 |
| Forest | 2 | -1970 | 68 | -1900 |
| Grass | 4 | -5709 | 71 | -5634 |
| Water | 404 | 5255 | 599 | 6258 |
| Construction | 5194 | 21544 | 7713 | 34451 |
| Unused | 1 | -367 | 22 | -344 |
Table 6.
EPH number of units (%) from 1990 to 2020.
The results show (Fig. 3, Table 6) that in 1990 and 2000, the EPH rated as high occupies the largest area, from 62.05% to 53.10%, showing a downward trend. From 1990 to 2020, EPH, which was evaluated as very weak, continued to increase, from 12.00% to 21.34%, showing a trend of continuous growth. Similarly, from 1990 to 2020, EPH, which was evaluated as very high, continued to decrease, from 5.60% to 3.44%. The EPHs evaluated as very weak, high, and very high are constantly changing. The worsening EPH is attributed to the impact of the urbanization of coal resource-based cities with coal mining as the pillar industry on the environmental damage. Mitigation and optimization of EPH attribution Man-made and policy interventions in the treatment of coal mining subsidence areas. Shows the characteristics of deterioration-intervention-deterioration-re-intervention.
Ecosystem Service (ES) Assessment
According to the revised ESV coefficient, the ecosystem service value (ESV) of the study area from 1990 to 2020 is calculated. The ESV of the study area showed a continuous growth trend. Among them, the changes from 2000 to 2010 were the most dramatic, similar to the trend of Ecosystem Physical Health (EPH). Water systems have the highest value coefficient in ecosystem services (Table 3), and the water systems have been increasing over the past 30 years, most of which are wetlands evolved from moderate and heavy coal mining subsidence areas. This also reflects from the side that the coal mining subsidence area is a double-edged sword, destroying the original environment, but creating a new environment whose ecological service value is still very high.
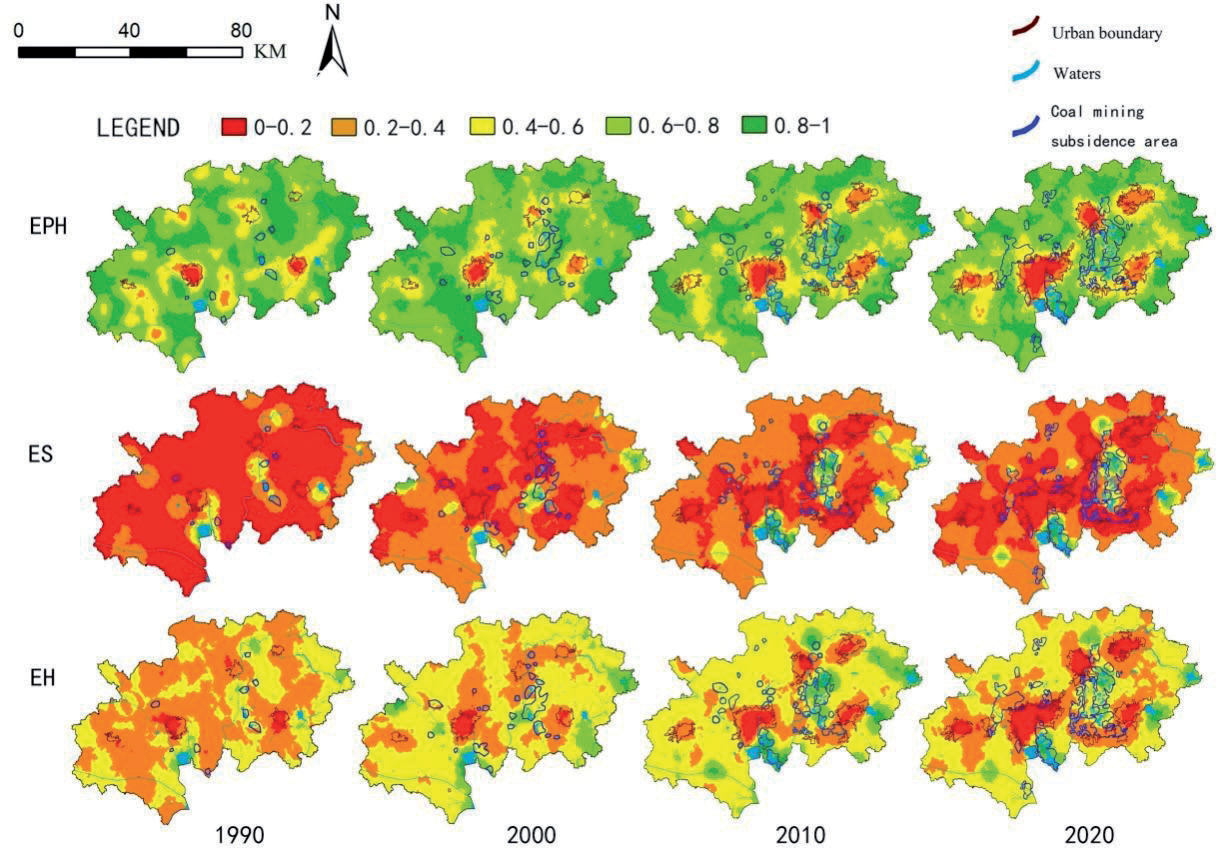
Through the grid method, by determining the LULC attributes of each grid, according to the ecological service value coefficient (Table 3), the ecosystem service value can be projected in the entire study area, but due to the ES value It is not a normal distribution; the value is concentrated between 0-0.2, and it is in a partial peak distribution. In ArcGIS, by interpolating the obtained ES data and then normalizing the data (0-1) and standardized classification again, the obtained (Fig. 4) can see the level of ES in a more clearly structured way.
Fig. 4 shows that areas of high ecosystem value are increasing, while low value areas are changing. The areas with high ecosystem value are mainly along the Sihe River, the east and north shores of Nansi Lake, Green Core, Nishan, and Xiwei Reservoir. The permanent wetland group (Green Core) formed by the accumulated water in the heavy coal mining subsidence area is also on this line, which is basically consistent with the conclusion of the ecological system physical health (EPH) and also experienced huge changes in 2000-2010. According to the previous analysis, it is related to the rapid development of urbanization and coal mining activities in this period, the expansion of coal mining subsidence areas, and the deterioration of the environment. At the same time, according to the increase in areas with high ecosystem service value within the coal mining subsidence area from 1990 to 2020, the formation and development of the coal mining subsidence area are related to the increase in ecosystem service value. In general, urbanization and coal mining activities are the main reasons that lead to changes in the value of ecosystem services.
Ecosystem Health (EH) Assessment
Evolution of EH in JMA
Based on the previous calculation results of Ecosystem Physical Health (EPH) and Ecosystem Services (ES) and formula (1), the value of Ecosystem Health (EH) is calculated using the data normalization formula, normalize the value (0-1) in Excel, use the display function of ArcGIS, and divide it into 5 files (0-0.2, 0.2-0.4, 0.4-0.6, 0.6-0.8, 0.8-1), and the values of ecosystem physical health (EPH), ecosystem services (ES), and ecosystem health (EH) were obtained. In ArcGIS, the obtained data were interpolated, normalized (0-1), and standardized to obtain Fig. 4.
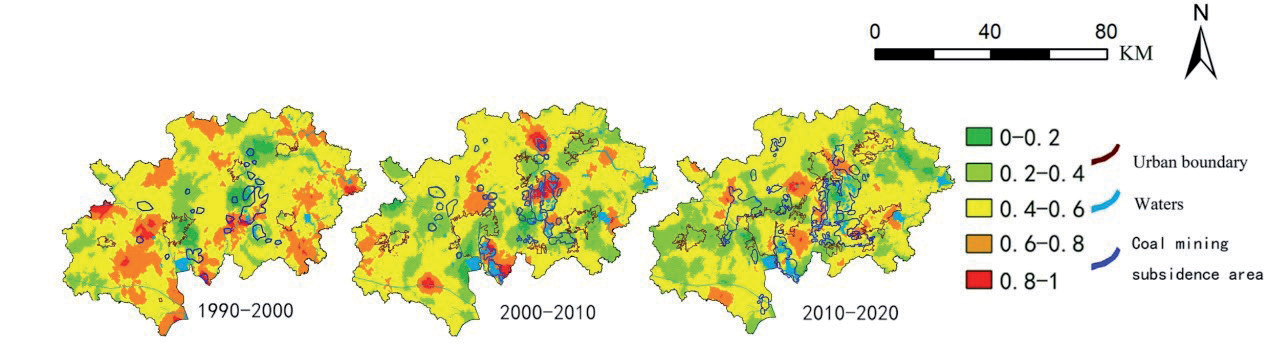
The results show that from 1990 to 2020, the deterioration of EH in the study area shows a trend of gradual increase with construction expansion. The areas with high scores are increasing, and the areas with low scores are increasing, and both are changing. Regarding the influence of the coal mining subsidence area on the EH value, it can be found that from 1990 to 2020, the areas with very low EH values were not within the coal mining subsidence area. On the contrary, many areas with very high EH values are within or near the coal mining subsidence area. Such as Green Core and the east and north shores of Nansi Lake. On the whole, the areas with very high EH values within or near the coal mining subsidence area are increasing, mainly in the green core and the Jining No. 2 and 3 coal mines on the east bank of Nansi Lake. This is obviously related to the formation of the coal mining subsidence area. It can be concluded that the formation and development of coal mining subsidence areas have a positive linear relationship with the EH value.
Areas with a very high EH value are basically within or near the coal mining subsidence area, showing a certain degree of human intervention and governance effects. However, areas with very low EH values are basically not within or near the coal mining subsidence area, which excludes the assumption of direct interference from the coal mining subsidence area. Regions with very low EH values are mainly distributed in construction and their surrounding areas. This is due to the environmental damage caused by the urbanization of coal resource-based cities with coal mining as the pillar industry. According to the analysis of EPH and ES, this point is also verified.
The EH values of the five cities in JMA fluctuate to varying degrees. During the period from 1990 to 2000, the EH value of the study area showed some improvement. Rencheng and Zoucheng were affected by urbanization and coal mining activities. The EH value decreased and the range expanded with the expansion of construction. From 2000 to 2010, the EH values of Jiaxiang, Rencheng, Yanzhou, Zoucheng, and Qufu were affected by urbanization and coal mining activities, and the EH value decreased and the range expanded with the expansion of construction. During the period 2010- 2020, similar to the period 2000-2010, it continues to be affected by urbanization and coal mining activities, and the low EH area expands with the expansion of construction. Among these five cities, Rencheng, Yanzhou, and Zoucheng have the fastest construction expansion. The influence of urbanization and coal mining activities on the EH value is very obvious, and the reasons for this are worth exploring.
Fig. 5 shows the rate of change of EH from 1990 to 2020 (use the data of the next year minus the data of the previous year, and then normalize the difference into 5 levels. The higher the score, the greater the change). In all periods, 1990-2000, 2000-2010, and 2010-2020, the EH value changed with time, and the regions with the most dramatic changes during 1990-2000 were evenly distributed throughout the study area. From 2000-2010, the most drastic changes occurred in coal mining subsidence areas, such as Green Core, the east and north shores of Nansi Lake, and the northern part of Yanzhou. In 2010-2020, drastic changes occurred in the entire study area in the southeast of Rencheng and the east and west of Yanzhou.
EH LISA Analysis
According to the results of the EH local spatial autocorrelation test, using the geographic distance matrix and the GEOda software LISA analysis, Fig. 6 shows the local autocorrelation clustering map of the ecosystem health. Due to the dynamic changes in the ecological source and coal mining subsidence area, etc., the quality of ecosystem health in areas close to the distance is similar, and the quality of ecosystem health has regional problems with a strong correlation. In 1990, some high-high accumulations of EH values were found mainly in the largest coal mining subsidence area (Green Core), northern Yanzhou, and Nishan Reservoir. Some low-low agglomerations are mainly located in the western part of Yanzhou, showing that urbanization is destroying the environment. 2000 was similar to 1990, and the situation was more obvious. High-high agglomeration was mainly located in the largest coal mining subsidence area (Green Core) and the east and north shores of Nansi Lake, north of Qufu. Some low-low agglomerations are mainly located around Jiaxiang, in the north of Rencheng, showing the destruction of the environment by urbanization. In 2010, it was discovered that some high-high agglomerations of EH values were mainly located in the east and north of Yanzhou and the east of Jiaxiang. Some low-low agglomerations are also mainly located around Jiaxiang, and their scope is expanding, as well as to the north of Rencheng, showing that urbanization is destroying the environment. 2020 is similar to 2010. Some high-high agglomerations are mainly located in Green Core, east and north of Yanzhou, and east of Jiaxiang, which are related to man-made and policy interventions in the management of coal mining subsidence areas during this period. Some low-low agglomerations are also mainly located around Jiaxiang, and their scope is expanding, as well as the southern part of Nishan Reservoir. The previous conclusions are further verified. The worsening EH is attributed to the environmental damage caused by the urbanization of coal resource-based cities with coal mining as the pillar industry, and the mitigation and optimization of EH is attributed to the management of coal mining subsidence areas and other human actions and policies. Intervention. Shows the characteristics of deterioration-intervention-deterioration-re-intervention.
Discussion and Conclusion
Discussion
Based on the previous analysis results, from 1990 to 2020, the construction of JMA increased by 3,4451 ha, the cultivated land decreased by 3,2831 ha, and the forest and grassland also decreased to varying degrees. The water area has increased by 6258 ha, mainly due to the wetlands formed by the heavy coal mining subsidence land, mainly located in the middle of the JMA. Especially from 2000 to 2010, the LULC in the study area experienced the most dramatic changes, which are directly related to the rapid expansion of coal mining during this period of time to drive construction expansion. The impact of urbanization on LULC has been the consensus of academic circles; through the study of this paper, coal resource-based cities are no exception.
Changes in ecosystem health (EH) are all directly affected by urbanization. The impact of coal mining subsidence on ecosystem health (EH) is not significant. The evolution trend of EH can represent the evolution trend of EPH and ES. However, the specific characteristics of ecosystem physical health (EPH) and ecosystem services (ES) are different. This is due to the different characteristics reflected in different aspects. This is also part of the evolutionary characteristics of Ecosystem Health (EH).
Evolving characteristics of ecosystem physical health (EPH). Overall, EPH and its VOR values in JMA have decreased over time (Fig. 3). V values show gradual deterioration over time in the west and north. O values show gradual deterioration over time in the middle. R values show gradual deterioration over time in the west, north, and east. The EPH evaluated as weak, very weak, high, and very high is constantly changing. The deterioration of EPH is attributed to the environmental damage caused by the urbanization of the coal mining industry in coal resource-based cities; mitigation and optimization of EPH are attributed to man-made and policy interventions such as mining subsidence area management. It showed the characteristics of deterioration-intervention-re-deterioration-re-intervention. At present, there are few studies on the evaluation of ecosystem physical health (EPH) of coal-resource-based cities. It is the first time to put forward the evolution characteristics of physical health (EPH) of a coal resource-based ecosystem by analyzing the spatial and temporal dimensions of the 30-year period.
The evolution of ecosystem services (ES) is characterized by the general trend that the areas of high ecosystem value are increasing and the low value areas are changing. Water systems have the highest coefficient of value among ecosystem services (Table 3) and have been increasing over the past 30 years, most of which are wetlands that have evolved from moderate and heavy coal-mining subsidence areas. It also shows that mining subsidence area is a double-edged sword, which destroys the original environment, but produces a new environment, and the ecological service value of this new environment is very high. At present, there are few studies on the evaluation of ecosystem services (ES) of coal-based cities, and some scholars have put forward the impact of the change in water system of coal-based cities on ES [37]. The findings of this paper further verify this conclusion and expand the empirical scope.
In previous work, the ES method or EPH method was considered separately in the study of ecosystem health (EH) [37-40]. Through this study, it is found that the VORE model combining ES and EPH can analyze the EH of coal resource-based cities more comprehensively.
In view of the current evolution of ecosystem health (EH) under the influence of urbanization and coal mining activities, the following measures are recommended to alleviate the relationship between ecosystem health, changes in coal mining subsidence areas, and urban development.
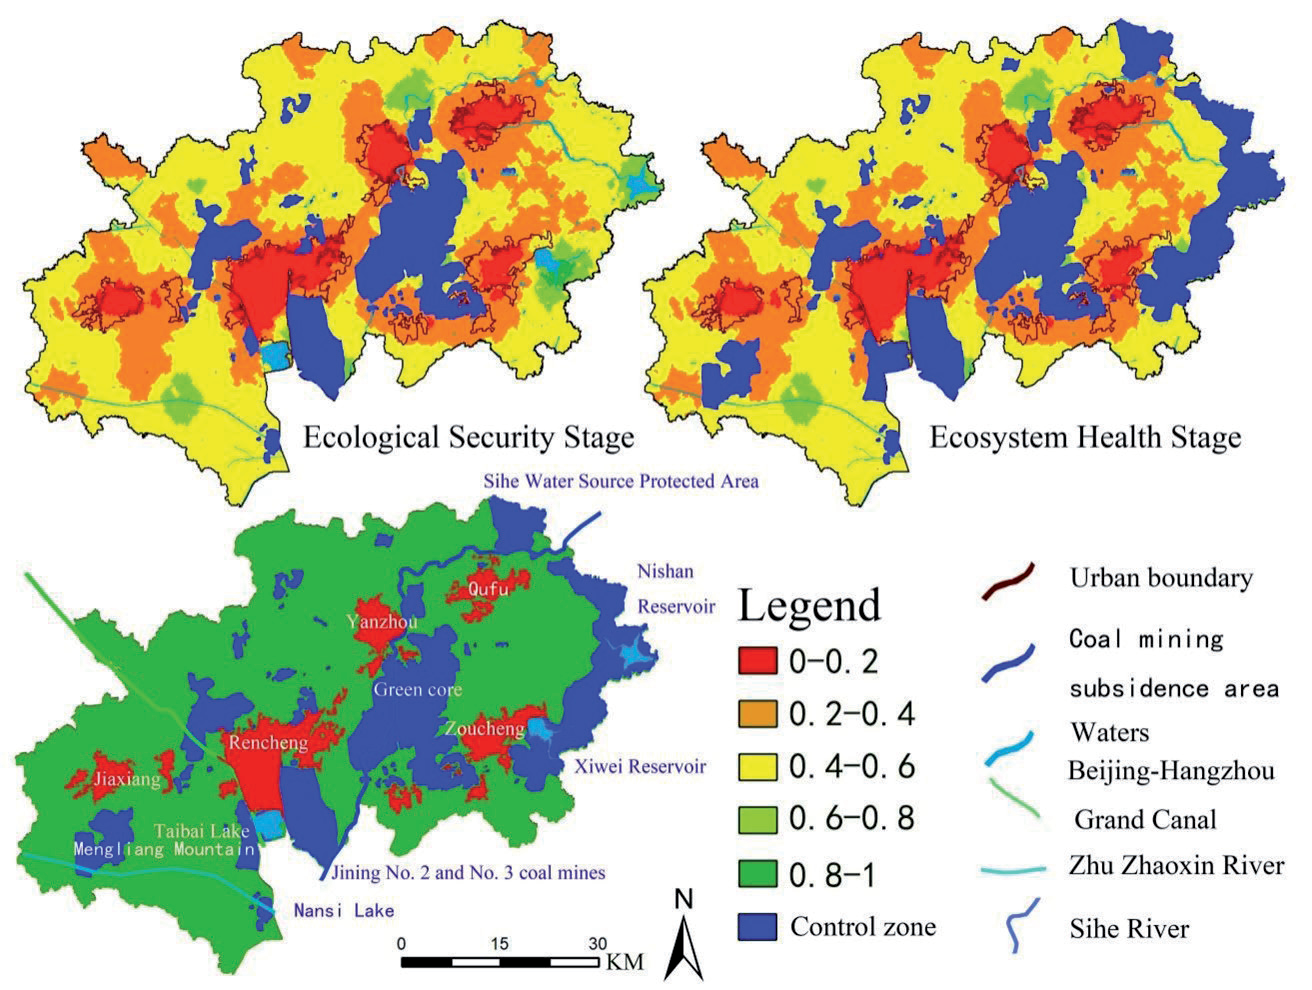
1. In view of the dynamic changes of coal mining activities and coal mining subsidences, it is recommended to set up targeted ecological control areas in the ecological security stage (short-term) and ecosystem health stage (long-term).
The ecological control areas in the ecological security stage include the range of coal mining subsidence areas that limit coal mining activities to a controllable range. The ecological control area in the ecosystem health stage includes not only the range of coal mining subsidence area, but also the water and soil conservation area, water and soil conservation area, and the ecological control area of the entire study area (Fig. 7).
2. The five cities in the study area need to adopt different urban development strategies according to their own environment and conditions (Table 7).
The establishment of long-term and short-term targeted ecological control areas will change the development direction and strategy of the city. In the ecological security stage, Jiaxiang can expand to a certain extent. The surrounding area of Rencheng is restricted by the ecological control area and can only be developed in an infill type. The east and south of Yanzhou are restricted by the ecological control area and can only develop linearly to the west and north. Zoucheng and Qufu also encountered the same problem and could only develop linearly to the south and north. In the ecosystem health stage, the southern part of Jiaxiang is also restricted by the ecological control area. Linear development is recommended. The surrounding area of Rencheng is restricted by the ecological control area and can only be developed in an infill type. The east and south of Yanzhou are restricted by the ecological control area. It can develop linearly to the west and north, and the east of Zoucheng and Qufu is also restricted by the ecological control area and linear and infill integrated development.
Conclusion
Through research, we found that:
1. Based on the VORS model, the authors found that the changes in EH were directly affected by urbanization. The influence of coal mining subsidence area on EH is not significant.
2. The influence of coal mining on EH is mainly embodied in the formation of coal mining subsidence areas, and the effect is double-sided. In the early stage of coal mining, the subsidence of coal mining leads to the destruction of vegetation and the decline of EH. In the later period, the water accumulated in the subsidence area formed the water area after the stabilization, improved the ecosystem service value, and led to the EH level promotion.
3. Through the analysis of EH, the feasible direction of urban development is found. Based on this, the ecological control area is constructed, and the urban development strategy is put forward.
Based on the research findings, we can summarize the dual effects of urbanization and coal mining activities on ecosystem health in coal cities: the deteriorating EH is attributed to the impact of urbanization with coal mining as the pillar industry on environmental damage in coal resource-based cities, and the alleviated and optimized EH is attributed to human and policy interventions such as coal mining subsidence area governance. It shows the characteristics of deterioration-intervention-re-deterioration-re-intervention. Timely human intervention in coal mining subsidence areas is the key to reducing the impact of coal mining activities on ecosystem health. In addition, the development planning of the coal city needs to be planned in advance according to the development of the coal mining subsidence area, construct an ecological control area, and put forward an urban development strategy.
Limitations and future research directions of the paper: The study area is the Jining Metropolitan Area of Shandong Province, China. The groundwater level of this coal city is relatively shallow, and water will be formed after coal mining subsidence. Some areas even have permanent water accumulation and form wetlands. This type of coal city also belongs to a special category in China. Since it is necessary to distinguish the development stage of coal cities, the complexity and difficulty of environmental management are great, and it also causes great confusion in urban development. This study only studies a coal city. In the future, it is necessary to study coal cities at different stages of development and finally accumulate more experience to form a coordinated development system of ecology and urbanization in such coal cities, which can provide ideas and a basis for the development of such coal cities. It can also provide a basis for further research by relevant scholars.

