

Introduction
China’s urbanization is characterized by fast speed, large scale, and high resource consumption [1], and it is estimated that China’s urbanization rate will reach 65.5% in 2025 [2]. However, during this process, it is easy to overlook the balance between ecological environmental protection and development, leading to a series of ecological problems, such as air pollution, loss of natural space [3], and shrinking of green space area. The Huizhou region is the birthplace of the Xin’an River. A large amount of sewage discharged during its industrialization and urbanization stages passes through the Xin’an River, leading to the deterioration of water quality and a biological crisis in some waters. The Xin’an River Basin Ecological Compensation Mechanism Pilot Program began in 2012, with the upstream city of Huangshan, Anhui Province, as the main target. Huangshan City is an ecologically fragile and economically underdeveloped area [4]. According to the latest public statistics from the Huangshan City Statistical Yearbook, the percentage of days with excellent air quality in the study area declined by 1.3% in 2022 compared to 2021, the wetland area declined by 1.6%, and the degree of wetland fragmentation increased. Local residents’ demand for an ecologically livable environment has become stronger and stronger, and city sustainability and the ecological livability of human settlements have become important issues in urban development.
Many sorts of urban development models have been presented to deal with the issues generated by urban development and achieve the sustainable growth of cities, such as landscape cities, low-carbon cities, and satellite cities [5]. The vision of people-centered urban development has inspired a new concept of urban development, namely the eco-livable city [6]. The research on the eco-livablity of cities is one of the hotspots in academia. However, the exact definition of the concept is still unclear. Howard first introduced the concept of an idyllic city in the late nineteenth century [7], which provided a preliminary study of urban livability. The State Council put forward the concept of a “livable city” initially in 2005, but there is no scientific evaluation system for the evaluation of a “livable city”. The Scientific Evaluation Criteria for Livable Cities issued by the China Urban Science Research Association in 2007 pointed out that the evaluation of urban livability contains six levels, namely social civilization, beautiful environment, economic affluence, resource bearing, public safety, and convenience of life [8]. The evaluation of urban livability, from the perspective of urban planners, is to measure the balanced development mode of multiple elements of the city.
Current academic research on eco-livable cities mostly focuses on the design of evaluation models, the construction of indicator frameworks, and the identification of indicators from multi-source data. In terms of constructing evaluation indexes, most scholars comprehensively construct urban livability evaluation indexes from the three levels of economy, society, and environment [9–11]. For example, Dong Xuanyan et al. conducted an evaluation study on the ecological livability of residential areas in Shenzhen City from four aspects: ecology, climate, humanity, and landscape [12]. Li Chen analyzed the degree of influence of three dimensional elements, namely, living conditions, quality of the urban environment, and infrastructure and public services, in the overall urban habitat [13]. A thorough framework for evaluating urban livability was developed by Urooj et al. using six different dimensions: personal well-being, urban economy, quality of life in terms of infrastructure and connectivity, urban environment, and spatial planning and urban development [14]. Some scholars have also studied the impact of single factors, such as exploring the influence of resident satisfaction [15], population density [16], spatial and temporal changes in land use [17], quality of life [18], water [19], or subjective well-being [20], on livability.
From the viewpoint of data selection, the data of the subjective evaluation method mostly originates from social surveys [21], questionnaires [22], etc., which is laborious to obtain and difficult to meet the evaluation of large-scale urban eco-livability. The objective evaluation method starts from data, which can avoid the subjective uncertainty of the results. Data are usually derived from multiple sources, such as remote sensing data [23], POI geospatial data, and panel data for quantitative assessment [24]. Due to its characteristics of realism, accuracy, and rapid access, it has been widely used in urban ecological livability evaluation. A reasonable evaluation model requires comprehensive consideration of multiple indicators. Various evaluation methods are commonly used at home and abroad, such as the hierarchical analysis method [25–27], the fuzzy comprehensive evaluation method [28, 29], and the multilevel comprehensive evaluation method [30, 31]. The weights in the TOPSIS method are usually calculated with subjective assignments by experts and scholars or mathematical models, and the entropy weighting method is an objective allocation method using information obtained from data processing. Urban livability evaluation analysis has made extensive use of the entropy weight TOPSIS approach, which can increase the accuracy of the findings. For example, Fan Yanxiang used the entropy-weighted TOPSIS combination method to study the urban livability of 10 prefecture-level cities in Shanxi Province and to explore the key driving force for livability improvement [32].
In summary, scholars have currently conducted multidimensional studies around ecological livability. As far as the research scale is concerned, most of the researchers mainly take the city as a whole as the evaluation object to study the ecological livability of the city [33–35] and pay less attention to the regional level. Past studies mostly started from a subjective evaluation perspective and used the results of questionnaires or interviews as data support, which may be influenced by subjective factors and reduce the objectivity of the results. In addition, past studies have mostly focused on the livability of a certain city in a certain year, and it is more difficult to observe the evolution pattern in time and space. Meanwhile, most of the existing eco-livability evaluation indicators cover a wide range of indicators, including economic affluence, convenience of life, political civilization, cultural richness, and medical education level, but less consideration is given to the indicators of regional resources and pollution control, which cannot accurately reflect the connotation of eco-livability.
In order to address the issues raised above, this study focuses on the degree of livability that favors the ecological orientation. By taking the ecological environment of the Huizhou region as the research object and consulting the Huangshan City Statistical Yearbook and relevant data platforms, the study systematically compiles data on the region’s natural environment over the previous five years, including data on pollution control. This approach allows for the scientific development of the Huizhou region’s ecological livability assessment index system. The combinating method entropy weight TOPSIS method is applied to comprehensively evaluate the seven districts and counties in the Huizhou region. The data are then visualized using ArcMap10.8 to reveal the spatial and temporal evolution patterns, thereby improving the evaluation outcomes’ objectivity and accuracy. This paper constructs a livability evaluation index system favoring ecological factors, covering both the natural environment and human elements, thereby addressing the insufficient attention to ecological issues in existing research. Based on the evaluation results, policy suggestions for enhancing the ecological livability of Huizhou are proposed. These suggestions provide important theoretical support for local governments in urban planning and ecological environment management.
Study Area and Evaluation Indicator System
Study Area
The Huizhou region is located at the junction of Anhui, Zhejiang, and Jiangxi provinces. Its geographical scope for a government is six counties, namely: Huizhou Province, Shexian County, Yixian County, Huining County, Qimen County, Wuyuan County, and Jixi County. In modern times, the scope of the Huizhou area changes more frequently; the Huizhou area has been used as the name of the administrative division and is the predecessor of the city of Huangshan. 1987, with the official establishment of the city of Huangshan, Huizhou area, as the concept of administrative geography, gradually faded out. Huangshan City is located in the Yangtze River Delta region of East China. In 2019, the State Council announced the Outline of the Integrated Development Plan for the Yangtze River Delta Region, in which it is mentioned that it is essential to reinforce the prevention of the ecological environment and put forward a corresponding development plan for the three aspects of ecological protection, environmental control, and regulation [36]. Huangshan City straddles the Huaihe River Basin and Xin’an River Basin; the Huaihe River Basin is more populated, and the Xin’an River Basin is the best ecological environment in Anhui Province. Additionally, Huangshan City in Anhui Province is situated on the upper part of the Xin’an River, and Qiandao Lake downstream of the Xin’an River is an exceedingly high-quality freshwater lake in China. Accordingly, it is very important to protect the safety of water sources in the Xin’an River [37]. For example, the regulation of local industrial pollutant discharges and prevention is of great concern [38]. Huangshan City is located in two watersheds with different characteristics and large differences in natural environments, which is typical. As a result, using Huangshan City as an example, it is both theoretically and practically valuable to investigate the reality of ecological livability, as well as the influencing variables and regional geographical distribution.
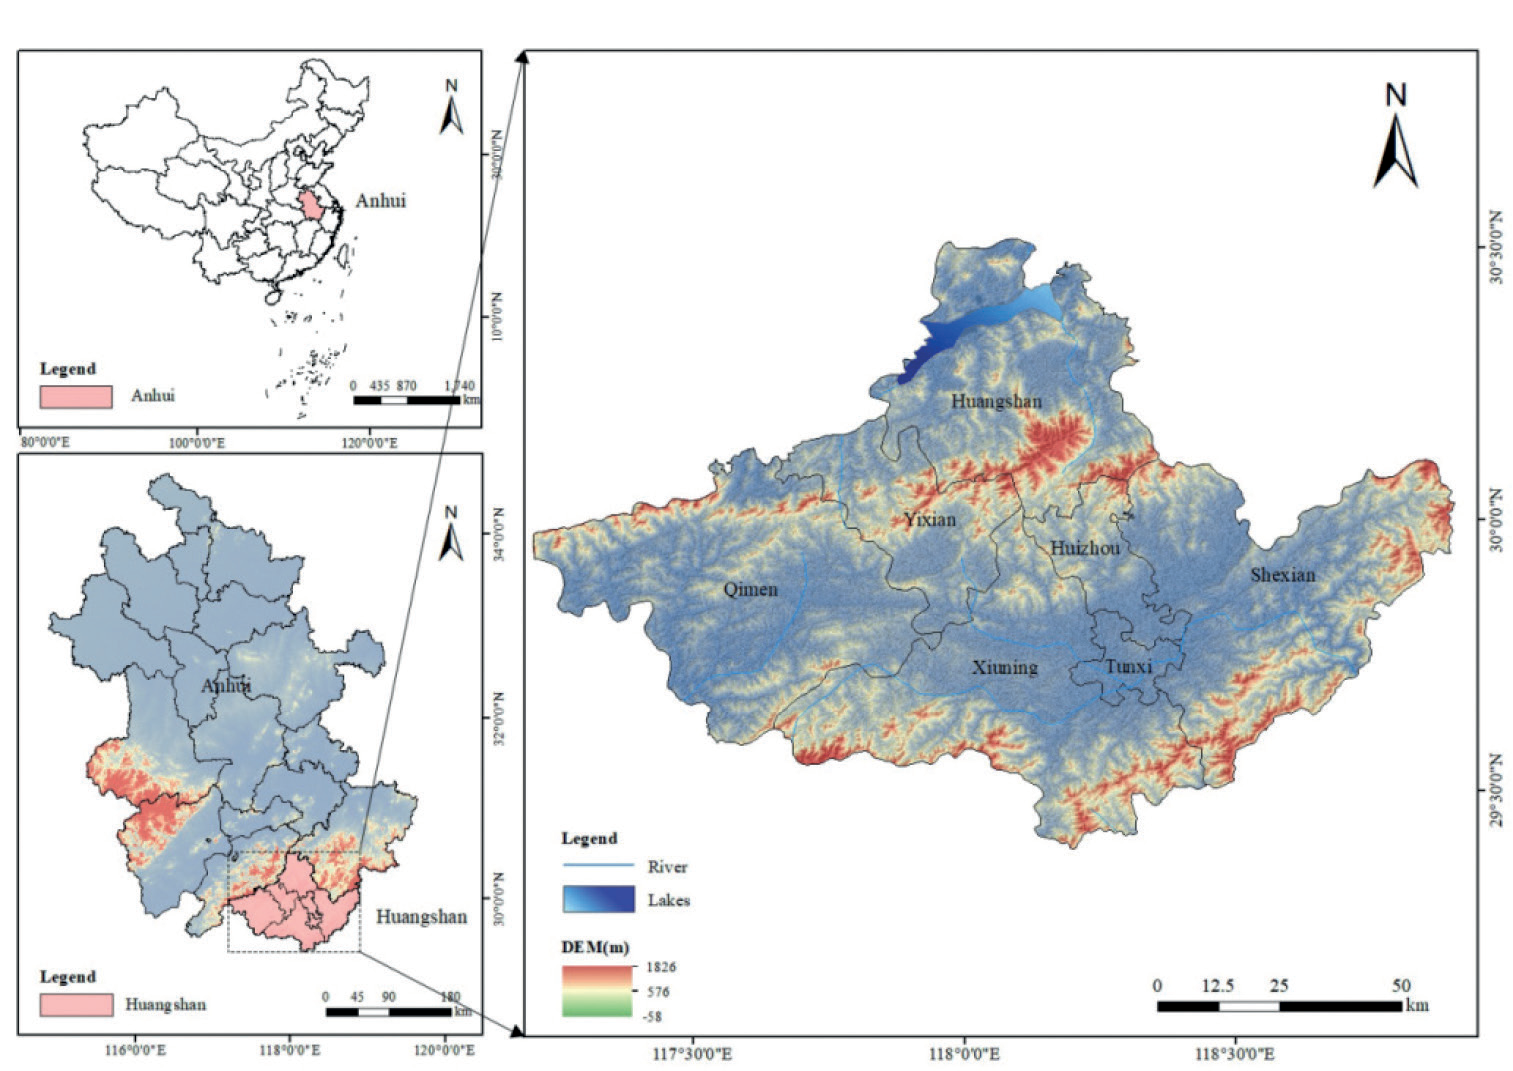
Considering the data accessibility and completeness, the ancient Hui District area selected in this paper is the seven districts and counties within Huangshan City with similarity in geological and climatic characteristics and cultural traditions as the research object, and the scope is shown in Fig. 1.
Indicator System Construction and Data Sources
In this paper, the ecological livability indicator data of seven counties and districts in the Huizhou region are selected as a sample study. Each indicator spans 2017– 2021. The source of indicator data is Anhui Provincial Statistical Yearbook, Huangshan Municipal Statistical Yearbook, Huangshan Municipal Meteorological Bureau, and Huangshan Municipal Housing and Urban-Rural Development Bureau, according to which the calculations are organized, and the individual missing data are made up using the mean value method. According to the previous analysis, combined with previous research results and the real situation [39–43], it can be seen that eco-livability is a complex and comprehensive concept, and eco-livability is a quantitative index to evaluate the degree of eco-livability. Based on the perspective of the human habitat ecological environment and considering the operability and availability of data, this paper finally selects 18 evaluation indexes of ecological livability in Huizhou based on relevant statistics by consulting relevant experts and inquiring about relevant domestic literature. These include five guideline layers: habitat, resource utilization, ecological maintenance, pollution treatment, and climate environment.
Habitat
Habitat is the most closely related to residents’ lives when building co-livable cities, and it is also one of the most concerned focuses. On the one hand, it includes the ecological environment, such as total water resources and annual precipitation; population density has a close relationship with the perception of the human environment [44]. Therefore, population density is also included in the eco-livability indicators. On the other hand, it also includes the living environment, such as per capita park green space area, per capita housing construction area, and green space square area. Urban green space has the functions of protecting the urban environment, improving the urban microclimate, providing safety protection, and beautifying the city, so the green space area per capita is an important indicator of eco-livability in poor cities.
Resource Utilization
An essential component of eco-livable cities is resource use, which includes both the level of popularization and its efficiency. The former is investigated using one indicator of energy use per unit of GDP, while the latter selects three indicators of total urban water supply, daily per capita domestic water consumption, and gas-using population as the focus of examination.
Ecological Preservation
Ecological maintenance is an indispensable aspect when establishing eco-livable cities and determines the sustainability of urban eco-livability. Ecosystems should not be a one-way output of ecological services, and the maintenance of ecosystems is conducive to the provision of better ecological services to the city, which facilitates the city’s long-term and healthy development. Based on the importance of forest and river ecosystems and the availability of data, the following indicators were selected for examination: the coverage of greening in built-up areas; the area of afforestation in the current year; the proportion of the public facility management, environmental, and water conservation industries to the total amount invested in fixed assets across society; and the share of expenditures on forestry, agriculture, and water activities in the expenditures of the local financial budget.
Pollution Control
Pollution emissions are responsible for reducing the health of ecosystems and threatening the safety of human ecosystems. Therefore, the reduction and control of waste pollution generated during the production process is of vital importance, and pollution emissions and their management have also become an aspect of evaluating the degree of ecological livability of cities. Pollution emissions mainly examine the total amount of wastewater discharged; pollution control mainly examines the comprehensive utilization rate of industrial solid waste, the sewage treatment rate, and the total amount of industrial wastewater treated.
Method Description and Application
A reasonable assessment model must take into account a number of variables in a thorough manner when choosing an assessment model for urban ecological livability. The TOPSIS model in multi-criteria decision analysis can effectively quantify the results in complex decision-making situations, and it is widely used in the research of comprehensive evaluation of environmental livability [45–48]. Its advantage is that it can fully utilize the original data information to realize the precise ranking of the advantages and disadvantages of the evaluation objectives. This study measures the livability of different locations in Huizhou using the entropy weight-TOPSIS approach, building on the findings of earlier research. In comprehensive evaluation, the weight setting of indicators is crucial to the final result. Subjective assignment methods and objective assignment methods are the two categories of weight determination approaches that are most frequently utilized. The subjective weighting method is to determine the weights according to the relative weight of the indicator by human judgment, and the two most widely utilized techniques are the ring scoring method and the expert scoring method., etc. However, these methods rely too much on the emotional choice of residents, and emotions vary from person to person, which leads to a high degree of uncertainty in the evaluation results. Objective weighting methods are based on the information obtained from data processing to assign weights to the indicators, such as the entropy weighting method, the BP neural network method, etc. These methods start from the evaluation index data and are based on the data of the residents. These methods start from the evaluation index data and prevent the outcomes from being influenced by subjective influences. Since the differences in indicators have different impacts on the improvement of urban eco-livability, it is important to determine the indicator weights in an objective manner. The objective weighting approach of the multi-object and multi-indicator evaluation index system can be used in conjunction with the entropy weight method, and the weight can be easily and accurately calculated when there are more indicators and a larger data volume [49, 50]. Thus, in order to determine the weights of individual indicators, this research uses the entropy weighting approach. As indicated in Table 1. The following are the specific steps in the calculation:
Table 1.
Evaluation index system of ecological livability in the Huizhou region
Step 1: Build the initial evaluation matrix. Assume that there are n evaluation indicators and m programs to be evaluated. The original matrix A is shown in (1).
Step 2: Normalization to form a normalized decision matrix. The original matrix A needs to be normalized before data analysis.
Indicators positively affecting eco-livability are defined as.
Indicators that have an inverse effect on eco-livability are inverse indicators.
According to the positive indicator formula (2) and the negative indicator formula (3) to normalize the data, we can get the normalization matrix Z=(Zij)m*n(4) as shown in (5).
Step 3: Calculate the weight of indicators by using the entropy weight approach. Based on the results of the previous data normalization process, first calculate the weight of the jth indicator in the ith region, and the formula is as (6).
Next, the jth indicator’s entropy value, ej, is determined as follows (7):
Next, calculate the information utility value dj of the jth indicator; the larger the value, the more weight and importance of the indicator in the evaluation of eco-livability. The formula is as in (8):
Finally, the weights are assigned to the indicators to obtain the weights of each indicator Wj. The formula is (9).
Step 4: TOPSIS method for the ideal solution and composite score
Firstly, the weighted normalization matrix Tij is calculated, where Zij is the evaluation matrix after data normalization, Wj is each indicator’s weight as calculated through the entropy weighting technique, and the formula is as in (10).
Next, the positive ideal solution T + and the negative ideal solution T – are calculated for T, and the formula is as in (11).
Next, the distance of each scheme to the positive and negative ideal solutions is calculated as D+j and D–j, respectively, with equations as in (12).
Finally, the composite score C is calculated for each system layer, with the formula as in (13).
The composite score, also known as the degree of fit, indicates how close the rated object is to the positive ideal solution, that is, how close it is to the optimal solution. It is clear that Cj ϵ (0, 1). The closer Cj is to 1, the closer the ecological livability of the region is to the highest level, and the higher the level of regional livability. Conversely, the closer Cj is to 0, the farther the region’s ecological livability is from the highest level, and the lower the regional livability level is, which needs to be further improved. This research assesses the degree of ecological livability development in seven counties in the Huizhou region by grading each ecological livability component into five categories, ranging from low to high (Table 2).
Table 2.
Criteria for judging the level of eco-livability
| level of development | poorly | mediocre | general | favorable | ideal |
|---|---|---|---|---|---|
| closeness | [0–0.20) | [0.20–0.40) | [0.40–0.60) | [0.60–0.80) | [0.80–1.00) |
Results and Analysis
Evaluation of Urban Ecological Livability in the Huizhou Area
Overall Evolutionary Features
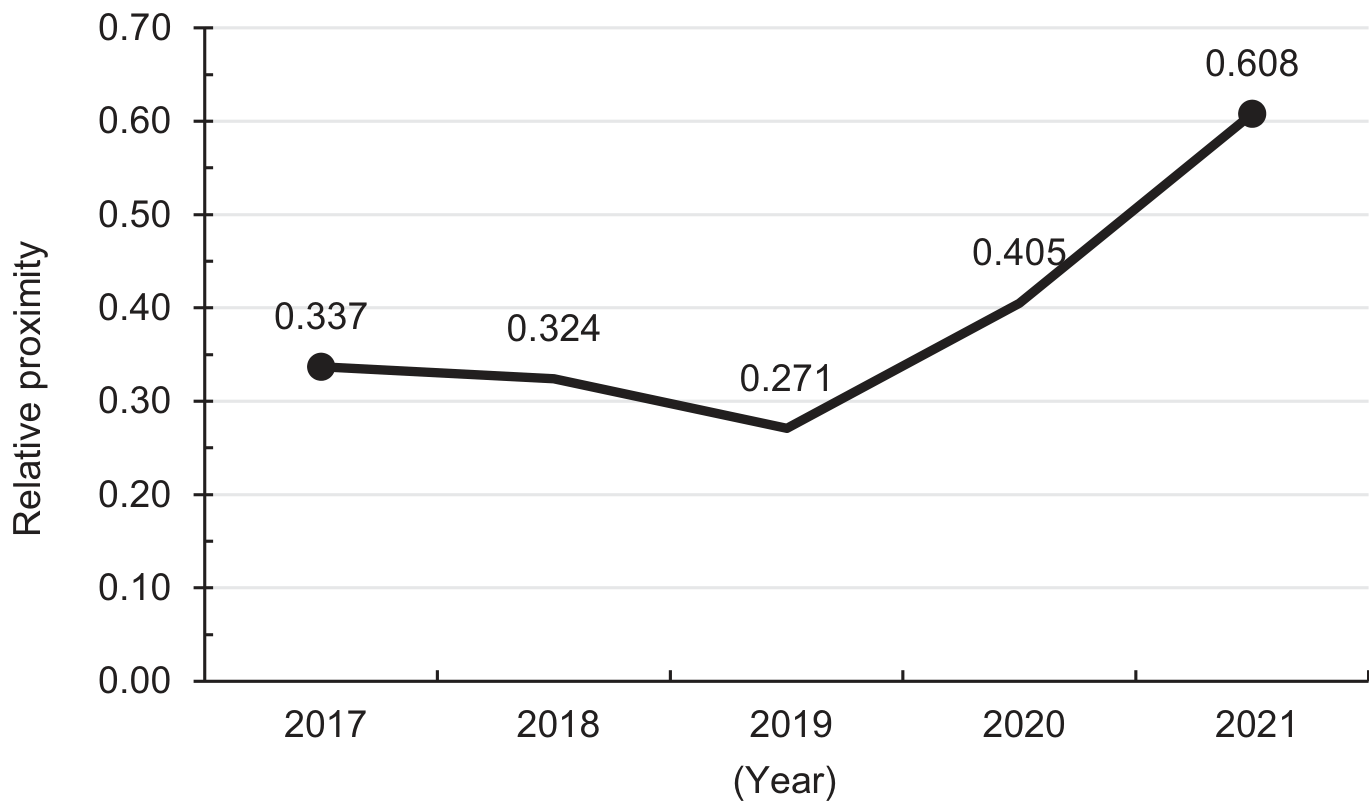
Fig. 1 shows that the total ecological livability level in the Huizhou region is increasing between 2017 and 2021. Specifically (Table 3), there is a slow downward trend between 2017–2019, with the composite score decreasing from 0.337 to 0.271. This indicates that the government did not pay enough attention to the ecology, resources, human habitat, and pollution control in the region before 2019. In the 2019–2020 interval, there is a continuous upward trend, and the rate of increase is more rapid. The comprehensive score of the regional ecological level rises from 0.271 to 0.608, breaking through the 0.6 level line, indicating that the government attaches great importance to urban construction and optimizes the urban environment during this period, which pushes the level of ecological livability in the Huizhou region to improve rapidly. The overall score of the Huizhou area increased from 0.337 to 0.608 in five years, which on the one hand indicates that the Agreement on Horizontal Ecological Compensation for Upstream and Downstream of the Xin’an River Basin signed by Anhui and Zhejiang Provinces has had obvious effects during the period of the agreement, and measures such as engineering, economy, science, and technology were taken to accelerate the formation of a green mode of life and manner of production in the region. The government achieves sustainable development by supporting the overall economic and social harmonization as well as ecological and environmental protection of the watershed. Overall, the ecological livability of the Huizhou region has shown more obvious improvement.
(1) The ecological livability level of the Huizhou region in 2017–2019 shows a small decrease. Concerning indicator weights, the largest percentage is represented by the weight coefficients of C9 per capita daily domestic water use and C3 green space and plaza land, which are 0.1213 and 0.1203, respectively. The weighting coefficients for all other indicators range from 0.03 to 0.09. Moreover, the C3 green space and plaza land and C9 per capita daily domestic water consumption rose by 0.38 square kilometers and 1.45 liters, respectively, resulting in a slight increase in ecological livability. However, two negative indicators, C4 Population Density and C15 Total Wastewater Discharge, have both risen: C4 Population Density has increased by 49.1 people/km2 from 1911.98 people/km2 to 1961.08 people/km2, and C15 Total Wastewater Discharge has increased by 248,000 tons from 6,037,000 tons to 6,283,000 tons, which results in the decline of eco-livability level. As well as positive indicators, C11 greening coverage of built-up areas fell by 0.4%. The C12 afforestation area in the current year fell by 704 hectares. C13 In the water, environment, and utilities management industry, the growth rate of fixed asset investments decreased by 78.9%. C14 expenditures on agriculture, forestry, and water as a percentage of local budget expenditures and growth in investment in fixed assets in the public facilities management sector fell by 23.78%. The C16 industrial solid waste comprehensive utilization rate fell by 2%. C17 Total industrial wastewater treatment fell by 128,000 tons, and C18 sewage treatment rate fell by 16.5%. Although the indicators with large weighting coefficients have increased, most of the remaining indicators have produced negative impacts on the level of ecological livability, and the impacts are large. This is due to Huangshan City strongly encouraging the construction of “urbanized” cities in 2019. A total of 4.667 hectares of cropland and forested land in the expropriated agricultural land is used for urban construction, which has an adverse impact on the ecological environment.
(2) The ecological livability level of the Huizhou region shows a significant increase from 2019 to 2021. The two indicators with the largest weights, C3 (green space and square land) and C9 (per capita daily domestic water consumption), rose by 4.25 square kilometers and 202.95 liters, respectively, resulting in an increase in ecological livability. Although two negative indicators, C4 (population density) and C15 (total wastewater discharge), have increased, C4 has increased by 20.28 people/km2 and C15 has increased by 489,500 tons, resulting in a decrease in the level of eco-livability. However, positive indicators C1 (per capita park green space area) rose 0.41 square meters, C2 (per capita housing floor space) rose 2.23 square meters, C5 (total water resources) rose 100 million cubic meters, C12 (afforestation area in the year) rose 46 hectares, C13 (water conservancy, environment, and public utilities management industry fixed asset investment growth) rose 91.7%, C14 (agriculture, forestry, and water expenditures accounted for the local budget expenditures) rose 24.4%, C16 (The industrial solid waste comprehensive utilization rate) increased by 34.75%, C17 (total industrial wastewater treatment) rose by 506,100 tons, and C18 (sewage treatment rate) rose by 28.5%. Indicators with large weighting coefficients as well as most of the rest of the indicators have risen, and those with large weighting coefficients have risen significantly, with a greater positive impact on eco-livability in general. Overall, the beneficial effect outweighs the negative effect. The reason for this is that the city of Huangshan established the Huangshan Ecological Environment Bureau in late 2018, which has been monitoring and gating the city’s ecological environment monitoring and environmental protection prevention and control work in 2019 and beyond. Positive outcomes have been achieved in the prevention and management of water pollution and the remediation of ecological and environmental problems. It also places a high value on the construction of the Xin’an River ecological compensation mechanism and actively promotes the construction of the Xin’an River – Qiandao Lake Ecological Compensation Pilot Zone. The construction of the Xin’an River Eco-Economic Demonstration Zone has involved a series of measures, such as promoting the upgrading and expansion of the ecological compensation pilot, actively exploring the price of ecological products, continuously promoting the construction of the “intelligent environmental protection” system, and deepening the joint protection and governance of the watershed, which has continuously improved the quality of the ecological environment and constructed a new mode of sustainable and green development for the city. In 2020, the Provincial Bureau of Statistics conducted a survey on the province’s public eco-environmental satisfaction; the public eco-environmental satisfaction of Huangshan City is 96%, and the public eco-environmental satisfaction in 2021 is 98.83%.
Characteristics of Temporal Evolution
The relative proximity of the ecological livability of the districts and counties in the Huangshan City region from 2017–2021 is calculated based on the indicators (Table 4), and the level change curve is plotted (Fig. 2). In terms of time evolution, the livability levels of different districts and counties change to different degrees in the time dimension. The ranking of eco-livability levels of the counties in Huangshan City in the Huizhou region is stable, and the gap in eco-livability between districts and counties has a tendency to narrow. Some districts and counties, such as Tunxi District, Huizhou District, Xiuning County, Huangshan District, Qimen County, and Yi County, showed a general upward trend during these five years, while She County showed a fluctuating decline.
Table 4.
Relative proximity of eco-livability levels by county in the Huizhou region, 2017–2021
Fig. 3.
Trend of eco-livability level of Huangshan City districts and counties in the Huizhou region, 2017–2021
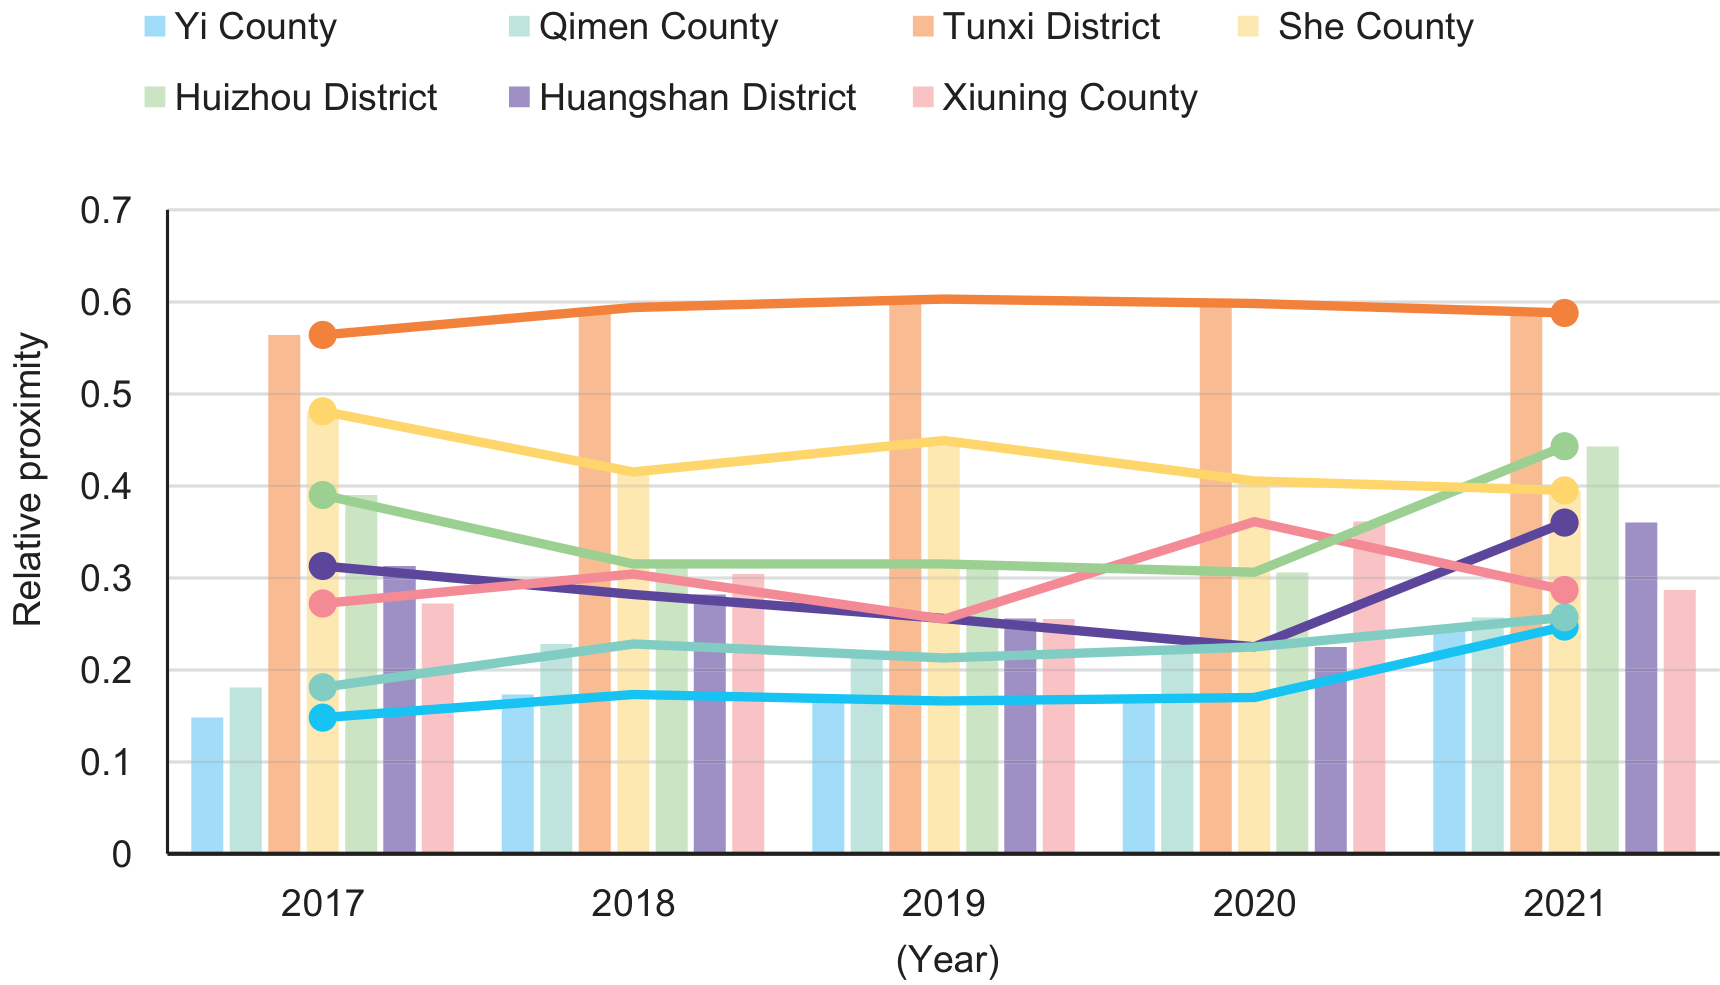
(1) At the district and county level, the ecological livability level of Tunxi District has always been in the 1st place in the ranking, with a slow upward trend. This is inextricably linked to the government’s emphasis on residents’ habitat and local ecological maintenance. According to statistics, since 2017, Tuenxi District has been ahead of other districts and counties in terms of per capita park green space area, green space and plaza land, and green coverage rate of built-up areas. Its per capita park green space area of 19.96 square meters in 2021 is 8.95 square meters higher than the per capita park green space area of Huizhou District, which is ranked 2nd, and roughly 6 times higher than the lowest per capita park green space area of Shexian County. In addition to agriculture, forestry, and water expenditures accounted for local budget expenditures overall higher than other districts and counties, and unit GDP energy consumption has been ranked at the end. Description of the district infrastructure development is more complete, built-up areas with high green coverage. For the water environment, ecological compensation work is effective, prompting the Xin’an River Basin water environment to continue to improve to achieve the purpose of watershed protection and long-term management. 2020 Tunxi District Ecological Environment Sub-bureau was established to promote ecological environmental protection work, win the battle against pollution prevention and control, and strengthen the central city’s primacy to offer a new and greater contribution. In addition, the ecological environment sub-bureau actively carries out activities for residents of ecological environmental protection, investigation of pollution in major industrial parks, and standardized treatment of hazardous waste. Tunxi District Housing, Water Resources, and Forestry Bureau and other departments attach great importance to ecological environment issues, actively respond to the requirements of the “Huangshan City Construction of Ecological Civilization Demonstration Area Implementation Opinions”, encourage the creation of a demonstration region for ecological civilization, pay attention to ecological environment regulation, and strengthen pollution prevention and control and energy saving and reduction of color community creation activities. Environmental education for students and residents is also conducted through various channels. In the process of accelerating the construction of an international tourist city, we vigorously promote pollution plus emission reduction, strengthen environmental supervision, and comprehensively promote pollution prevention and control. Resulting in the region’s ecological livability level has maintained the first-place ranking.
(2) Shexian County, as the second largest district in terms of area and the first in terms of GDP in the Huangshan City region, has a wealth of natural tourist attractions and local culture and has been selected as a national health township for the 2017–2019 cycle. As can be seen from the Fig. 3, the ecological livability level of Shexian County has been ranked 2nd but lags behind third ine 2021, and the overall level is on a downward trend. The total water resources and water supply of Shexian County are ranked high, which is related to the Xin’an River passing through the county. According to the statistics, Shexian County has been ranked at the end of the list for green space per capita, with green space and plaza land at 0.57 square kilometers until 2021, when it rises to 1.5 square kilometers. Energy consumption per unit of GDP during the five years has been ranked first, and the sewage treatment rate has not seen any significant improvement, which shows that Shexian County’s performance in energy saving and consumption reduction is average, and the energy utilization efficiency, as well as environmental pollution control, lacks attention. Resulting in a decline in the level of ecological livability.
(3) The ecological livability level of Huizhou District and Huangshan District is in the state of decreasing year by year, while a turnaround and sudden rise occur in 2021. Huizhou District jumped from a poor level to a medium level, surpassing Shexian County’s eco-livability level in 2021 from the 4th place in 2020 to the 2nd place. Statistically, Huizhou District improved in pollution management in 2021, with the comprehensive utilization rate of industrial solid waste and industrial wastewater treatment rate rising from previous years. Regional pollution control has been effective in promoting a better ecological environment and improving the quality of life of residents, which is inseparable from the government’s strengthening of the daily supervision of industrial enterprises. Huizhou District Ecological Environment Sub-bureau in 2021 took the ecological compensation mechanism as a working opportunity to promote the implementation of a series of water environmental protection works, such as industrial sewage treatment in the jurisdiction, rural sewage collection and treatment, and urban renovation of an old pipeline network, so as to further promote the water environmental protection work in the jurisdiction, strengthen the people’s governments of townships and townships’ awareness of their responsibility for the quality of the water environment in the jurisdiction, and improve the level of regional ecological livability.
(4) The ecological livability level of Huangshan District rose from 5th to 4th in 2021. According to the statistics, the per capita green park area and green and square land in Huangshan District rise in 2021, and according to the weight of the indicators in that year, the indicator with the highest weight coefficient is the sewage treatment rate, which rises from 96% to 100% in 2021, and both the wastewater treatment rate and sewage treatment rate are significantly improved. It can be seen that the project of upgrading and improving the sewage treatment system of villages in Sankou Township of Huangshan District, which was supported by the central funds in 2021, has gained obvious benefits, and the rest of the sewage treatment projects have achieved better results. Therefore, the ecological livability level of the region has an upward trend.
(5) In Qimen and Yixian County, the level of ecological livability increased year by year, constantly narrowing the gap with other districts and counties, but still lagging behind other districts and counties in the level of ecological livability and lower level. County rural environmental quality off, in strict accordance with the time point and work requirements to organize and carry out good environmental quality monitoring work, to ensure the completion of the 2020 county rural environmental quality monitoring tasks on schedule, to further improve the rural living environment, and vigorously enhance the sense of well-being of people’s lives, the sense of access.
Characteristics of Spatial Evolution
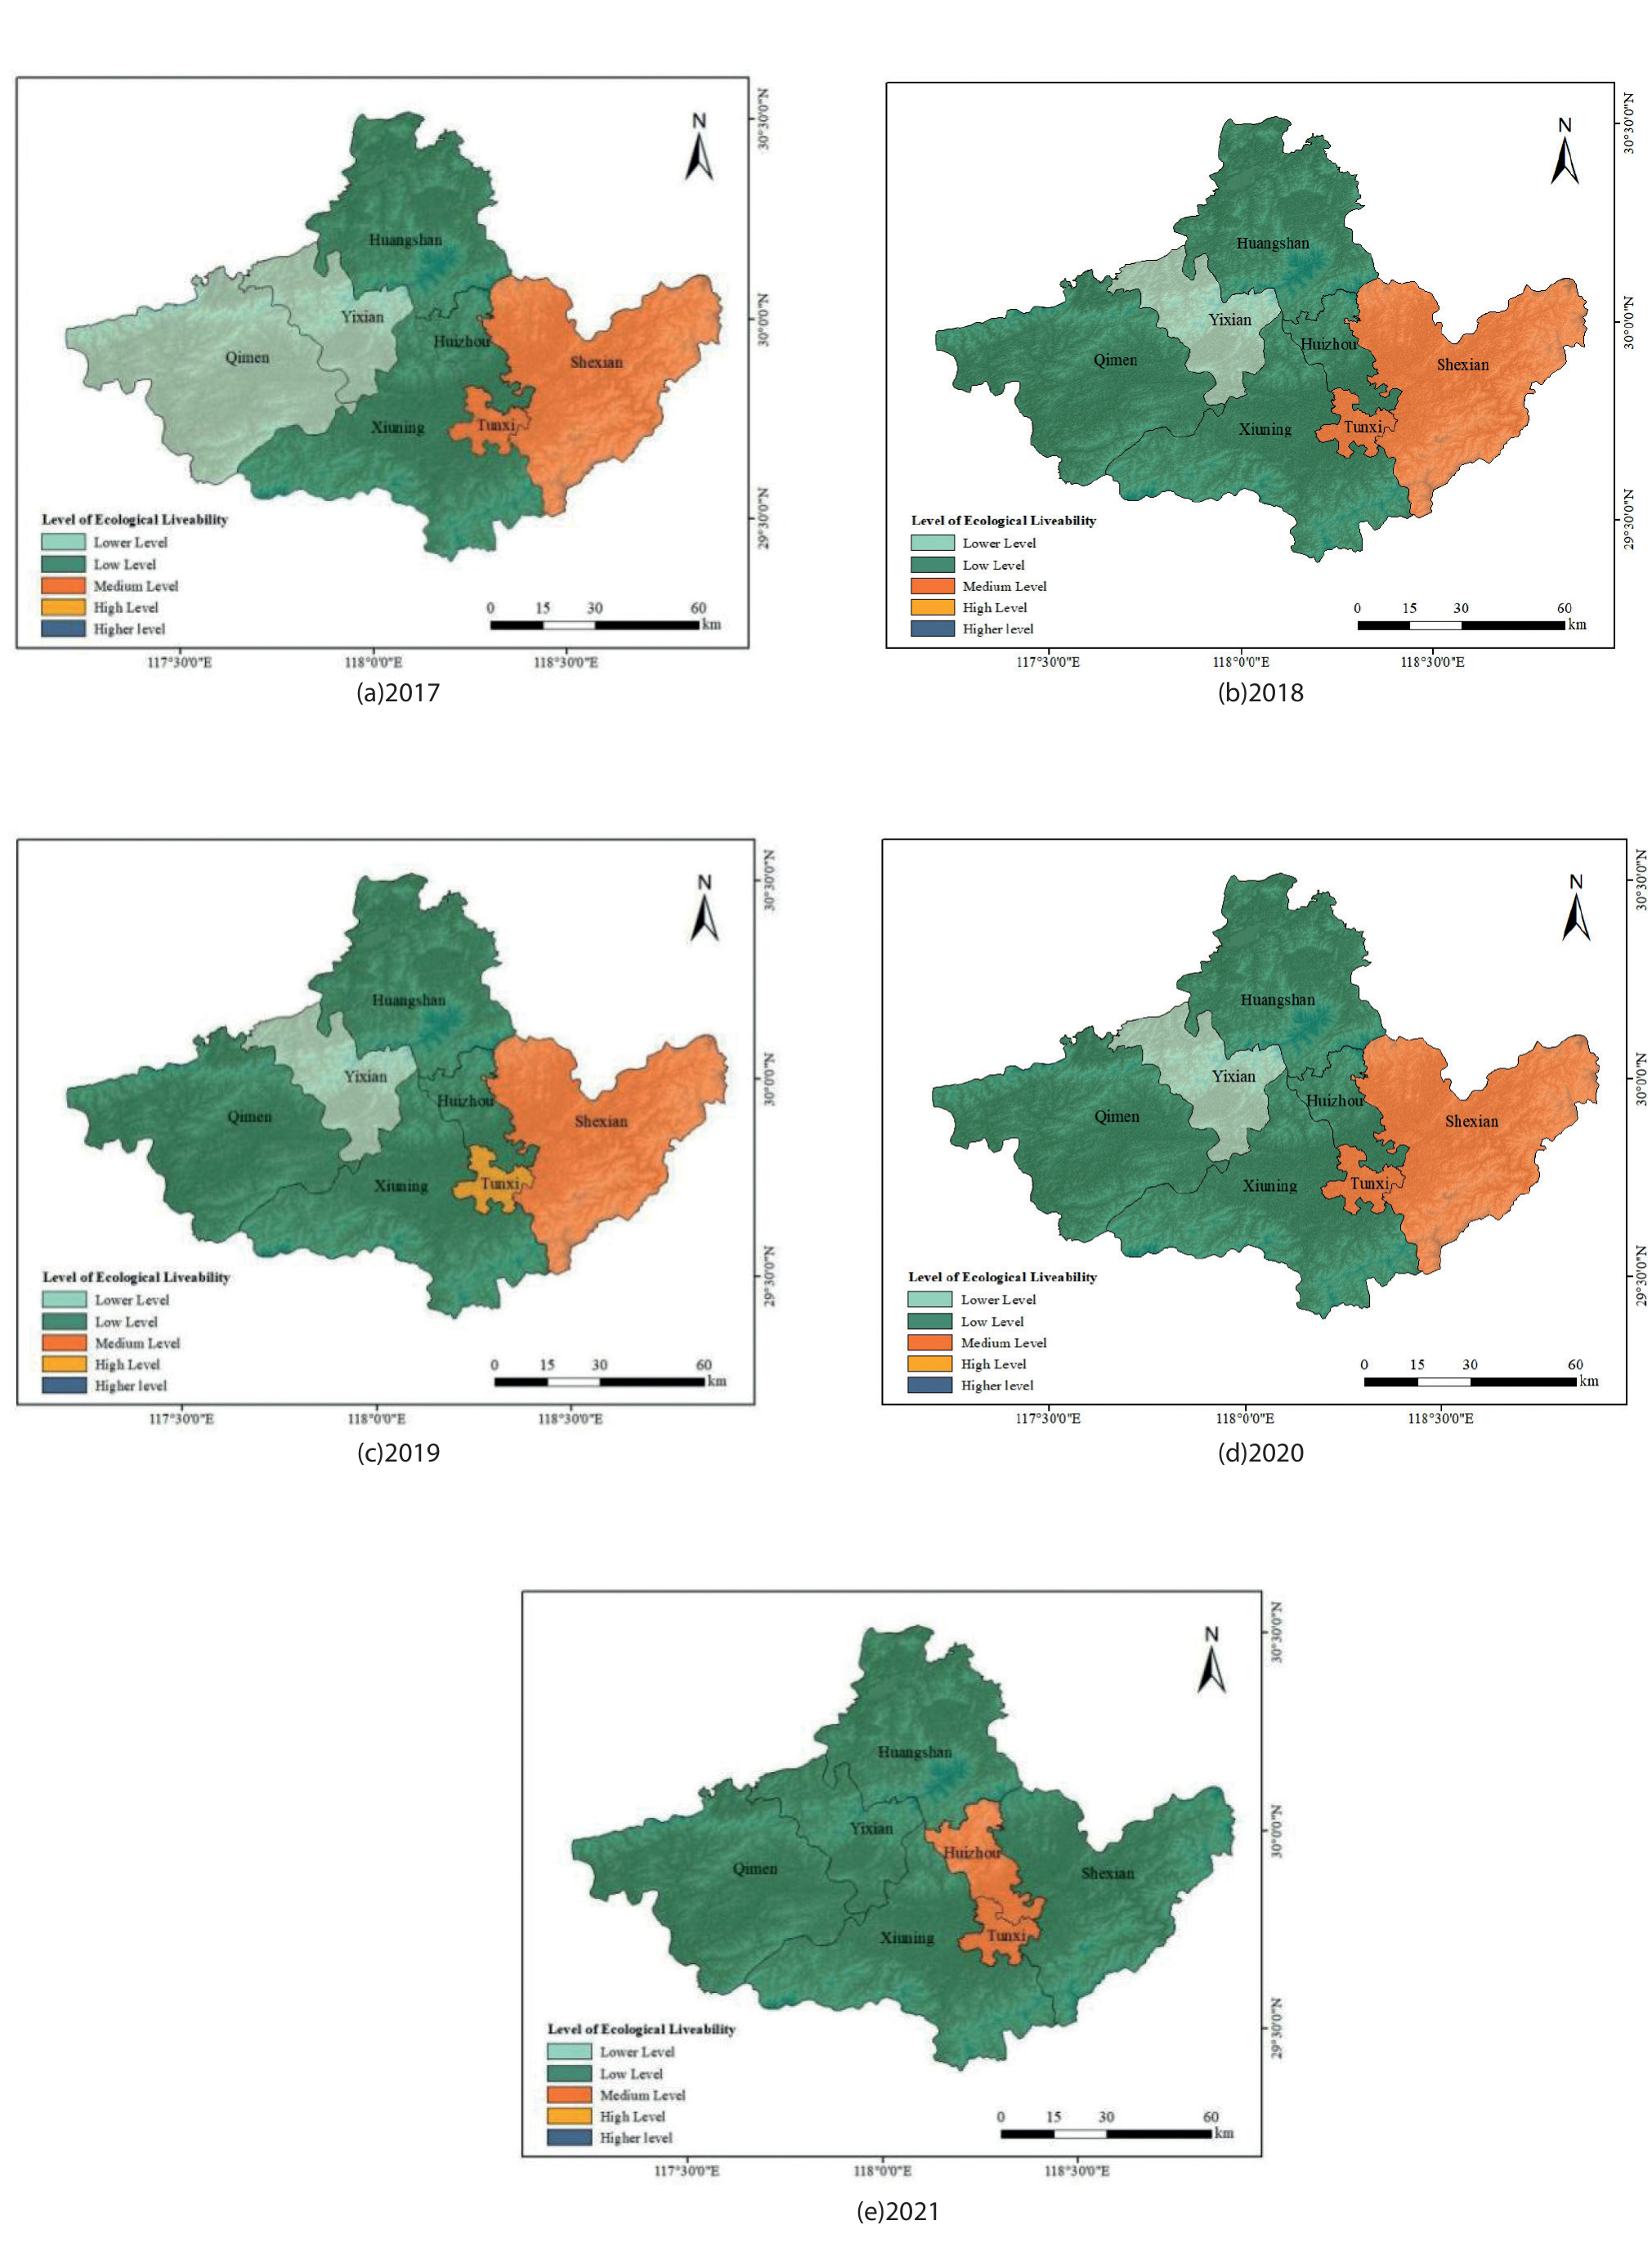
The ecological livability of the Huizhou region was evaluated using the entropy weight TOPSIS approach, and ArcGIS10.8 software was used to visualize its spatial data, to draw the evaluation map of the ecological livability level of the Huizhou region in 2017–2021, and to compare and analyze its spatio-temporal evolution pattern, which is shown in Fig. 4.
On the whole, the ecological livability level of the Huizhou region is not high, and the difference in the ecological livability level in the districts and counties is not obvious. From the Figure, it can be found that the ecological livability of the urban area of the Huizhou region is better, and the ecological level is higher than that of the neighboring districts and counties as a whole. For example, Tunxi District has been in the lead, reaching an average level in 2019, after which it resumed the initial trend. The spatial distribution shows a pattern of “high in the core and low around it”. However, the farther away from the urban area, the relatively lower the ecological livability level, such as in Qimen County and Yixian County. This is because districts and counties far away from urban areas receive less radiation from the central city, resulting in lower livability. However, being far away from urban areas, these areas are also subject to fewer environmental problems, such as pollution, resulting in a relatively better ecological level, but still not as good as urban areas overall. According to the statistics, Yixian County’s indices in terms of habitat, resource utilization, ecological maintenance, and pollution control showed positive trends over the five-year period. Over the five years, only Tunxi District reached a high level in 2019, and the rest fluctuated up and down to different degrees in the very poor level, poor level, and general level, and the whole city of Huangshan realized zero “very poor level” in 2021.
Fig. 4.
Evolutionary distribution of spatial patterns of ecological livability in counties of the Huizhou region, 2017–2021
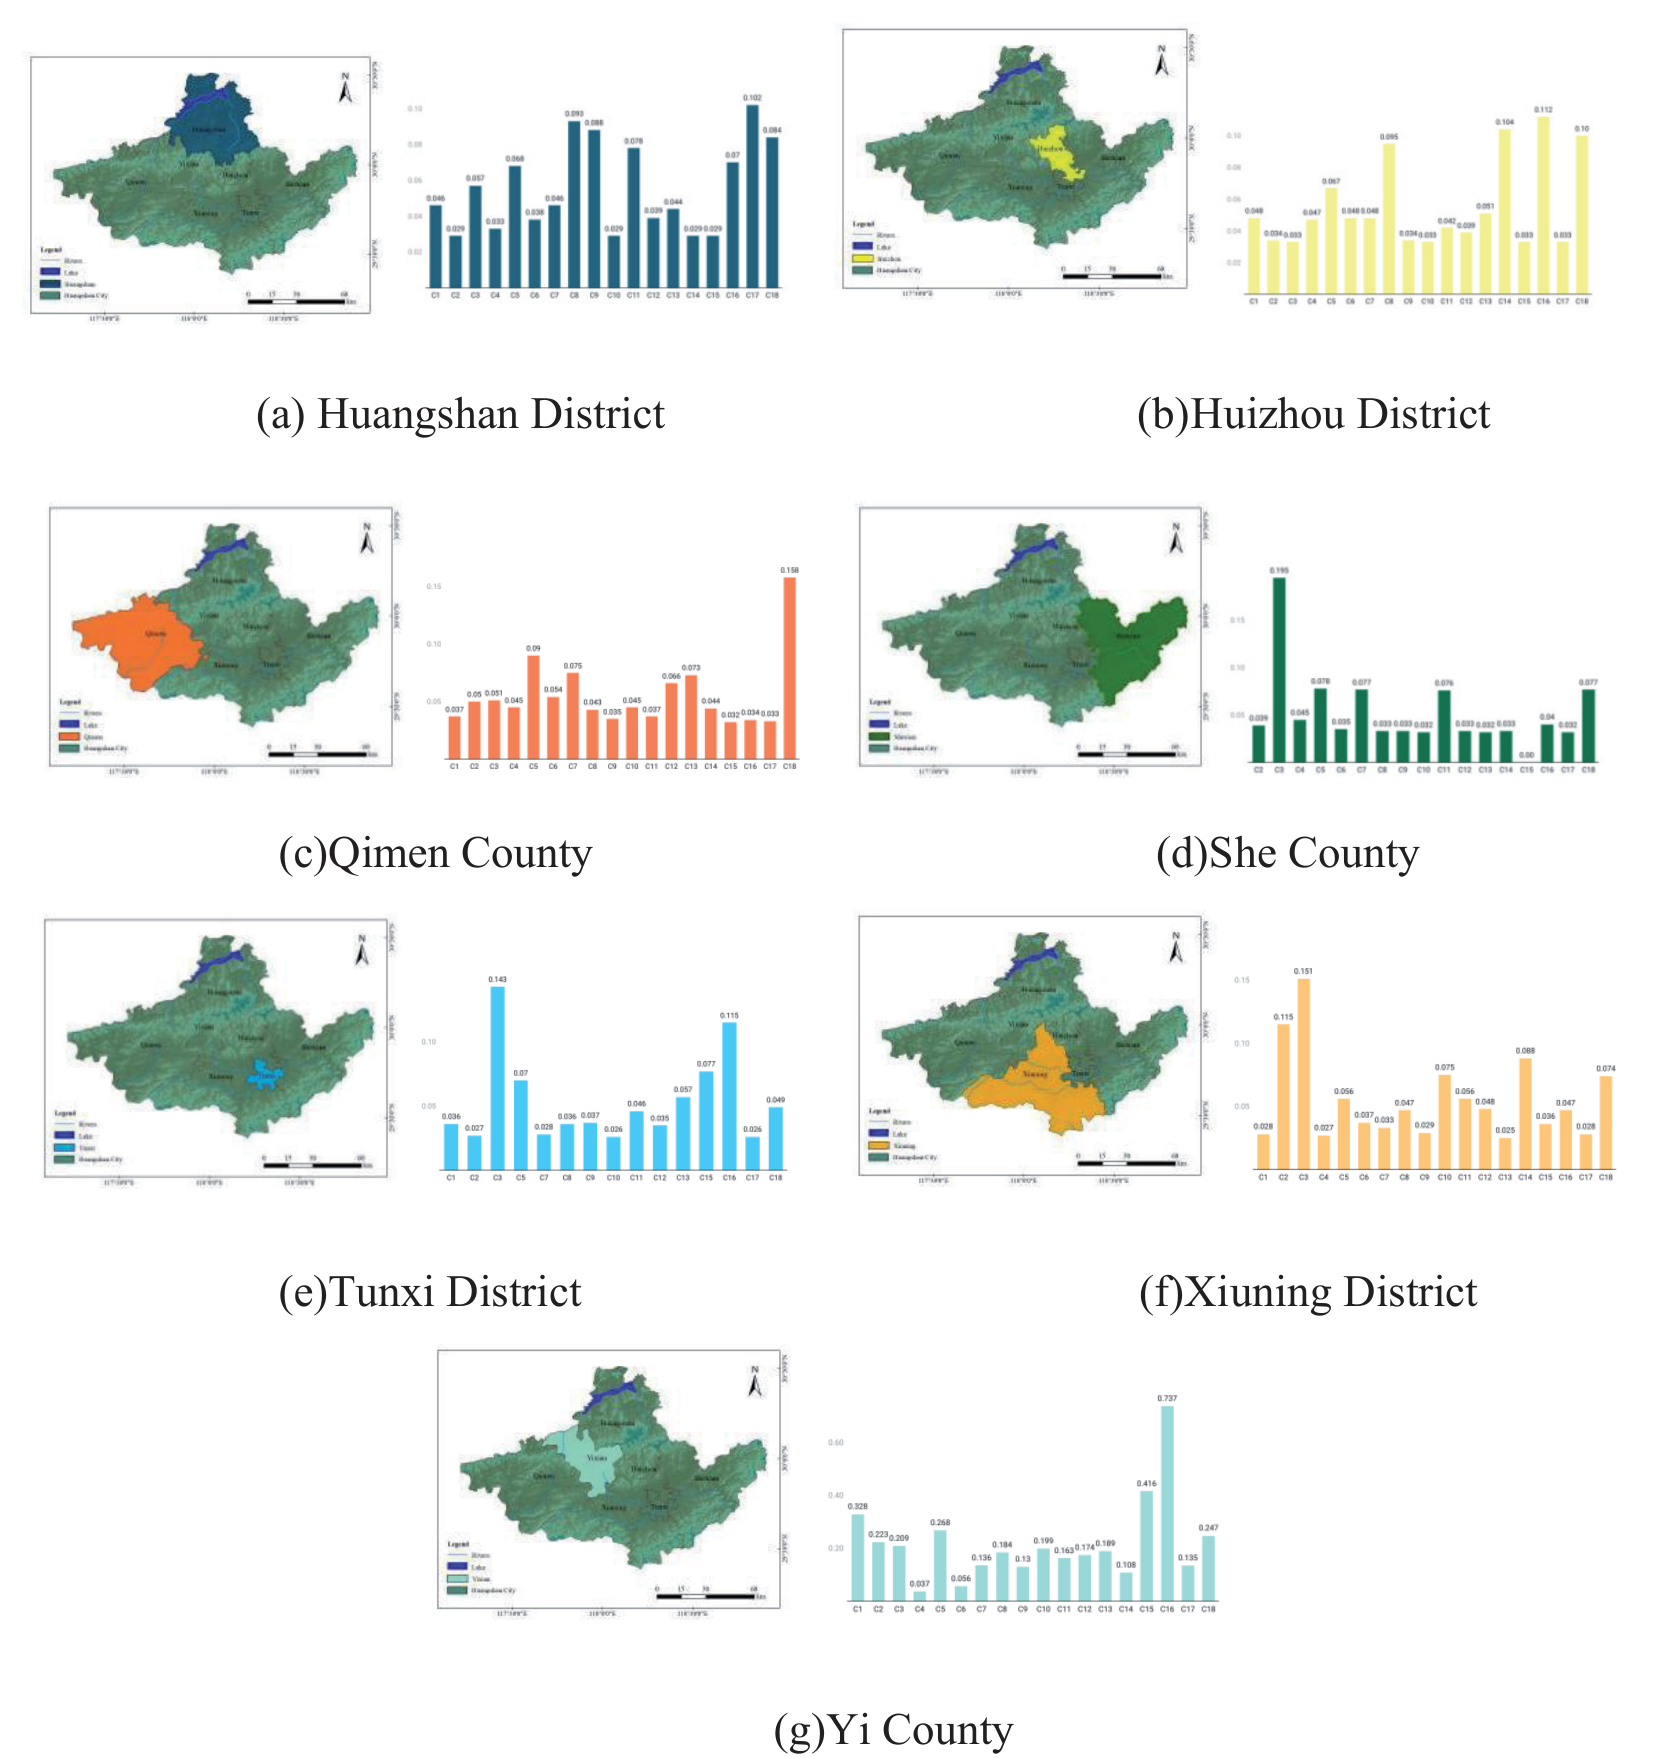
The ranking of the weights calculated based on the entropy of the indicators for each region for 5 years shows that (Fig. 5). The indicator with the highest weight in Huangshan District is the sewage treatment rate, which belongs to the pollution control level; the indicator with the highest weight in Huizhou District is the total amount of industrial wastewater treatment, which belongs to the pollution control level; and the indicator with the highest weight in Qimen County is the annual precipitation, which belongs to the human habitat level; the highest weighted indicator in Tunxi District is green space and plaza land, which belongs to the level of human habitat; the highest weighted indicator in Xiuning District is green space and plaza land, which belongs to the level of human habitat; the highest weighted indicator in Yi County is the sewage treatment rate, which belongs to the level of pollution control. From this, it can be concluded that the two major directions with the greatest effects on ecological livability are pollution control and habitat.
Discussions
Importance of Eco-Livability Assessment
In the development of rapid and large-scale urbanization, resource consumption will also increase, and these will drive a number of climate and environmental change issues, such as global warming. [51] Therefore, in order to improve the ecological quality and life satisfaction of individuals in their settlement environments, an assessment of urban eco-livability and the factors influencing it is necessary [52]. Ecological livability assessment is to quantitatively evaluate the current status of ecological environment livability in the study area by obtaining information on the spatial distribution of anthropogenic and natural factors in the ecological environment, such as water resources, land resources, resource utilization, and pollution emissions.
There are regional differences in ecological livability, which are related to the economic strength of the region and the stage of urbanization. In regions with stronger economic power, the human role in the human environment and pollution control will contribute to ecological livability. However, too rapid urbanization will inevitably lead to ecological degradation, causing environmental pollution and surface cover destruction, bringing natural disasters, and other natural disasters will in turn constrain economic development [53]. For this reason, the ecological livability of a region needs to consider whether the local economic activities match the carrying capacity of the regional natural ecological environment [54].
Through the evaluation of ecological livability, the current status of regional ecological livability can be understood and the development trend of regional ecological environment can be predicted. It gives reference for the local government to formulate scientific and efficient measures to optimize the ecological environment.
Status of the Huizhou Region
Based on the above analysis, the overall ecological livability of the Huizhou region is increasing, and the trend of change varies from region to region. In this regard, this study puts forward the following points for different regions:
1. The gross regional product and population of Tunxi District have been higher than other regions. Economic development and the government’s emphasis on local ecological maintenance are the reasons for the high level of ecological livability in this region. However, its overall level has not increased significantly during the 5-year period, indicating that Tunxi District should build on its original foundation and then strengthen its comprehensive management of the ecological environment.
2. The ecological livability of Shexian County coincides with its lack of energy conservation and environmental pollution control. Despite the rich natural resources and cultural and tourist attractions, the lack of effective ecological governance measures will lead to a decline in ecological livability.
3. The significant increase in ecological livability in Huizhou District and Huangshan District reflects the positive impact of pollution control and industrial waste treatment on ecological livability. It shows that the ecological livability of the region can be significantly improved by effective pollution control and environmental regulation and timely measures made to cope with the problems.
4. The ecological livability of Qimen and Yixian County increases year by year, but still lags behind other districts and counties. This indicates that environmental governance and infrastructure construction in rural areas are relatively lagging behind, which will affect their ecological livability. A poorer ecological environment will inversely constrain economic development, and in order to prevent falling into a vicious circle, the Huangshan municipal government should strengthen policy assistance for maintaining the ecological environment in rural areas.
5. The spatial clustering of eco-livability in Huangshan City indicates that it is necessary to strengthen cooperation between districts and counties in urban development and that the top-ranked cities should lead the bottom-ranked cities to improve their economic development and eco-environmental upgrading, so as to improve the overall eco-livability of the Huizhou region.
Conclusions
In this study, the seven districts and counties of Huangshan City in the Huizhou region were taken as the study scope, and 18 indicators were selected from five aspects, namely, human habitat, resource utilization, ecological maintenance, pollution treatment, and climatic environment, to construct an evaluation system of ecological livability. The ecological livability of the counties and districts of Huangshan City, which is part of the Huizhou region, was assessed using the entropy weight-TOPSIS approach. For a thorough assessment, ArcGIS was also utilized to examine the spatial and temporal evolution patterns of Huangshan City’s counties and districts from 2017 to 2021, and the following conclusions were drawn:
1. Through the TOPSIS assessment, it is concluded that the overall level of urban eco-livability in Huangshan City, Huizhou District, is poor (0.2 ≤ C < 0.4) and slowly decreasing before 2020, and then shows a rapid increase and rises to an average level of (0.4 ≤ C < 0.6) after 2020. Specifically for the eco-livability level of each district and county, Tunxi and Huizhou districts reach the average level of eco-livability score (0.4 ≤ C < 0.6) in 2021, and Shexian, Xiuning, Qimen, Yixian, and Huangshan districts reach the poor level (0.2 ≤ C < 0.4). The results can be obtained; the overall ecological environment of Huangshan City has reached the general level and has a tendency to continue to climb, but is still far from the good or ideal level. Consequently, the goal of Huangshan City departments is to establish a sound long-term management mechanism while also actively addressing ecological environment problems in order
to maintain the quality of the ecological environment and carry out the previous effective management methods and ecological protection measures. In addition, it is also necessary to add blocks for social and economic development and green transformation to realize enterprise pollution reduction, carbon reduction, and green development. Continue to build the Xin’anjiang River – Qiandao Lake Ecological Protection Compensation Pilot Zone at a high standard to realize the value of national ecological products. At the same time, to enhance the level of ecological environment supervision to achieve intelligent, scientific, and refined. To guarantee the sustained growth of urban areas, promote the livability of cities, and improve the urban environment, it is necessary to follow the concept that “green hills are mountains of gold and silver” and bolster the development of ecological civilization [55].
2. Using ArcGIS to analyze the spatial pattern, it is concluded that the ecological livability level of the Huizhou area is formed in the space with the urban area as the core of the spatial pattern of “high in the middle and low in the surroundings”, presenting the trend of radiation diffusion around the central city. Currently, the main contradiction is the unbalanced development and large development gap between regions. In the future, we can divide up regions based on the kind of living environments that different populations require and address the associated shortcomings in different counties and districts to encourage the cooperative development of multiple areas. On the one hand, for central urban areas with high ecological livability, priority must be given to their central city demonstration role to stimulate and drive the development of surrounding areas. Tunxi District is the center of Huangshan City and is the confluence of the Hengjiang River, Lv River, and Xin’anjiang River, but also the junction of Anhui, Zhejiang, and Gan provinces. It is a better area for socio-economic and social development in Huangshan City, which should firmly grasp the location advantage and include the idea of ecological civilization in the development of cities. Secondly, the intensity of resource development should be reduced, and the planning and layout should be adjusted according to the current development status to realize the sustainable use and protection of resources. On the other hand, cities with low ecological livability should pay attention to both the human environment and pollution control.
3. The entropy weighting method analyzes that among the evaluation indexes of ecological livability level in Huangshan City of Huizhou region, C9 per capita daily water consumption index has the largest weighting of 0.1213, C3 green space and plaza land has the second largest weighting of 0.1203, C6 annual precipitation weighting is the third largest weighting of 0.0858, and C12 afforestation area of the same year weighting is the fourth largest weighting of 0.0814, which indicates that the human habitat environment and pollution control are two important levels in influencing the quality of ecological livability of residents of Huizhou region. The two dimensions occupy an important position in influencing the ecological livability quality of Huizhou residents. First of all, urbanization pollution governance needs to be carried out according to local conditions and realistically. Strengthening the treatment of rural sewage, reducing emissions from factories, strengthening pollution control, actively constructing an ecological civilization, and promoting cross-regional ecological environment joint prevention and treatment. Secondly, green space and plaza land use and green space coverage play an important role in improving ecological livability. Therefore, increasing urban green space coverage and carrying out urban greening programs including activities such as building parks, planting trees, and greening communities can help improve ecological livability. This also helps to improve urban air quality and promote healthy ecosystems.
4. Limitations There are a few other limitations to this study. The first is reflected in the still insufficient scope of the selected samples, as well as the small time span. In the future, the scale of the study can be expanded from the region within Huangshan City to the urban agglomerations in Anhui Province in order to establish a framework of indicators for evaluating the ecological livability of urban agglomerations, which can facilitate the increase of the breadth and depth of the study. On this basis, the time span can be further expanded and more comprehensive data can be collected to assess the trend of ecological livability in the study area and to provide a more reliable and comprehensive basis for achieving the goal of ecological revitalization in urban and rural development. Second, this study has limitations in constructing indicators. Due to the limitations of objective data acquisition, such as missing data, indicators that do have high values are deleted, which may lead to a less-than-comprehensive selection of indicators for certain indicator layers. An ecosystem system is a typical social-ecological system containing a sophisticated subsystem, such as the natural environment, infrastructure, and human communities, including both physical and socio-cultural environments [56]. Future research can collect data related to each indicator layer from multiple sources and adjust the correspondence between each indicator layer and indicator. Comprehensive measures will be proposed in an integrated manner to create a more comfortable and sustainable living environment for residents.
Acknowledgments This research was supported by the “Digital Intelligence Rural Culture and Tourism Research and Innovation Team” (Project No. 2022AH010022), the China Postdoctoral Science Fund (Project No. 2023M730017), and Research Project on Social Science Innovation and Development in Anhui Province (Project No. 2023CX137).

