

Introduction
Heavy metals are important environmental pollutants that have become considerable global hotspots, especially in coastal environments [1-8]. These pollutants can be transported in the form of xiezhenglei@njnu.edu.cn dissolved elements and are then discharged into offshore marine sediments [9-12]. Therefore, the determination of the concentration levels of heavy metals in water and sediments are usually addressed to provide crucial information for environmental risk evaluations. Such methods have become common practice when evaluating of the impact extent of human input [11, 13].
An increasing number of research studies have investigated ecological risk assessments of heavy metals in sediments [14-17]. For example, previous studies have clarified the transportation of heavy metal pollutants in sediments from a surrounding estuarine to a marine coastal zone in China’s Jiaozhou Bay [18]. Gu et al. (2015) investigated the total concentrations of heavy metals in the surface sediments and nekton of Qinzhou Bay in China’s Beibu Gulf [19]. Several common risk assessment indices have been applied to assess the environmental risks of heavy metals and identify the sources of such metals, such as principal component and Pearson’s correlation analysis methods [13, 20]. In addition, assessment indices are widely used to evaluate metal pollution levels in sediments, including geoaccumulation, enrichment factors, and potential ecological risk indexes [13, 21]. Sediment quality guidelines (SQGs) have been developed to analyze potential contamination status, which has assisted in a better understanding of the implications of heavy metal accumulation [17, 22]. The Marine Sediment Quality of China (GB 18668-2002) consists of a TEL (threshold effects level) and a PEL (probable effects level) and was applied to express marine sediment contamination status [13]. Accurate spatial evaluations and visualizations of pollutants are crucial in order to identify risk sources, and have been widely used to determine the spatial distributions of heavy metals [23-24].
Haizhou Bay is located on the coastline of the Yellow Sea northeast of Lianyungang City, an industrial port city in the northern section of Jiangsu Province in eastern China [25]. It is a typical Chinese coastal area characterized with vulnerable coastal ecosystems that have been experiencing intensive anthropogenic activities [8]. The majority of the related previous studies have focused on the quantification and characterization of heavy metals in the sediments in Haizhou Bay [26]. The heavy metal concentration levels in the groundwater of the coastal areas in Jiangsu Province are closely related to natural hydrogeochemical processes and anthropogenic activities [24]. However, published research findings describing the distribution patterns, concentration levels, pollution sources, and potential risks of heavy metal pollution in the coastal water and sediments in the Haizhou Bay region remain limited. Therefore, the main objectives of this research were as follows: (1) Conduct and investigate of the concentration levels, spatial distribution patterns, and variation characteristics of the heavy metals in the coastal water and sediments of China’s Haizhou Bay; (2) Complete an assessment of the potential risks of heavy metal potential pollution; identify potential sources by applying a statistical approach; and then compare the contamination degrees with other coastal and marine ecosystems; (3) Finally, present comments for the future prevention and control of coastal and marine heavy metal pollution. This information is vital for decision-makers involved in coastal ecosystem management processes.
Material and Methods
Study Area
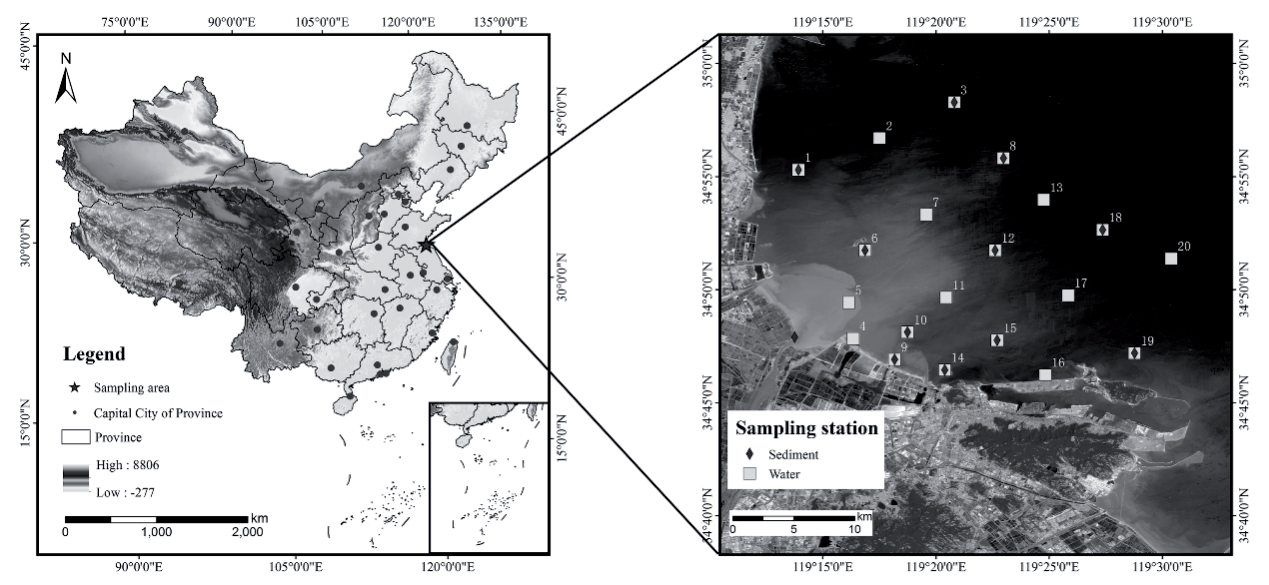
Haizhou Bay is located in the northeastern section of Jiangsu Province. It is an open bay and a semi-enclosed sea area belonging to the South Yellow Sea. Haizhou Bay has an area of 876.40 km2 and a coastline length of 86.81 km. Its coastline starts from Lanshantou, Rizhao, Shandong Province in the north (35°05′55”N, 119°21′53”E) and ends at Gaogong Island of the south of Lianyungang, Jiangsu Province (34°45′25”N, 119°21′53”E). The study area and sampling sites are shown in Fig. 1. The landforms of the coastal region of Haizhou Bay mainly include plains, accompanied by hilled areas [8]. The coastal types from north to south are sandy coast, bedrock coast, and silty and muddy coast types, respectively. The sandy coastline located in the northern part of the study area has a length of 30 km. The bedrock coast area is 40 km long and the silty and muddy coast area measures 50 km in length. The geomorphological changes of the region inevitably trigger hydrodynamic changes. The coastline was formed during the period from 1128 to 1855, with the Yellow River entering the sea in the northern part of Jiangsu Province. At that time, the annual average sediment discharge was 1.2 billion ton and was deposited at the estuarine. Due to the combination of rich sand sources, river alluviation, and coastal tides, the banks rapidly expanded toward to the sea. When the Yellow River changed its course in 1855, it brought rapid changes in the sediment conditions and strong erosion actions took place. The main climate types are subtropical monsoon and temperate monsoon climates. The annual average temperature ranges from 13.5ºC to 16.1ºC. The lowest and highest temperatures of -23.4ºC and 41ºC are recorded in January and July, respectively. The annual precipitation in the study area ranges approximately between 800 and 1150 mm.
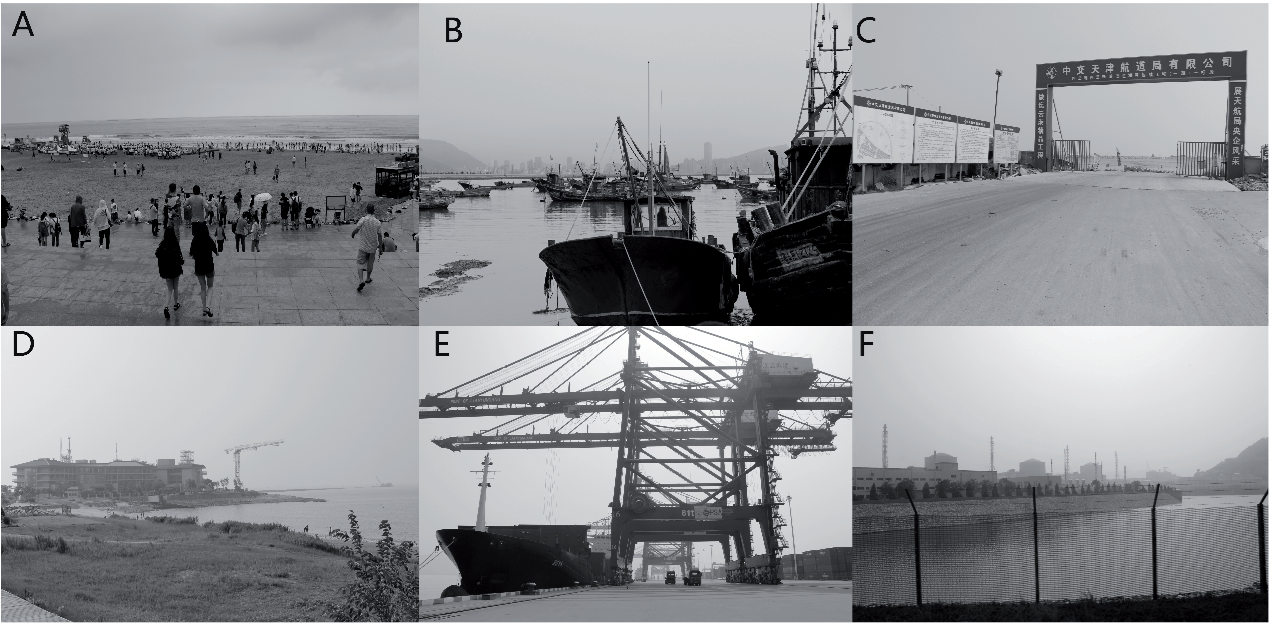
The water flow velocity in the southern portion of the Linhong River mouth is very slow. The rising tide flow direction is southwest and the ebb tide flow is in a northeastern direction. The tide is a regular semidiurnal tide, with the high tide velocity higher than the low tide velocity. Due to the variations in the sand sources, hydrodynamics, and bank formations, the geomorphological characteristics and deposition dynamics have obvious differences. The mean water depth of Haizhou Bay is between 10 and 20 m. It has been determined that the mean water depth has increased by 4.6 cm, and the water exchange capacity has decreased from 5.92 billion m3/a in 2006 to 5.56 billion m3/a in 2016. There are eighteen rivers with annual net flow amounts of 1.70 billion m3. The main pollution source has been identified as the pollutants brought into the bay by the rivers, accounting for 70% of the total pollutant amount. The chemical oxygen demand (COD) content within the bay has increased from 1.39 mg/L in 2006 to 1.63 mg/L in 2016. Changes in the hydrodynamics and sedimentation environments have occurred since the West Bank (Xidadi) Cross-sea Project was completed in 1993, with a length of 6,687.5 m. Phosphates, sulphates, and heavy metals are the most common pollutants found in the coastal water [27]. Haizhou Bay is not only a traditional aquaculture zone, but also plays a crucial role in port development and aquaculture industries, as well as being a popular tourism destination [28]. Haizhou Bay is one of the most important marine economic development districts and is the main carrier enforcing the bay-type economic and mariculture regions of Jiangsu Province. The construction of port-adjacent industrial parks has resulted in the continuous growth of energy development and biopharmaceutical activities. The population in Lianyungang City in 2022 was 4.60 million, including 2.90 million inhabitants residing in urban population settings. The terrestrial land area is 7,499.90 km2, with farmland areas accounting for 3,835.29 km2, garden areas totally 160.42 km2, and forested land composing approximately 210.78 km2. Moreover, maritime traffic and petroleum transportation activities have contributed to the increased occurrence of marine pollution. Huge amounts of industrial, agricultural, and aquaculture wastewater are transported into Haizhou Bay via the Linhong River, which has inevitably caused coastal pollution. The typical coastal landscapes of the region are illustrated in Fig. 2. The main anthropogenic activities include tourism, diversified fishing, coastal engineering, port construction, and energy infrastructures [29].
Sample Collection
Water Sample Collection
A total of forty water samples from Haizhou Bay were collected during the spring tide period (high and low tides) during May of 2016 (Fig. 1). Before collecting two bottles of water samples (0.5 m under the sea level and 0.5 m above the sea floor, 100 mL each) from each sampling station, the sampling bottles were thrice cleaned with water at the site. One of the water samples was directly sealed for later testing purposes, while the second water sample was filtered through a 0.45 µm filter membrane and treated with concentrated nitric acid (analytical grade) to achieve a pH<2. The samples were refrigerated at below 4ºC, and directly transferred to this study’s laboratory facility to analyze the concentration levels of heavy metals and other elements. When all of the samples were collected, the temperature, pH, and salinity values were recorded in situ at each station using a multiparameter kit (Multi 3400 i/SET; sensitivity (±1 digit).
Sediment Sampling Collection
At the same locations, twelve sediment samples were also collected at each seabed (triangle sampling method) from the upper sea floor layer using a box sediment grab sampler. The samples were stored in acid-rinsed polypropylene bags and then homogenized, air dried, sieved through 0.15 mm sieves, and retained for further analysis. A sampling interval of approximately 5 km was employed, and the sample densities were effectively increased toward the coastline.
Lab Analysis Process
Water Sample Treatments
The water quality variables included pH, Chro-a, dissolved oxygen (DO), sulfide, COD, NO2-N, NO3-N, NH3-N, petro, Cu, Zn, Pb, Cd, Cr, As, and Hg. The samples were stored at -20ºC and analyzed using a flow injection spectrophotometric method on a five-channel Bran-Luebbe Autoanalyzer 3 (Norderstedt, Germany). The determination of heavy metals required the analysis of 250 of mL filtered seawater (0.45 μm polycarbonate filters). The water samples were digested and concentrated eight times via slow heating on a hot plate at 90ºC with HNO3, and were pre-filtered through glass-fiber filters with pore sizes of 0.7 μm (Whatmann GF/F) [29]. After appropriate dilution was completed, the concentration levels of heavy metals in the water samples were assessed using an atomic absorption spectrometer graphite furnace. In this study, the test limits of Cu, Pb, Cd, Zn, and Cr were 0.2 μg/L, 0.03 μg/L, 0.01 μg/, 3.1 μg/L, and 0.4 μg/L, respectively.
Sediment Sample Treatments
The sediment test items included soil organic carbon (SOC), petro, Cu, Zn, Pb, Cd, Cr, As, and Hg. The sediment samples were freeze-dried for 24 hours and then passed through 250-mesh nylon sieves. All the digested samples were prepared for analysis after filtration using a 0.45-µm fiber filter. Aliquots of 100 g of the sediments were treated with an H2O2 solution and oven dried at 40ºC for 24 hours to complete for grain-size assessments. The sediment samples were dried at a constant temperature (<60ºC) and filtered using a 250-mesh filter. The properties of the sediments were analyzed using a Mastersizer 2000 laser diffraction particle size analyzer. The SOC was determined using an Elementar Vario MACRO cube CHNS analyzer after removing the inorganic carbon with 1 M HCL. Approximately 1 g of dry weight of the sieved (1 mm mesh), dried (60ºC), and ground sediment was digested with HNO3 (62%) and HCL (37%) according to USEPA method 3050B [30]. The concentration levels of metals were determined using an inductively coupled plasma mass spectrometry [31]. The quality of the analytical data was guaranteed through the implementation of laboratory quality assurance and quality control methods [13]. For example, blank and replicate samples were used for quality control. The precision of the analytical procedures was tested by recovery measurements on Chinese national geostandard samples [13, 18]. The recovery rates ranged between 95% and 110%. The relative standard deviations (RSDs) of all the measured elements were less than 10%. All of the analysis processes were carried out in duplicate, and the results were expressed as the mean.
Assessment Methods
Ecotoxicity Assessments of the Heavy Metals
The Geoaccumulation Index (Igeo) is a quantitative indicator of metal pollution in aquatic sediments and has been recommended in previous studies [32]. The index of the defined Igeo was calculated as follows [33]:
Where Cn is the measured concentration of metal n, and Bn represents the geochemical background concentration of metal n [13]. A correction index of 1.5 is applied to characterize the sedimentary and geological traits of rocks and other effects. Igeo consists of seven classes of sediment quality. Müller (1981) interpreted the classification as follows: Igeo≤0 (Class 0, uncontaminated); 0<Igeo≤1 (Class 1, unpolluted to moderately polluted); 1<Igeo≤2 (Class 2, moderately polluted); 2<Igeo≤3 (Class 3, moderately to heavily polluted); 3<Igeo≤4 (Class 4, heavily polluted); 4<Igeo≤5 (Class 5, heavily to extremely polluted); Igeo>5 (Class 6, extremely polluted) [33].
The Potential Ecological Risk Index (PERI) was also established to assess the ecological risks of heavy metals in sediments [13, 34]. The formulae for the ecological risks of single heavy metals and the comprehensive ecological risks of multiple heavy metals are as follows [34].
Where PERI is used to assess the toxicity of heavy metals [34]; Cfi is the potential ecological risk coefficient of a certain heavy metal, which is generally applied to indicate the contamination levels of single heavy metals [13]; Coi is the measured concentration of the heavy metal; Cni indicates the background reference level for element i; ERi is the potential ecological risk coefficient of a certain heavy metal; Tri is the toxic-response factor for element i; and Tri is set as follows: As = 10, Cd = 30, Cr = 2, Cu = Ni= Pb = 5, and Zn = 1. Therefore, according to the classification [34], the following would apply: PERI<150 = low grade; 150≤ PERI<300 = moderate grade; 300≤PERI<600 = severe grade; and PERI>600 = serious grade.
Numerous sediment quality guidelines (SQGs) have been used to assess heavy metal contamination [13]. The marine sediment quality of China (GB18668-2002) that consists of three grades of marine sediments are considered as the parameters to be applied to classify marine sediment quality [35]. In addition, threshold effects levels (TELs) and probable effects levels (PELs) are two common sediment quality guidelines that have been employed to evaluate the potential risks of metal content pollution. The PELs demonstrate the concentrations above which adverse effects are expected to frequently occur. The TELs represent the content above which the toxic effects of long-term exposure to those contaminants may be expected [36]. The spatial distributions of the heavy metal concentrations in the coastal water and sediments of Haizhou Bay were characterized by applying an inverse distance weighted (IDW) method to interpolate the concentration levels of the heavy metals. The distances between the interpolation points and the discrete points were used as the weights for the weighted averages. The closer the discrete points were to the interpolation points, the greater the weights given to the discrete points [37, 38]. The spatial distributions of those elements were used for the IDW method in the platform of ArcGIS 10.2.
Statistical Analysis
The heavy metals in sediments generally come from different natural and anthropogenic sources [39]. Organic matter content and grain sizes are two of the main factors influencing heavy metal regimes in sediments [40]. Multivariate statistical methods, including Pearson’s Correlation Coefficient and Principal Component Analysis (PCA), are commonly applied to identify the potential sources and relationships of heavy metals and clarify the natural and anthropic contributions. Pearson Correlation Analysis, which evaluates the linear correlation between two parameters, is commonly adopted in the study of hydrochemical processes [41]. The relationships between the content levels of heavy metals and selected sediment properties have been closely examined. PCA, a high frequently multivariate statistical technique, is extensively applied to identify the potential sources and variables of heavy metals, since it can reduce the dimensionality of variables and integrate the majority of parameters with fewer principal components [9,18]. Prior to performing PCA, Kaiser-Meyer-Olkin (KMO) and Bartley sphericity tests are performed to examine the validity of PCA. Generally speaking, a component total larger than 0.6 is considered to be an important contributor, while those smaller than 0.30 are minor contributors. PCA analysis methods have also been performed to identify interrelationships and the possible sources of heavy metals. A varimax rotation of principal components can be applied to identify the total picture for more meaningful representation of underlying factors. The factor loadings may be classified as ‘strong’, ‘moderate’, or ‘weak’, by considering their significant influencing effects in the geochemical processes corresponding to the absolute loading values of >0.7, 0.70 to 0.50, and 0.50 to 0.40, respectively [42].
Results
Physical-Chemical Parameters and Heavy Metal Concentration Levels in Haizhou Bay
After examining the water samples, this study found that the mean pH value was 7.6; mean salinity was 31.96%; and the mean water temperature was 18.77ºC. The concentration levels of the physical-chemical parameters between high tide and low tide, along with the concentrations of Cu, Pb, As, and Zn in the water samples obtained from Haizhou Bay, are detailed in Table 1. In regard to the chemical parameters of the water samples, it was observed that the NO2-N concentrations fluctuated from 0.002 to 0.77 mg/L, with a maximum recorded at Station No. 5. The mean concentrations of heavy metals varied from 9.33 to 29.10 mg/kg for Cu; 27.30 to 93.40 mg/kg for Zn; 12.8 to 32.3 mg/kg for Pb; 0.05 to 0.14 mg/kg for Cd; 30.00 to 79.10 mg/kg for Cr; and 6.46 to 13.7 mg/kg for As. The mean concentrations of heavy metals in the water samples followed the order of: Zn>As>Cu>Cr>Pb>Cd. The average content of As (with the highest content reaching 7.31 µg/L) was only half that of the average content of Zn. The average values of Zn, As, and Cu were 8.41 µg/L, 4.49 µg/L, 3.95 µg/L, respectively. When compared with the national standard of GB3097-1997, the results indicated that the contents levels of the aforementioned heavy metals were relatively low in coastal water of the study area.
The heavy metal content levels in the sampled sediments are detailed in Table 2. The SOC content level at Station No. 19 was the highest among all the sample stations. The mean values of Cu, Zn, Pb, Cd, Cr, and As were 20.34 mg/kg, 63.48 mg/kg, 23.84 mg/kg, 0.09 mg/kg, 59.57 mg/kg, and 10.61 mg/kg, respectively. This study determined that all the heavy metal content levels met the quality standards of the Marine Sediment Quality-I.
Assessment of the Heavy Metal Concentrations in the Sediments Using Igeo and PERI
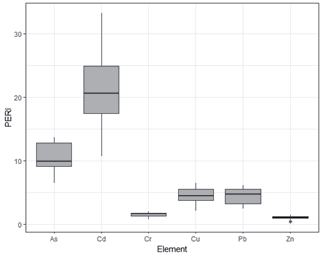
The Igeo indices of all the heavy metal elements were found to be below 0 at all the sampling sites examined in this study. Therefore, it was indicated that the sediments were not significantly polluted and appeared to have relatively similar distribution and minor enrichment patterns in Haizhou Bay (Fig. 3). The Igeo of the heavy metals in the sediments followed the order: Cu>As>Cr >Zn>Pb>Cd. In addition, the majority of the PERI values of the heavy metals were at relatively low levels, as shown in Fig. 4. The order of the PERI values was as follows: Cd>As>Pb>Cu>Cr>Zn, and the average values of all the elements were lower than 30. Therefore, the results revealed that the ecological risks of heavy metal contamination were relatively low.
Pca and Correlation Analyses of the Heavy Metal Concentrations and Potential Risks
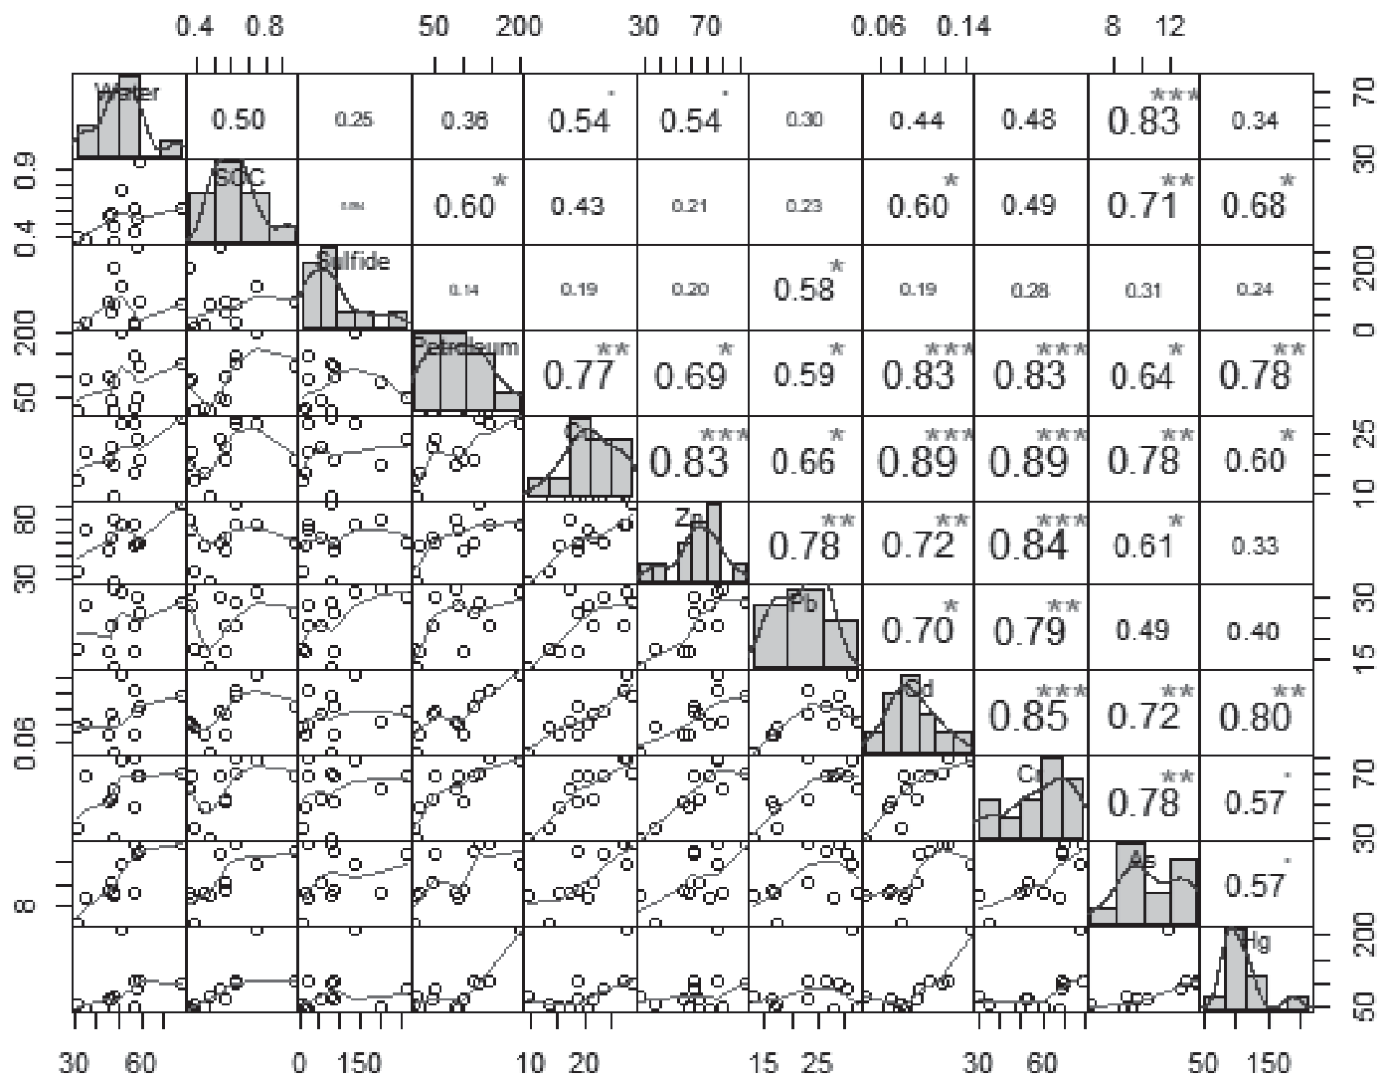
A total of the principal components with eigenvalues >1 were extracted as PC1, PC2, and PC3 when using varimax rotation, and their cumulative variance contribution rate reached 84.05% of the total variances (Table 3). As shown in the table, the first component (PC1) accounted for 61.91% of the total variance, which was strongly and positively related to Zn, Cr, Cu, Pb, and Cd. Therefore, it was indicated that they may have originated from common sources. Those elements were considered to be anthropogenic contaminants related to the discharge of agricultural and industrial wastewater. It has been confirmed that the extensive use of pesticides can also influence the distribution patterns of sulfides. The variance contribution rate of the second common factor (PC2) was 12.43%. Those findings demonstrated that the second factor was strongly positively loaded with SOC, As, and Hg. The results suggested that the SOC could play a potential role in determining heavy metal distributions in various sediments, since the distribution patterns were related to the intensive use of phosphate fertilizers in agriculture and aquaculture activities. The PC3 common factor accounted for 9.71% of total variance and was determined to be strongly positively loaded with sulfides. However, the heavy metal content levels in the sediments were found to not exceed their marine sediment quality. Therefore, it was clearly shown that in the study area, the Zn, Cr, Cu, Pb, and Cd potentially originate from anthropogenic inputs, while the As, Hg, and sulfides may be predominately controlled by the parent materials of the marine sediments.
Table 1.
Mean value of physical-chemical parameters of water samples between high tide and low tide and heavy metals concentration at the 20-sampling station over the study period. Table 1. Mean value of physical-chemical parameters of water samples between high tide and low tide and heavy metals concentration at the 20-sampling station over the study period.
[i] The values are the mean of low tide and high tides. Sea water quality standard is divided into four types: I, II, III, IV. Class I is suitable in marine protection area and endanger marine biological protection area. Class I is suitable for aquacultural, bathing beach, marine sport. Class III is suitable for industrial water and Class IV is the water in the port and marine exploration area.
Table 2.
Mean value of physical-chemical parameters heavy metals concentration of the sediment at the sampling station.
Fig. 3.
Geo-accumulation indexes (Igeo) of the heavy metal concentration in the sediment of Haizhou Bay.
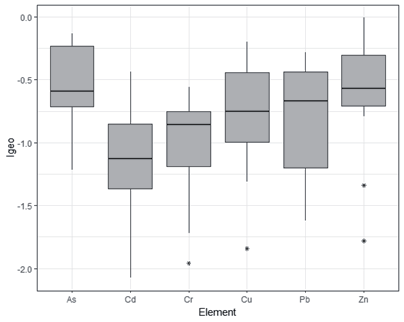
Fig. 4.
The histogram shows the distribution of the PERI values for heavy metals in the surface sediments of the Haizhou Bay.
Pearson’s Correlation Analysis was applied in this study to identify the relationships between the physicochemical properties and the heavy metal content levels (Fig. 5). As was correlated with the SOC content (coefficient of correlation r = 0.71). The Pearson’s Correlation Coefficients demonstrated close positive relationships among the different elements, including Cu – Cd and Cr – Cu (r = 0.89). It was indicated that the sources of Cu, Cd, and Cr had shared general origins in the surface sediments or enrichment mechanisms. The As, Cr, Cd, and Cu were all significantly correlated at the level of 0.01, and the correlation coefficients were greater than 0.5. The results suggested that those pairs of heavy metals may have the same pollution sources.
Table 3.
Total variable of the principle component analysis (the loadings over 0.5 are marked in bold).
Spatial Distribution Patterns of the Heavy Metal Concentrations in the Water and Sediments
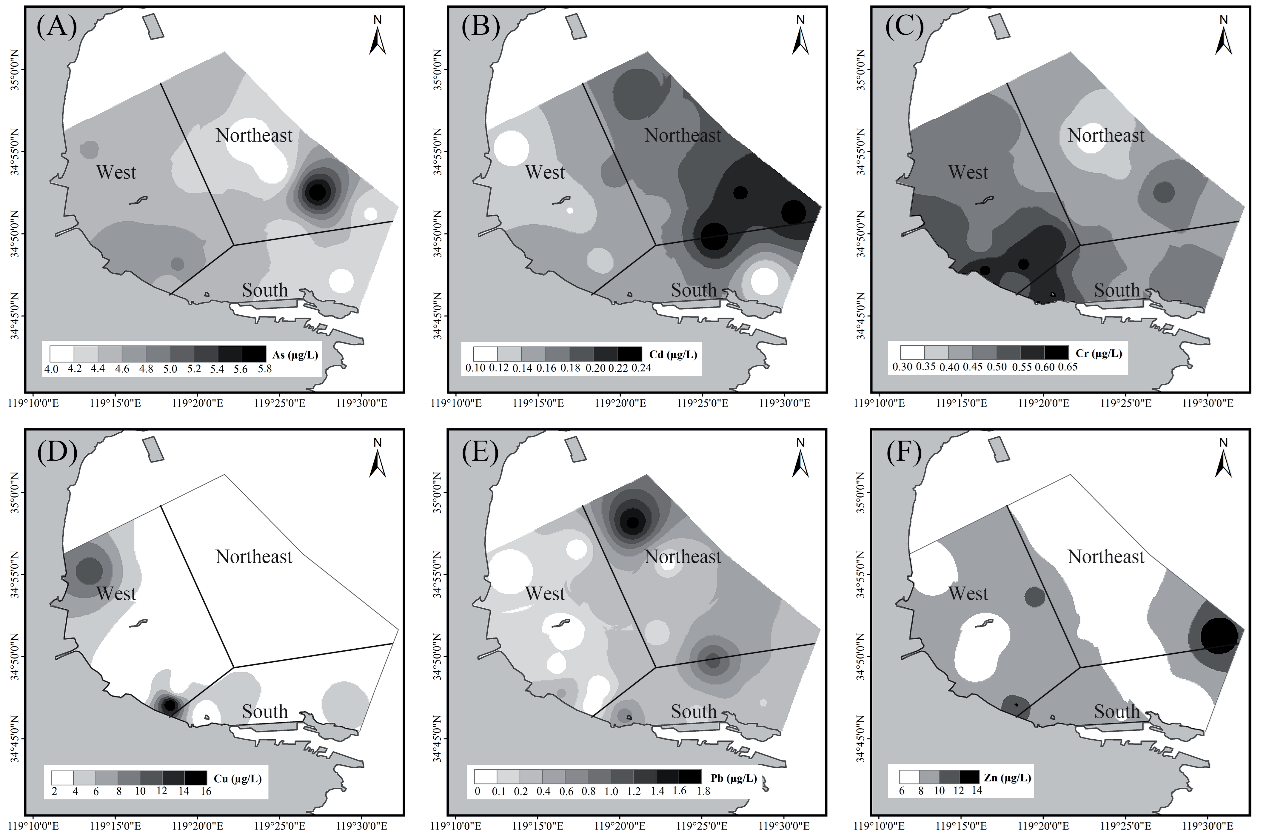
The differences in the spatial distribution patterns of the heavy metals could primarily be attributed to the combination of natural sources and human activities [43]. The western and southern areas of Haizhou Bay were identified as having relatively short distances to the coastline, while the northeastern part of the study area contained no terrestrial land. Increased As concentration levels in the sampled water were mainly from locations in the northeastern part of Haizhou Bay (Fig. 6). The highest As concentration was 7.31 µg/L, whereas the As content in the western portion of the study area was only 3.9 µg/L. The spatial distributions of Pb in the water samples was lower in the western and southern coastal areas and higher in the northeast, which may have been related to marine engineering activities. The Cr concentration levels in the water samples in the coastal western area were 0.70 µg/L, while the concentration levels of the coastal water in the northeastern area was only 0.30 µg/L. In the western coastal area, the Cd concentration was only 0.10 µg/L, and the highest Cd value (0.24 µg/L) was found in the northeastern section. The spatial distribution patterns of the Cu in the water samples were lower in the northeastern area and higher in the western area, which may have been related to the limited fishing activities in the northeastern portion of the study area.
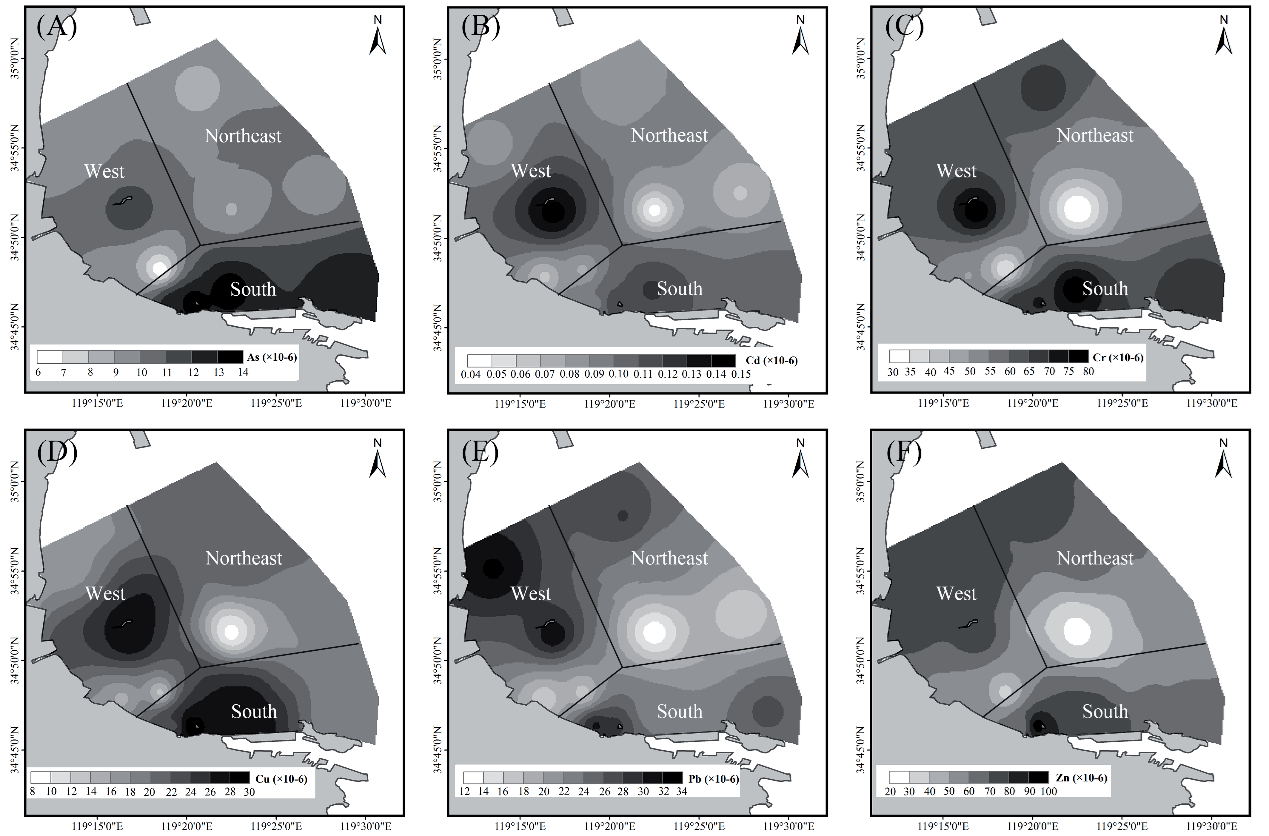
The distribution patterns of the heavy metal concentrations in the various sediments indicated the spatial variations of the different metals (Fig. 7). For example, the distribution patterns of Cu, Pb, and Zn were found to be similar, although their concentrations levels differed, with higher sampling values mainly obtained in the southern and western areas. In addition, higher concentrations of As were mainly exhibited in the southern portion of Haizhou Bay. Moreover, due to marine transportation development and industrial pollution factors, the content levels of heavy metals on Liandao Island were higher than those of the northeastern section of the study area. The concentration levels of Cu, Pb, Zn, Cr, Cd, and As in the sediments showed decreasing trends from the south and west to the northeast, which could be explained by the land-based pollutant enrichment in the coastal areas, as well as the complex interactions of the hydrodynamic conditions and the sediment particle sizes.
Discussion
Possible Sources of Heavy Metals in Haizhou Bay
In the present study, statistical approaches were applied to identify the potential relationships and sources among the examined heavy metals. It was considered that the correlations between the heavy metal concentration levels could potentially be applied to assess the common sources of the heavy metal elements in the study area [13]. For example, if a high correlation coefficient existed between two heavy metal elements, it was clearly indicated that they may share a common source. In the study conducted by Li and Xu (2014), it was found that strong correlations existed between Cd, Cu, Pb, Cr, and Zn with correlation coefficients greater than 0.7 (p<0.01), thereby illustrating the same or similar heavy metal pollution levels [44]. Previous studies have also suggested that the point source contamination of Cd in groundwater is related to industrial pollution [45]. It has been determined that the Cd contamination could originate from tsunamigenic sediments, oil-based power generation, ship waste products, and anticorrosive paints applied on boats and ships, as well as other anthropogenic activities [46]. It was also observed that the SOC of the sediments had obvious positive correlations with the heavy metals, demonstrating that the SOC is one of the main factors determining surface sediment heavy metal content and distribution levels [44]. Although the Cr was primarily demonstrated as a human activities’ component since it was confirmed that the Cr stemmed from human activities input, it also displayed lower content levels than the marine sediment quality guidelines. Moreover, the As and Hg were both classified as natural components, which verified that they were predominately the results of marine sediments, with anthropogenic activities playing only a minor role in their distribution. However, since the spatial distribution patterns of the Zn were affected by both atmospheric precipitation and the release of sediments, the concentrations levels of Zn were found to be lower nearshore and higher offshore in the water samples [47, 48].
The potential sources of heavy metals may be from both natural geochemical weathering of soil and rocks and human-induced activities, such as agricultural fertilization, mineral mining, and industrial production [4, 49]. Due to the rapid economic development in Haizhou Bay during the 1990s, coastal urbanization has become an important impetus pushing economic development in the region. The wastewaters discharged from developing industrial and agricultural sources have been deemed as the primary pollution sources [44]. Heavy applications of fertilizers and agrochemicals during aquaculture processes, as well as increased marine transportation activities in the region, may be crucial sources of heavy metal pollution. The development of marine ranching in Haizhou Bay is another source of heavy metal pollution [28]. The construction of Xidadi and its port have weakened the hydrodynamics conditions, decreasing the self-clean ability of the water body. The tidal current in Haizhou Bay is a regular semidiurnal tide, which contributes to the transfer of sediment with fine grain sizes from the offshore to the nearshore areas [50, 51]. Heavy metal content in groundwater is closely related to natural hydrogeochemical processes and human activities. Wang et al. (2021) investigated the spatial distribution characteristics and influencing factors of heavy metals in coastal groundwater and conducted a health risk assessment [8]. The results revealed that the main heavy metal pollutant in the groundwater was As, with a mean value of 0.61 mg/L. This was significantly lower than the mean value (4.49 mg/L) found in the surface water of the study area.
In regard to the spatial distribution patterns, it was observed that under the influencing effects of seasonal variations, terrain, and hydrodynamics conditions, the distribution patterns of the heavy metals had obvious differences. For example, the distribution patterns of heavy metals in the areas surrounding the port in Haizhou Bay were relatively higher [52]. Li and Xu (2014) analyzed the sources and risk assessments of heavy metals from the surface sediments in Haizhou Bay and found the distribution patterns of heavy metals exhibited landward, as well as northeastward, increasing trends [44]. The concentrations of Cr and Cu in the water were much higher in the nearshore areas. This demonstrated that the land-based pollution inputs were the main pollution sources of the heavy metals in those sections of the bay. Li and Xu. (2014) determined that the highest values of heavy metals were obtained near the Qingkou Estuary located in the southwestern portion of Haizhou Bay [44]. It was found that hydrodynamics effects diffused the currents entering the sea toward south, and sand particles tended to be deposited in the estuary due to its weak hydrodynamics. Therefore, it could be assumed that the rivers entering the sea bring abundant heavy metal pollution material. Those heavy metal elements are not deposited at the river mouth but continue to be transported into the southern portions of the bay by strong water currents to be deposited in the coastal mudflats [53].
Comparison of the Concentration Levels of Different Heavy Metals in Haizhou Bay
The coastal lands have been substantially modified by land reclamation processes and have been used for industrial development and agricultural purposes [54]. In Haizhou Bay, the content levels of all heavy metals were determined to be better than the Marine Sediment Quality Class I, and thereby met the requirements of coastal tourism and marine port development. Li and Xu (2014) determined that the potential ecological risks posed by those heavy metals were as follows: Cd>As >Cu>Pb>Cr>Zn. Li and Xu (2014) also analyzed the content of heavy metals in Haizhou Bay and it was observed that the Pb and As content levels in this study were higher, ranked as “moderate potential ecological risks. However, the Cd, Cr, and Zn concentrations confirmed in this study were lower than those observed in Li and Xu’s research. In the study conducted by Lu et al. (2020), it was found that with the exception of Cr, the content levels of Cu, Pb, As, and Cd were greater than those observed in this study. This may have been related to the fact that the investigation sample points were closer to the coastline and the differences could be attributed to the intensive anthropogenic activities in those regions. Li et al. (2017) found that the heavy metal content levels were slightly higher than those in this study. When compared with other typical sea areas in China, the concentrations of Zn, Cd, and Cr were lower than that those observed in the Yangtze River Estuary, and the Cu and Pb concentrations were higher compared to those in the Beibu Gulf. In other study areas, such as Jiaozhou Bay, the content levels of Cd, As, Cu, Pb, Cr, and Zn were 0.0817 mg/kg, 7.164 mg/kg, 24.93 mg/kg, 32.3 mg/kg, 45.1 mg/kg, and 69.68, respectively.
Table 4.
The guidelines values of different criteria in heavy metals concentration in sediment.
The multivariate analysis results showed that the Cd, Cr, Ni, Pb, and Zn mainly originated from anthropogenic sources [55]. Qiu (2015) studied the bioaccumulation and trophic transfer of heavy metals in both natural marine ecosystems and the mariculture ecosystems of Daya Bay in Southern China [56]. Reported heavy metal concentrations in surface sediments from other coastal areas are summarized in Table 4. Based on the Marine Sediment Quality (GB18668-2002) of China (AQSIQ, 2022), in which concentrations of arsenic and heavy metals in marine sediments are classified into three types (Type I, Type II, and Type III), most of the element concentrations for the samples obtained in this study were lower than the Class I type [22]. This confirmed that Haizhou Bay has relatively good sediment quality.
Conclusions
Coastal and marine areas favor the accumulation of potentially contaminant elements due to their special locations. With the rapid development of industrialization and coastal land reclamation, significantly excess organic and inorganic pollutants are released into coastal zones, thereby increasing heavy metal accumulation and causing serious heavy metal pollution risks to coastal ecosystems. In this study, the heavy metal concentrations levels in the water and sediments along the coastal and marine areas of Haizhou Bay were analyzed. The results revealed that the As concentration levels of the sediment samples were lower than the PEL. In addition, the risk assessment results for the sampled sediments (including PERI and Igeo) indicated that the coastal ecosystems were still in a pristine state with respect to heavy metal pollution. The results of the statistical analysis suggested that the Cu mainly originated from natural sources, while the As was principally from anthropogenic sources. The spatial distribution patterns also clearly depicted the extent of the heavy metal pollution and the importance of geo-statistical tools as effective modes for comparing the concentrations of heavy metals. The information collected through the present study can be used as important baseline data for the future monitoring of heavy metal pollution in Haizhou Bay.

