

Introduction
The unplanned urbanization and industrialization in South Asian developing countries have significantly deteriorated their air quality [1]. Thus, an increase in air pollution is a continuous threat to indigenous communities, as health status and living standards are inversely related to increased air pollution [2]. Air pollution is considered one of the most prominent environmental risks to human health [3]. It is reported that almost 6.7 million premature deaths have occurred due to ambient air pollution and household air pollution on an annual basis [4]. In 2019, ambient air pollution was purportedly responsible for 4.2 million premature deaths worldwide [5]. Most cases of premature deaths due to air pollution have been reported in developing and underdeveloped countries [6]. It is very unfortunate that a survey conducted in 2019 revealed that 99% of the world’s population was living in polluted areas [7]. Several acute and chronic diseases like cancer, cardiac diseases, and respiratory diseases can be controlled by reducing air pollution levels [8]. Air pollution can be reduced by developing environment-friendly policies and investing in a green economy [9].
There are numerous sources that contribute to air pollution, with six primary pollutants serving as key contributors. These pollutants include particulate matter, carbon dioxide (CO2), carbon monoxide (CO), nitrogen dioxide (NO2), sulfur dioxide (SO2), and ozone (O3) [10]. CO, CO2, and SO2 are primarily emitted by industries and transportation sectors [11]. Construction is identified as the primary culprit responsible for elevating particulate matter levels in the atmosphere [12]. Air pollution is affecting both children and adults [13]. Pakistan, ranking as one of the largest and second most populous countries in South Asia after India, also exhibits a notably high relative population density. Worldwide, Pakistan is the 33rd largest country, comprising an area of 882,000 km2 and a population of 207.8 million [1]. One of the main reasons for rapid urbanization is immigration. Rapid urbanization, largely driven by immigration, has led to the conversion of vast agricultural and forested lands into urban settlements [14]. The combined factors of population growth, industrialization, and transportation have contributed to severe airborne diseases in the country’s urban areas [15]. Particulate matter, heavy metals, as well as carbon and sulfur oxides are affecting the atmosphere of Pakistan [16].
Air pollution has a notably more severe impact on megacities across Pakistan compared to rural areas and smaller towns [17]. Major metropolitan hubs such as Karachi, Lahore, Faisalabad, Quetta, Peshawar, Islamabad, and Rawalpindi are reported to be the most heavily polluted cities in the country [18]. In these cities, the average PM10 is two times more than the permissible limits. It was recorded at 550 µg/m3, whereas the permissible level is 250 µg/m3 [19]. In the same way, oxides of carbon, sulfur, and nitrogen were higher than international standards [20, 21]. These facts indicate that residents of these cities are at a higher risk of being affected by airborne diseases [14].
Poor planning aimed at achieving economic objectives has significantly contributed to severe pollution problems in Pakistan. Additionally, inadequate governmental intervention and ineffective control strategies have exacerbated the rise in air pollution within the country [22]. A concerning revelation is that nearly the entire population is exposed to PM2.5, which surpasses the threshold level of particulate matter, raising substantial concerns [23, 24]. Furthermore, during winter, the escalation of air pollution becomes more pronounced, often manifesting as smog [25, 26].
It is very obvious from the above-mentioned facts that the air quality of Pakistan is very poor. This poor air quality can cause negative impacts on human health and the environment of the country. Alarmingly, air pollution is attributed to more than one-fifth of mortality in Pakistan [24]. According to the World Bank, the annual health burden due to particulate matter is 1% of the GDP [27]. However, the Pakistan Environmental Protection Agency has started to take measures to monitor air quality and reduce industrial pollution emissions [28]. The issue of air pollution control in Pakistan has yet to become a focal point in elections, largely due to insufficient information available to decision-makers and policymakers. The presented work is based on the hypothesis that air quality parameters exhibit broad variations, both spatially and temporally, concerning concentration, size, magnitude, and chemical composition within the study area of Faisalabad, Pakistan. These variations likely stem from various sporadic local sources. The study aimed to assess the concentrations of CO2, CO, temperature, relative humidity, sound intensity, and particulate matter during the spring and autumn seasons. Its primary objective was to estimate the role of urban vegetation in mitigating these harmful pollutants.
Materials and Methods
Study Area
This study was conducted in 2020 during the spring and autumn seasons (March and October 2020). The air quality parameter for this study was recorded from the Faisalabad city of Punjab province, Pakistan, with an average annual precipitation of 375 mm.
Air Quality Parameter Sampling
The distribution of air pollutants in Faisalabad city throughout the spring and autumn seasons was determined by using different instruments. The air quality parameters such as CO2, CO, temperature (oC), relative humidity (RH%), particulate matter (PM0.5, PM0.1, PM2.5), and sound intensity (SI) were noted in five selected sites (Table. 1). These sampling sites included very low, low, medium, high, and very high plant density. From each site, measurements of air quality parameters like SI (through a sound meter), PM0.5, PM0.1, PM2.5 (particulate counter), CO2, CO (air quality monitor), temperature, and relative humidity were measured through portable weather stations.
Table 1.
Ambient Air Quality of Faisalabad with Relevance to the Seasonal Variations
The geographic information system (GIS) was used to prepare a map of recorded values. Color-coded maps of these air quality parameters were built. The maps varied in color from blue to red, with blue exhibiting the lowest values and red exhibiting the highest values, whereas other colors like light gray, yellow, and orange exhibit intermediate ascending ranges of air quality parameters respectively.
Statistical Analysis
This study employed the monthly groups mentioned earlier to investigate the seasonal fluctuations in air pollutant concentrations within Faisalabad city. Pearson’s correlation coefficient was utilized to assess the relationship between pollutant concentrations and meteorological factors, and the findings were visualized through a correlation matrix. Employing a combination of wind speed, wind direction, and pollutant concentration stands as a standard approach for distinguishing between various source types [29, 30].
Results
Fluctuations in the Concentration of CO2 and CO and
Changes in the Pattern of Temperature and Relative
Humidity in Selected Sites
The gaseous pollutants such as CO2 and CO concentrations were recorded in the study site under different seasons. The concentration of these gaseous pollutants was found to vary from spring to autumn season (Figure 1). In these selected sites, the maximum values were found in the autumn season. The autumn CO2 and CO ranges from 340 to 390 ppm, and 8.5 to 11 ppm, respectively, in the study site. The ranges declined in the spring season due to the availability of leaf surfaces which captured the particulate matter and the ranges from 320 to 370 ppm, and 3.0 to 5.5 ppm in the study site. The gaseous concentration was changed from site to site and also declined from the autumn season to the spring season. The weather conditions such as temperature and RH values were recorded in the study site under different seasons. The fluctuation in temperature varies from site to site and season to season (Figure 1). In these selected sites, the maximum temperature values were found in the spring season. The spring temperature ranges from 23 ºC to 33 ºC in the study site. In addition, the humidity in the autumn season was relatively higher than in the spring season. The spring RH ranges from 30 to 55% in the study site. Variation in the Particulate Matter and Sound Intensity
under Seasonal Change
The particulate matter (PM0.5, PM1.0, and PM2.5) concentrations were recorded in five selected sites under different seasons. The concentration of this particulate matter was found to vary from spring to autumn season (Figure 2). In these selected sites, the maximum values were found in the autumn season, due to the high dust in the city environment. Also, vehicular combustion leaves the particle easily transported due to the current of air. The spring PM 0.5, PM1.0, and PM2.5 ranges from 20 to 45, 75 to 100, and 110 to 135 µg/m3 in the study site. The ranges increased in the autumn season due to the non-availability of leaf surfaces which captured the particulate matter and the ranges from 30 to 55, 80 to 105, and 120 to 145 µg/m3 in the study site. The concentrations of particulate matter varied in size from fine to coarse and also declined from spring season to autumn seasons for three types of PM 0.5, PM1.0, and PM2.5. The noise pollution recorded in the urban area was found to be different in the spring and autumn seasons. In the spring season, the sound intensity value ranges from 40 to 65 dB. However, in the autumn season, the SI value ranges from 35 to 60 dB. The detail of noise recorded values is illustrated in Figure 2.
Urban Trees, Seasonal Change and Air Quality
It was observed that various air quality parameters such as CO2, CO, temperature, RH, particulate matter (PM0.5, PM1.0, and PM2.5) and sound intensity depicted significant fluctuations in their concentration due to seasonal change and vegetation cover (Figure 3). The interactive effect of seasonal change and urban tree density also showed significant variation in the concentration of these air quality parameters. The observed results showed that the CO2 concentration was maximum in both seasons i.e., spring and autumn 381 and 377 ppm, respectively, at S1, as compared to other sites. In both seasons, a gradual decrease in CO2 concentration was recorded from S1 to S5, and minimum CO2 concentration was recorded at 320 and 340 ppm at S5. Overall, CO2 concentration was higher in the autumn season as compared to spring. However, the pattern of a gradual decrease in CO2 concentration was the same in both seasons. CO is another important gaseous pollutant that deteriorates air quality. The observed results showed that the CO concentration reached a maximum value of 5.5 and 11 ppm at S1 as compared to other selected sites in both seasons i.e., spring and autumn, respectively. The highest value of CO was recorded at 11 ppm at S1 during the autumn season but the lowest value was recorded at 3.0 ppm at S5 in the spring season. However, the decreased ratio of CO concentration was the same in both seasons. The temperature and RH both are significant climatic factors that play a critical role in the distribution of particulate matter in an urban environment. The observed results showed that the temperature was maximum in the spring and autumn seasons, 33 ºC and 22.6 ºC respectively, at S1 as compared to other sites. A gradual decrease in temperature value was recorded from S1 to S5, and the minimum temperature (24 ºC and 13 ºC) was recorded at S5 in spring and autumn respectively. However, in the case of RH, it was maximum in the autumn season as compared to the spring season. The maximum RH (64.66%) was recorded at S1 in autumn while the minimum RH (35%) was recorded in the spring season.
Fig. 1.
Variation in gasses (CO2 and CO) concentration and fluctuation in climatic conditions (temperature and relative humidity) due to seasonal change at the study site.
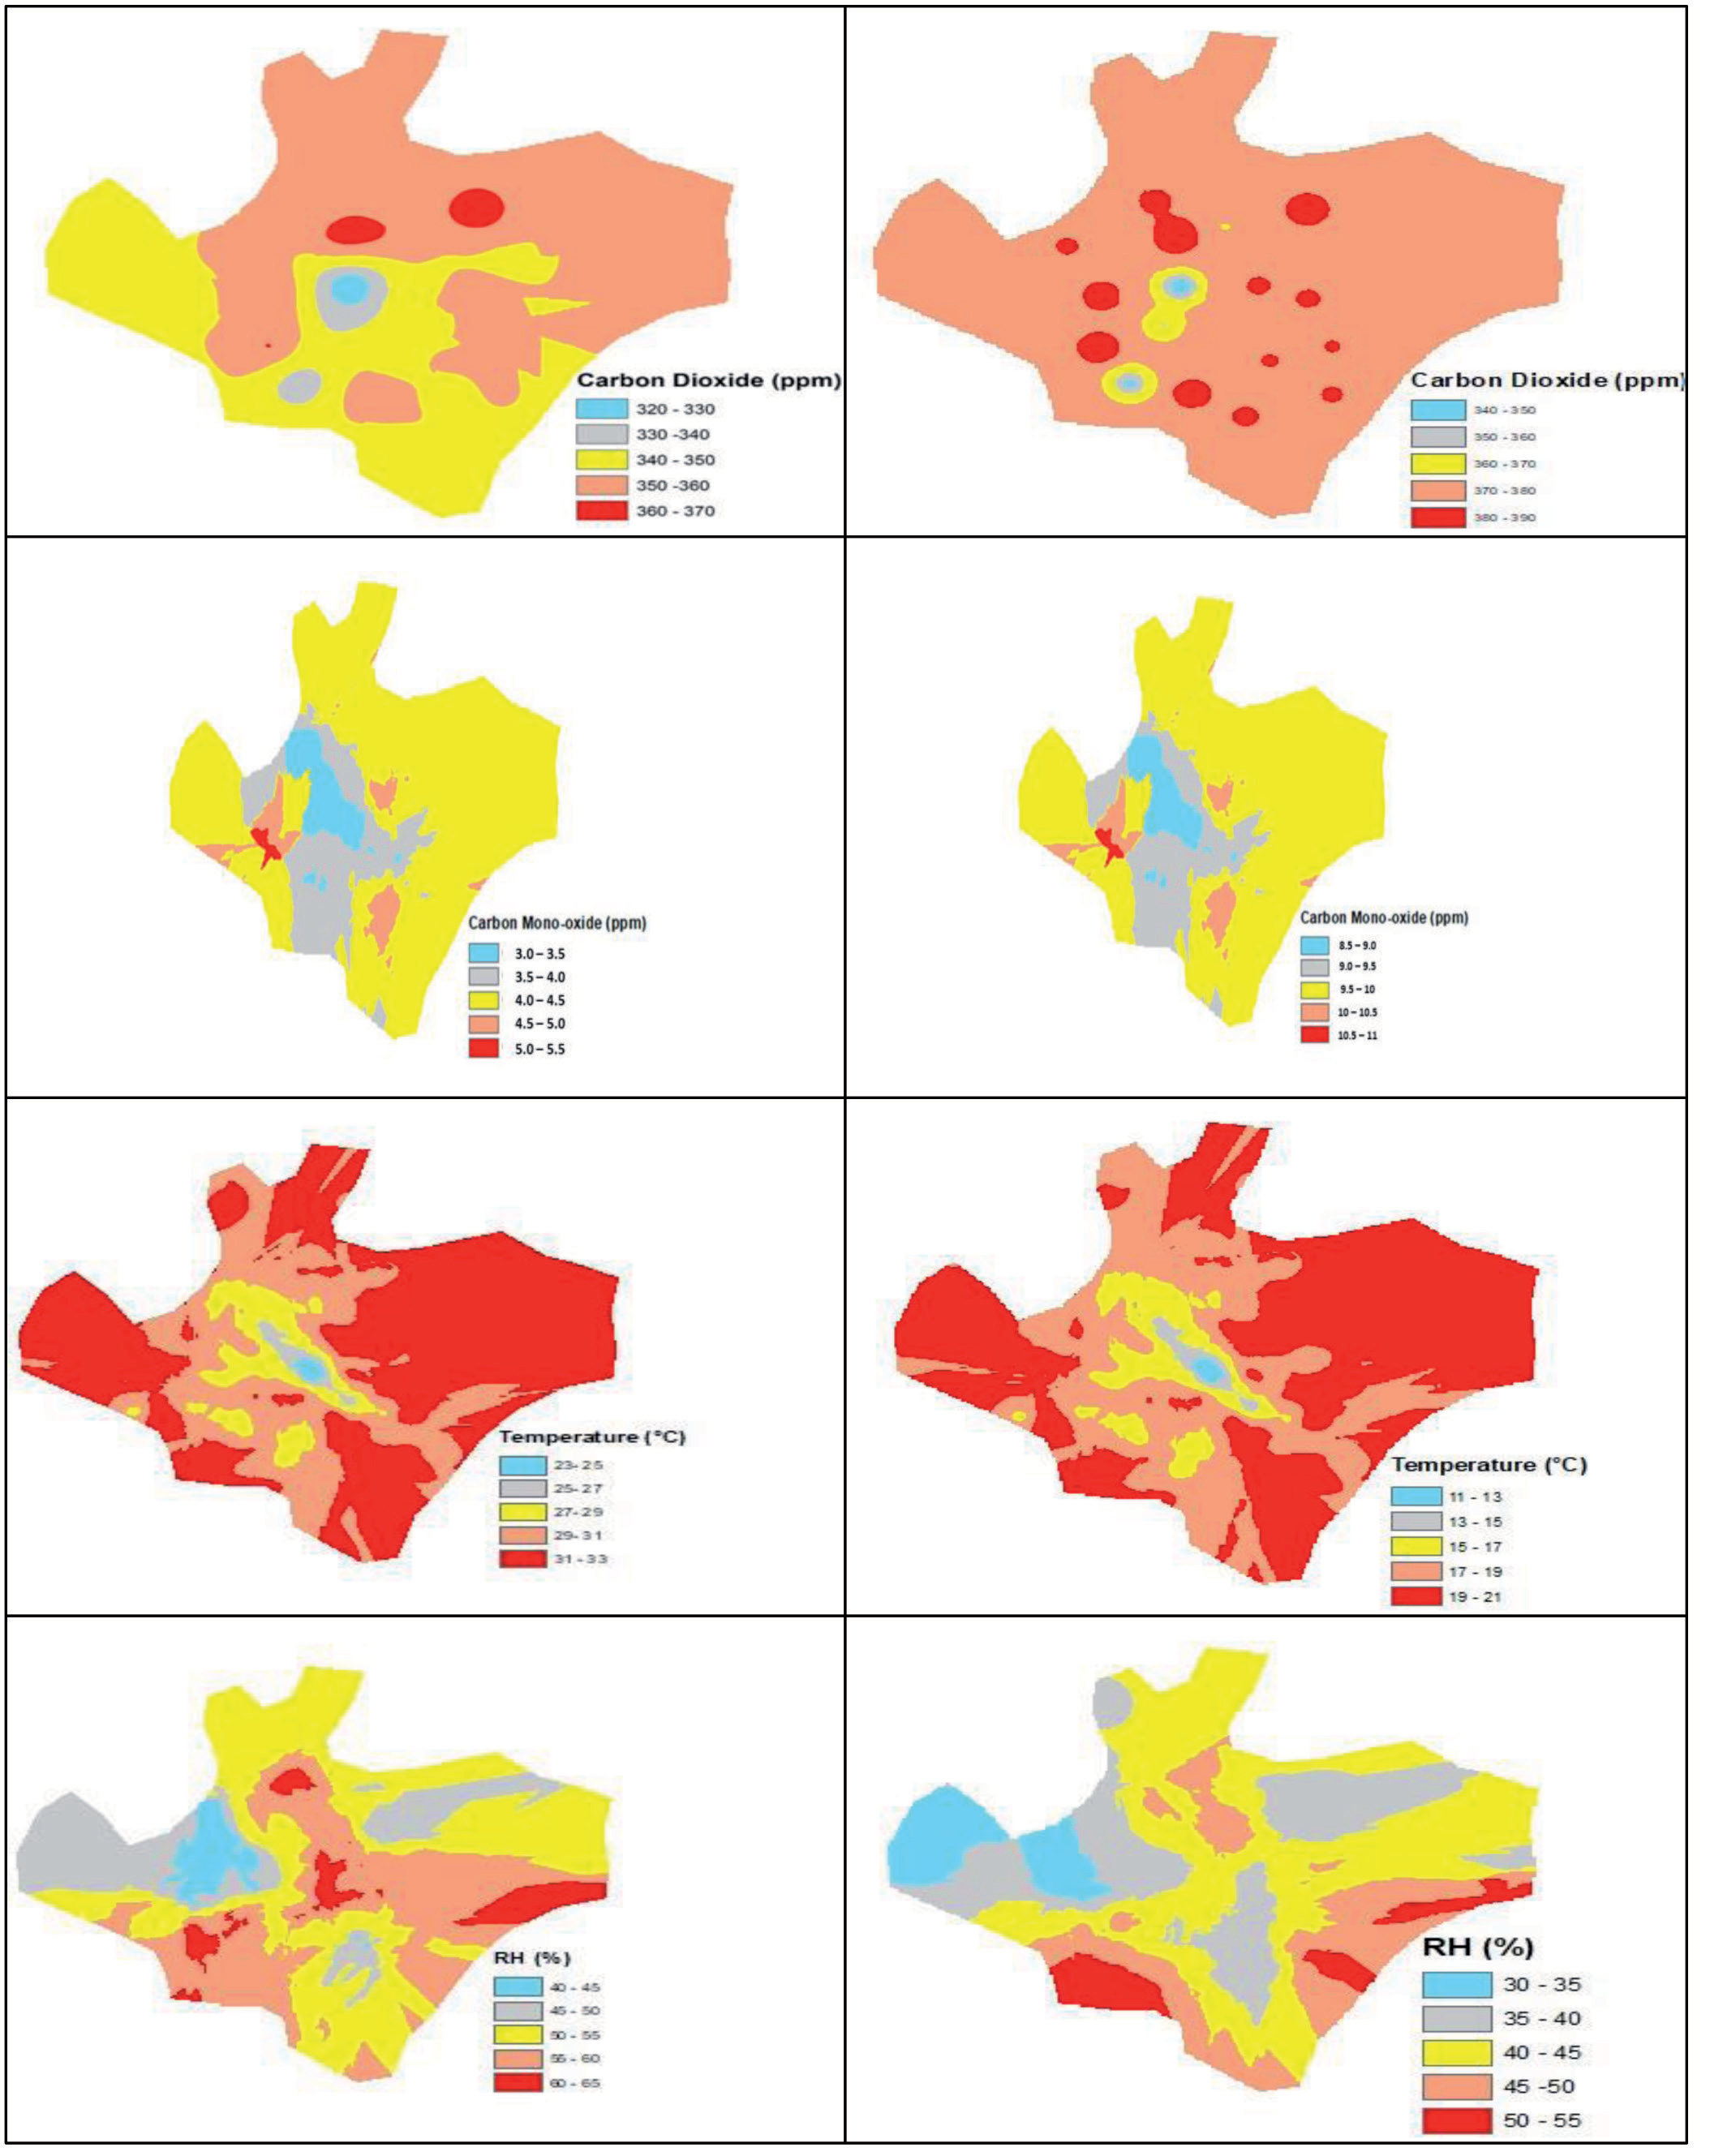
Fig. 2.
Distribution of particulate matter (PM0.5, PM1.0, and PM2.5) and variation in sound intensity under seasonal change at the study site.
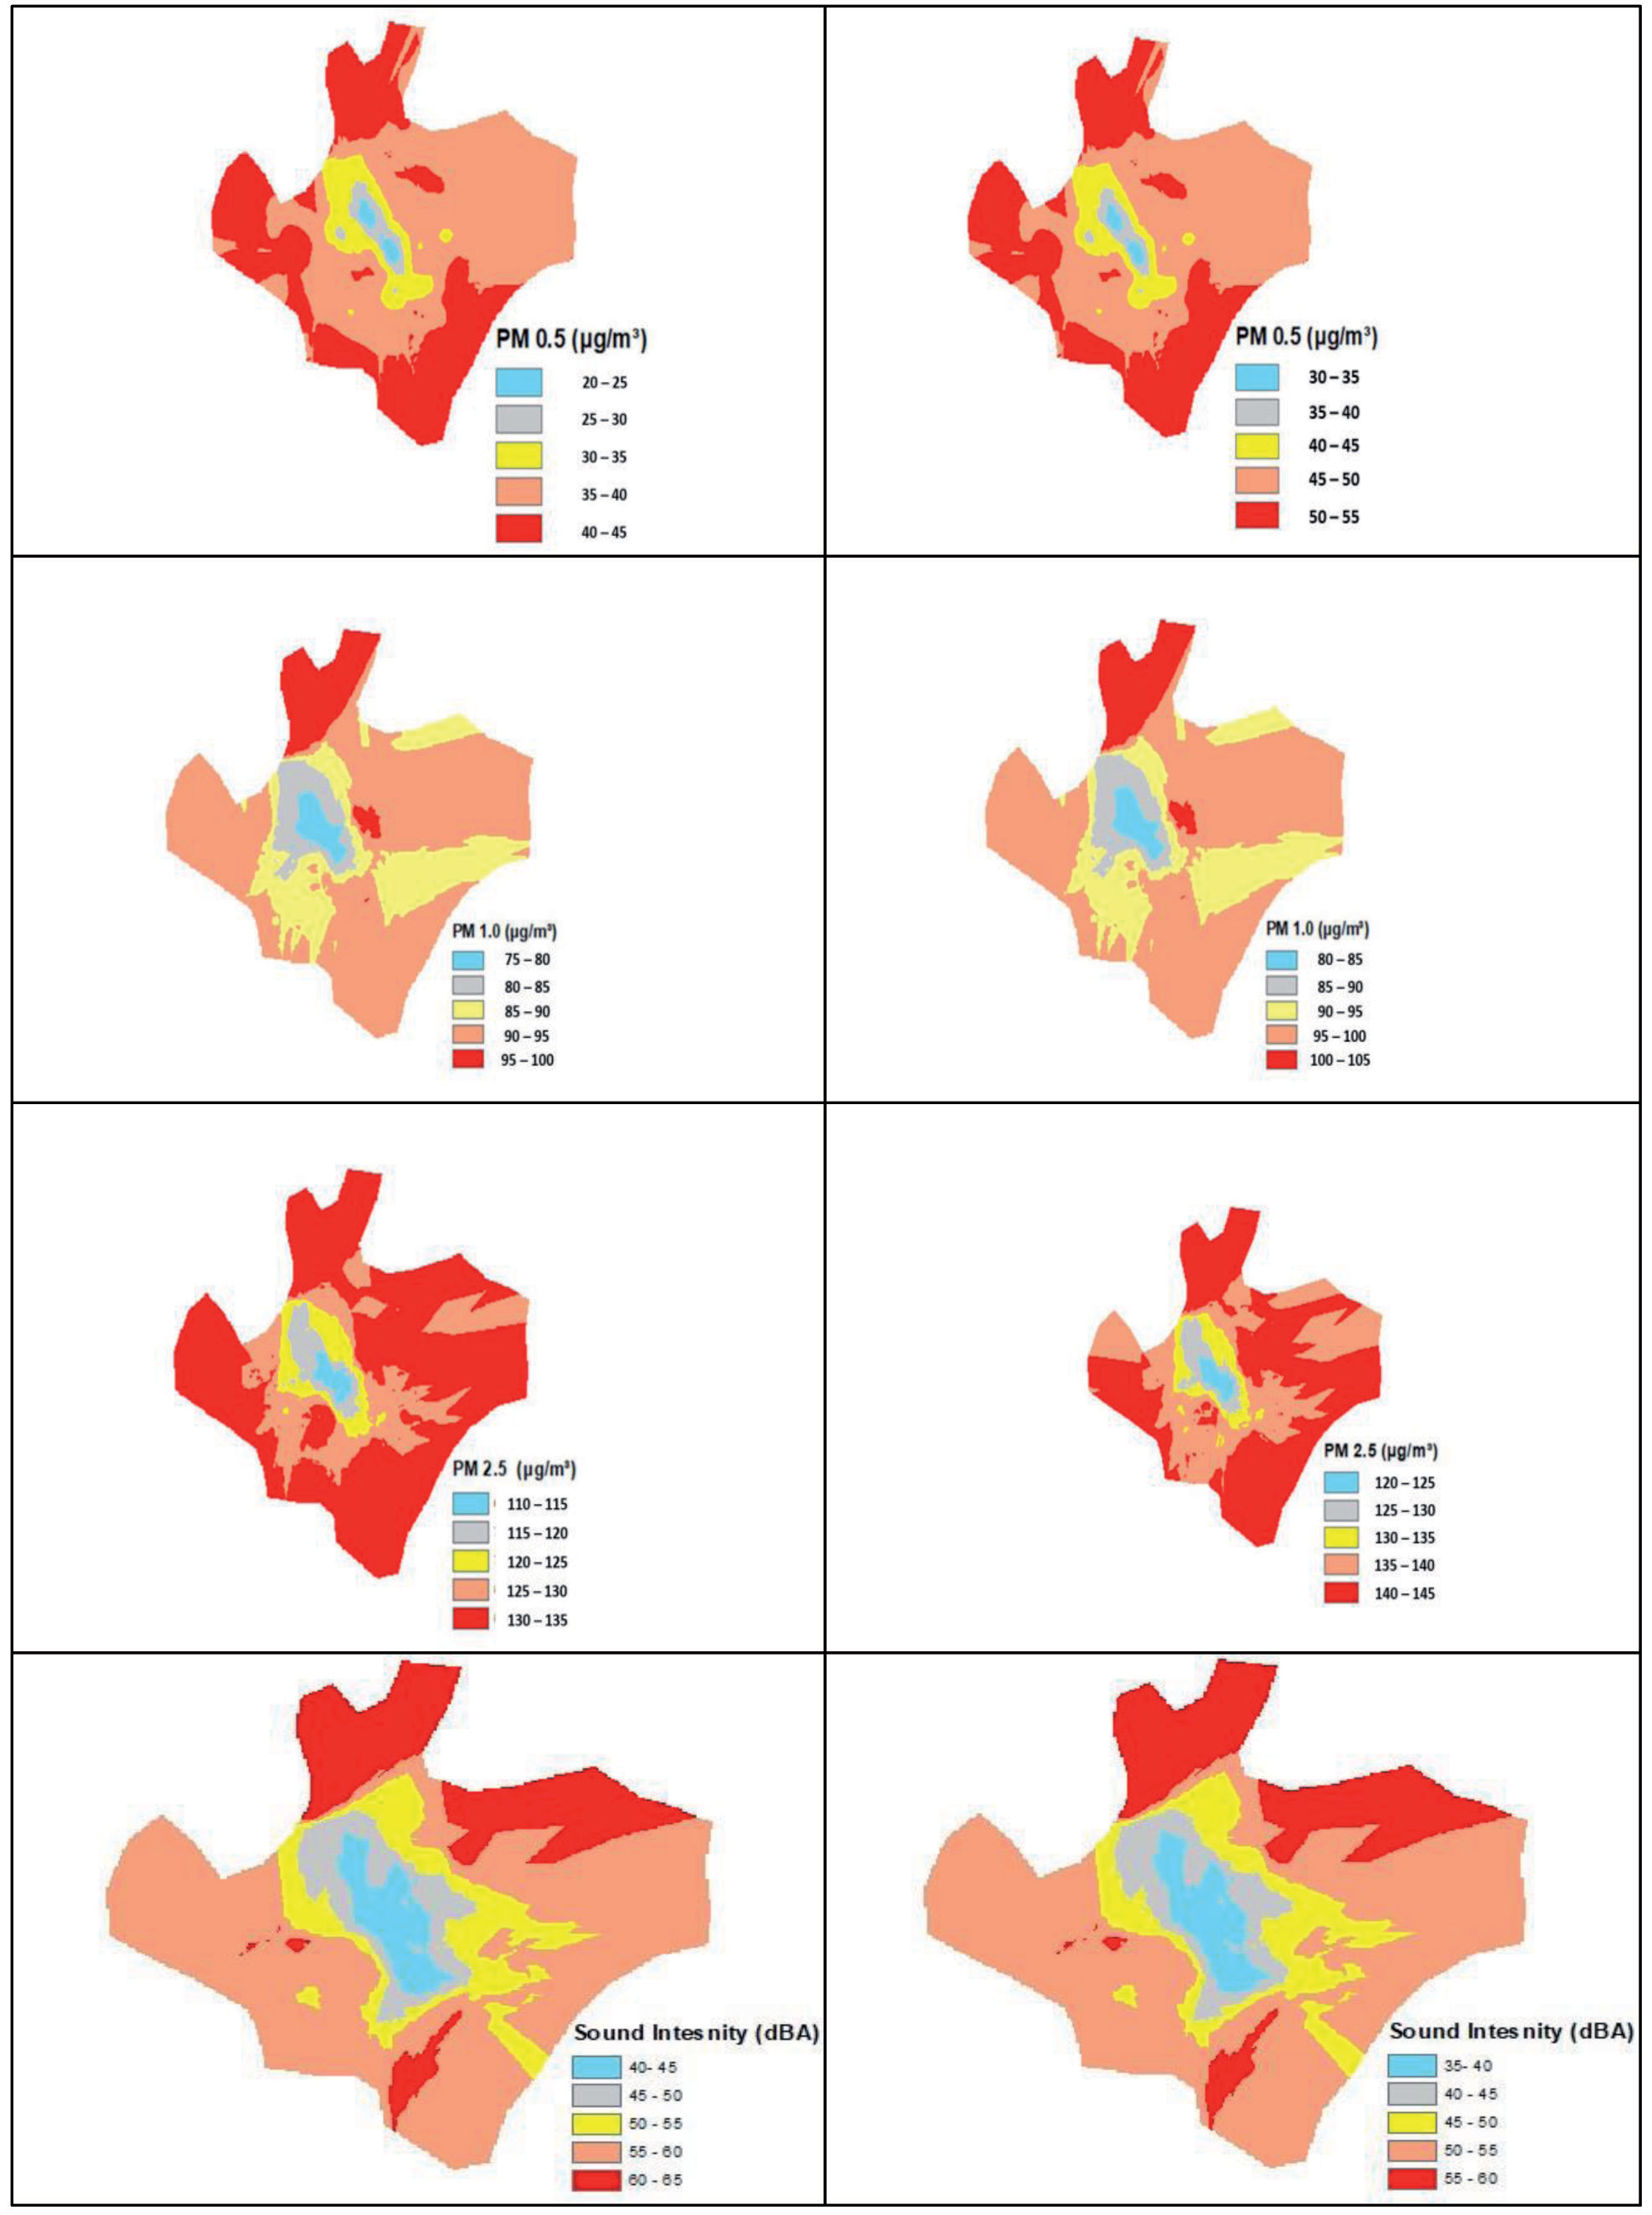
Fig. 3.
Fluctuation in air quality parameters such as CO2, CO, temperature, relative humidity, particulate matter, and sound intensity due to seasonal change and vegetation cover at different location sites of Faisalabad city.
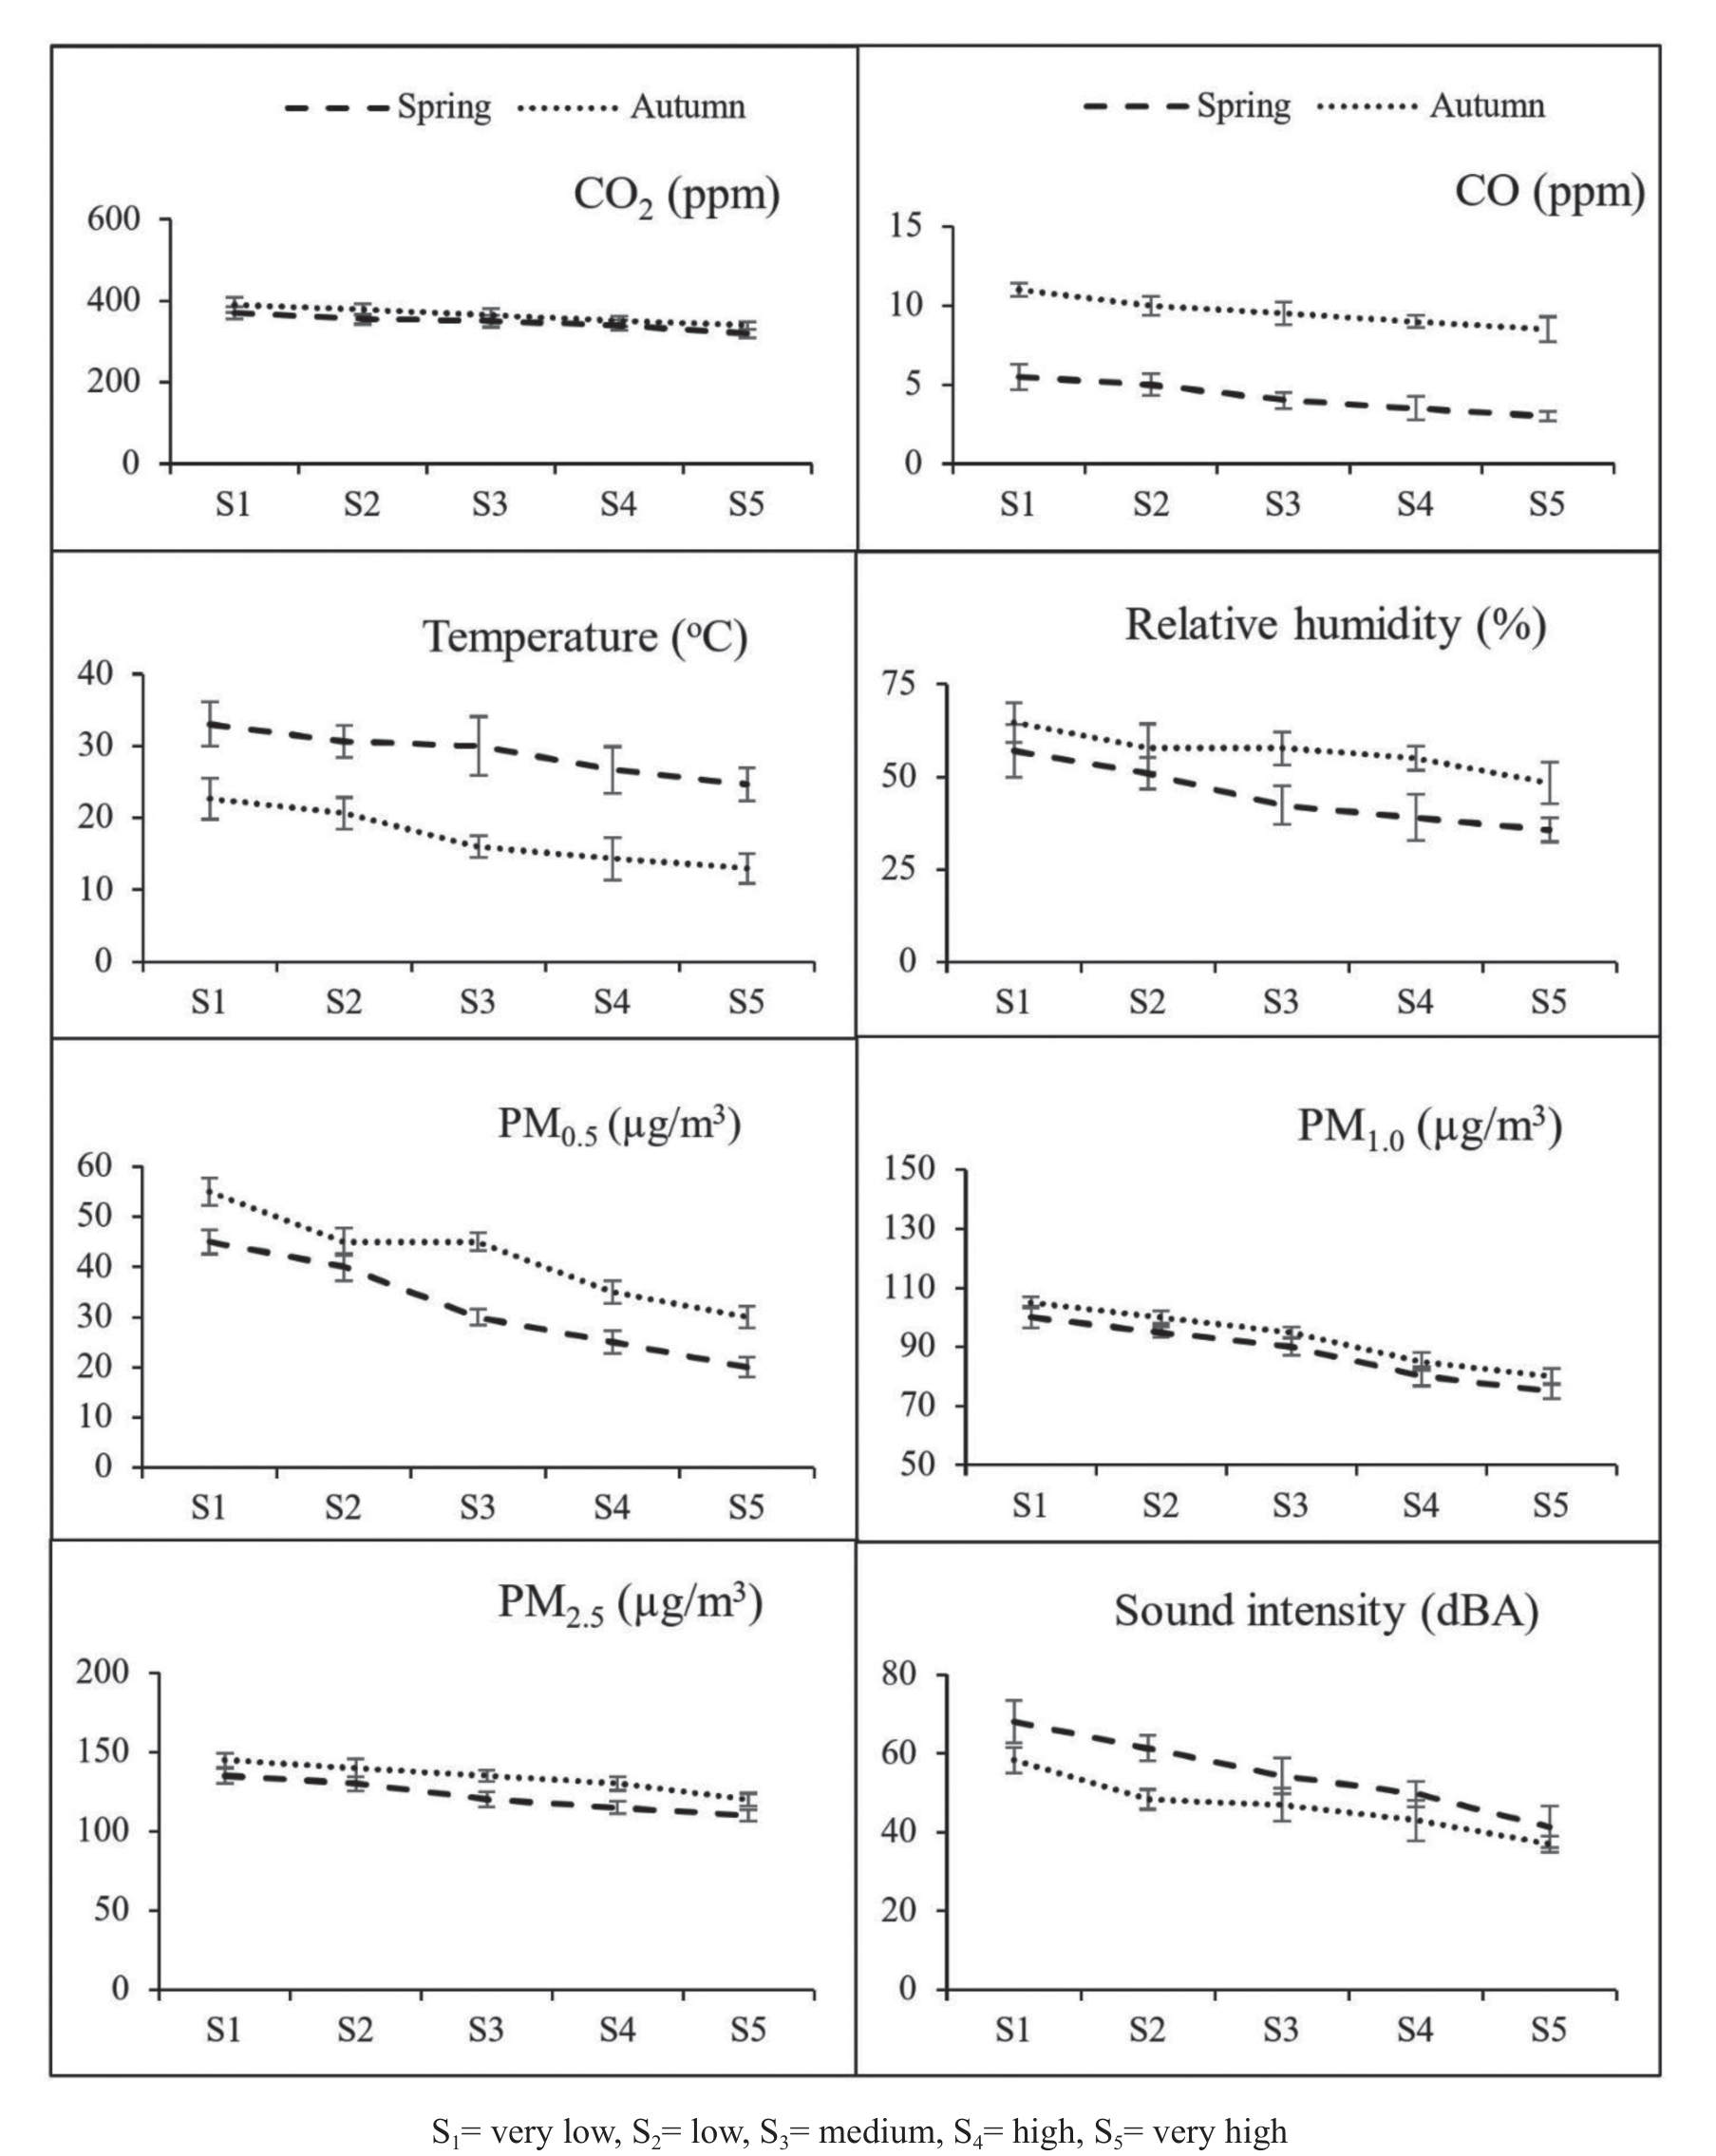
Particulate matter (PM) is a common proxy indicator for air pollution. There is strong evidence for the negative health impacts associated with exposure to this pollutant. The observed results showed that the PM0.5, PM1.0, and PM2.5 concentration was maximum in both seasons i.e., spring and autumn 45 and 55 µg/m3, 100 and 105 µg/ m3, 135 and 145 µg/m3 respectively at S1 as compared to other sites. In both seasons, a gradual decrease in PM0.5, PM1.0, and PM2.5 concentration was recorded from S1 to S5, and the minimum concentration of PM0.5, PM1.0, and PM2.5 was noted at 20 and 30 µg/m3, 75 and 80 µg/m3, 110 and 120 µg/m3, respectively at S5. Overall, PM0.5, PM1.0, and PM2.5 concentrations were higher in the autumn season as compared to spring. However, the pattern of a gradual decrease in PM0.5, PM1.0, and PM2.5 concentration was the same in both seasons. Noise is a form of air pollution that affects our quality of life, health, productivity, and general welfare. The observed result showed that the sound intensity was maximum 68 and 58.66 dB at S1 as compared to other selected sites in both seasons i.e., spring and autumn, respectively. The highest value of sound intensity was recorded at 68 dB at S1 during the spring season but the lowest value was recorded at 37 dB at S5 in the autumn season. However, the decreased ratio of sound intensity was the same in both seasons.
Discussion
It was observed from the findings of the current study that trees play a vital role in improving the overall climate of specific areas. The findings of the current study revealed that concentrations of pollutants and overall air quality are significantly affected by seasonal variations, as more pollutants were present in the spring season as compared to the autumn season. The results of the current study are in accordance with previous studies, as it is suggested that seasonal variations in the concentration of CO2 and CO in industrial and living areas can be influenced by a variety of factors. Industrial areas often exhibit higher levels of CO2 and CO due to the presence of manufacturing processes, power generation, and other industrial activities [31]. Seasonal variations in CO2 concentrations are primarily driven by fluctuations in energy demand and the types of fuels being burned [32]. For example, during colder months, the demand for heating increases, resulting in higher CO2 emissions from fossil fuel combustion [33].
However, some industrial areas may experience reduced activity and lower CO2 emissions during certain holidays or seasonal shutdowns [34]. Seasonal variations in CO concentrations in industrial areas may be contingent upon factors such as production schedules, maintenance activities, and emission control measures implemented by industries [35]. Variations in temperature throughout the seasons typically adhere to established climate patterns, with warmer temperatures in the summer months and colder in winter. However, the specific magnitude of these variations can be influenced by factors such as proximity to bodies of water, prevailing winds, and regional climate regimes [36]. RH in industrial areas can be influenced by both natural factors, such as humidity levels in the surrounding environment, and anthropogenic factors, including industrial emissions and water usage [37].
Seasonal variations in PM concentrations can be influenced by fluctuations in industrial activities, such as production schedules and maintenance shutdowns [38]. For example, increased energy demand during colder months may result in higher PM emissions from burning fossil fuels for heating purposes [39]. Nevertheless, the implementation of emission control technologies and regulations can also impact seasonal variations of PM in industrial areas. In industrial areas, sound levels can vary seasonally based on the types of industrial processes, machinery operation, and construction activities taking place [40]. Seasonal fluctuations in industrial production and operations can result in variations in noise emissions [41]. Furthermore, weather conditions, such as wind speed and atmospheric stability, can impact the propagation of sound waves, potentially altering sound levels in industrial areas [42].
In living areas, seasonal variations in CO2 and CO levels result from a combination of natural processes and human activities [43]. Typically, residential areas exhibit elevated CO2 and CO levels during winter months due to increased energy consumption for heating purposes [44]. Conversely, during the growing season (spring and summer), vegetation within living areas absorbs CO2 through photosynthesis, resulting in decreased concentrations of this greenhouse gas [45]. However, the impact of this natural cycle can vary depending on the presence of green spaces in urban areas [11]. Additionally, the use of fuel-burning appliances and wood burning for heating or cooking in certain regions can also result in higher CO concentrations during the colder months [46]. It is crucial to note that specific regional and local factors can significantly impact the precise patterns and magnitudes of seasonal variations in CO2 and CO levels in industrial and living areas. Residential areas can experience temperature variations based on factors like proximity to natural features, green spaces, and building materials [4].
Human activities such as heating, cooling, and ventilation practices can impact indoor RH levels, while outdoor RH is influenced by local climate patterns and vegetation [48]. The specific seasonal fluctuations in temperature and RH within living spaces can significantly differ based on geographic location, regional climate features, and unique microclimates within residential areas [49]. Additionally, seasonal variations in PM concentrations in living areas can be influenced by meteorological conditions, such as wind patterns and atmospheric stability, affecting the particle dispersion and accumulation [50]. The presence of vegetation and green spaces in residential areas also contributes to reducing PM levels through filtration and deposition processes [51]. In living areas, seasonal variations in sound can be influenced by a variety of factors, including human activities, transportation patterns, and changes in daily routines. For example, during the summer months, increased outdoor activities and recreational events can contribute to higher sound levels in residential areas [52]. Likewise, holiday seasons and celebrations might lead to temporary increases in sound levels in certain residential areas [53]. Environmental conditions, such as wind and temperature inversions, can also affect the transmission and perception of sound in living areas, potentially leading to seasonal variations [54].
In this study, we observed varying air quality among the five selected sites, with S1 exhibiting notably poor air quality that gradually improved across the other sites. Interestingly, S5, consisting of parks, displayed exceptionally high air quality. This enhancement can be attributed to the significant presence of trees, which play a pivotal role in ameliorating air quality, evident in S5 with its abundant tree population. Trees function as natural filters, actively absorbing pollutants from the air and releasing oxygen through photosynthesis [55]. To enhance the air quality of S1, it is recommended to increase tree planting in this area. Particularly in industrial zones, trees prove beneficial in mitigating the impacts of industrial emissions by effectively capturing and trapping airborne particles such as particulate matter and dust [56]. They also help reduce the levels of air pollutants, including NO2, SO2, and CO, through their foliage and root systems [40]. Moreover, trees provide shade, which can lower the ambient temperature and decrease the formation of ground-level O3, a harmful air pollutant [57]. In living areas, trees play a similar role in reducing air pollution from vehicular emissions, residential heating, and other sources [58]. They contribute to improved air quality and create a healthier and more pleasant living environment for residents. Furthermore, trees contribute to climate regulation through their cooling and shading effects [59]. The presence of trees in urban areas serves as a crucial mitigation strategy for the urban heat island effect, wherein cities endure higher temperatures than their surrounding rural areas [60]. The shade provided by trees diminishes the absorption of solar radiation, thereby decreasing ambient temperatures and subsequently reducing the demand for cooling energy [61]. This can also help decrease the formation of ground-level O3, a harmful air pollutant formed by the interaction of sunlight with pollutants [31]. By reducing temperatures and improving air quality, trees play a crucial role in creating a more comfortable and sustainable urban environment [62].
In summary, trees play a crucial role in maintenance and mitigation of climate change. They serve as natural air filters, absorbing CO2 and releasing oxygen through photosynthesis, thereby reducing greenhouse gas concentrations in the atmosphere. This pivotal function helps combat climate change by sequestering carbon and alleviating the impacts of increased CO2 emissions. Furthermore, trees contribute to climate regulation by providing shade, lowering temperatures, and mitigating the urban heat island effect. They also enhance air quality by capturing pollutants and curbing the formation of harmful substances such as ground-level O3 and particulate matter. The presence of trees in both industrial and residential areas is essential for fostering sustainable and resilient environments, enhancing air quality, and promoting a healthier climate for current and future generations.
Conclusions
The climate is undergoing changes due to various anthropogenic events, including the combustion of fossil fuels, industrialization, intensive agriculture, and deforestation. Over time, these heightened concentrations of atmospheric pollutants and ongoing temperature increases may disrupt ecosystems. Elevated levels of atmospheric pollutants pose a significant threat to overall health. Urban vegetation serves as an indicator of atmospheric quality, acting as a scout for pollutants. The air quality parameters such as PM0.5, PM1.0, PM2.5, CO, CO2, temperature, RH, and sound intensity were maximum in poorly vegetated areas in both seasons, while the minimum values were recorded for densely vegetated areas. Overall, the autumn season witnessed pollutants in higher concentration as compared to the spring season. This work can serve as an impetus to encourage further studies on trend analysis and regional aspects. It is anticipated that the current study will assist in consistently monitoring air quality, facilitating the implementation of appropriate measures to decrease ambient air pollutants and comply with emission regulations.

