

Introduction
Rapid development of international trade leads to the growth of CO2 emissions embodied in trade, which can be defined as the amount of carbon emissions produced by a country in international trade in order to meet the needs of other countries [1, 2]. Transfer of embodied CO2 from exporting country to importing country results in significant environmental pressures of different trading nations, particularly in export-oriented countries [3-5].
As the world’s fourth-largest CO2 emitter since 2010, Russia has approved a strategy for the country’s socio-economic development to lower greenhouse gas emissions by 2050. In this strategy, the government made an ambitious plan to reduce 80% of greenhouse gases by 2050 compared to 1990 and achieve carbon neutrality by 2060. Meanwhile, Russia’s export-related CO2 emission ranks second globally and accounts for 86% of the nation’s total emissions [6]. Therefore, to achieve the emission reduction target, it is necessary to explore related controlling measures to reduce embodied CO2 emissions in Russia’s exports.
The trade between Russia and China has rapidly expanded in recent years. According to UN Comtrade, and the General Administration of Customs of China, China has been the largest trading partner of Russia since 2010. The trade volume increased from 57.1 billion US dollars in 2010 to 107.8 billion US dollars in 2020, of which 64.5% was contributed by energy and chemical-related products. As stated in Russia’s Energy Strategy-2035, this volume will continue to increase since the Asia-Pacific region will be the most promising energy market in the near future. Nevertheless, the quantity, sectoral structure and driving force of embodied CO2 emissions in the Russia-China trade is still unclear, hindering the formulation of policies to reduce embodied CO2 emissions in Russia’s exports.
Previous studies have extensively considered the quantification and driving force analysis of CO2 emission embodied in trade [7-10]. For emission quantification of carbon emission embodied in trade, the multi-region input-output (MRIO) model was widely used in previous work to estimate the national and sectoral scale of CO2 emission embodied in trade [11-13]. For example, Peters and Weber concluded that export is the primary contributor of Chinas’ CO2 emissions, annually about 1700 Mt of CO2 emissions caused by exports [16]. Besides, Russia is the second-largest exporter of embodied emissions, the total volume increased from 474 MMT in 1995 to 793 MMT in 2008, and electricity, Gas and Water Supply are the largest emitter sector [14, 15]. In addition, Sánchez-Chóliz and Duarte indicated the sectors transport material, mining and energy, non-metallic industries, chemical and metals are the most relevant CO2 exporters, and other services, construction, transport material and food are the biggest CO2 importers in Spain [16]. Other scholars have focused on the responsibility of emission reduction in trade [17]. For instance, Meng et al. designed a new method based on input-output analysis to identify and distinguish self-responsibility and shared responsibility for CO2 emissions along global value chains, and they found that developing countries have undertaken more responsibility in emission reduction than developed countries since 2012 [18]. Embodied carbon in Russia’s trade was mainly exported to all trading partners. However, few were related to the bilateral trade, particularly the transfer of CO2 emissions in Russia-China trade from a sectoral perspective.
With regard to the driving forces analysis, scholars have found that many factors could lead to the increase in embodied CO2 emissions by using the structural decomposition analysis (SDA) mode [19, 20]. For example, Deng and Xu revealed that carbon intensity, trade scale, and structure effects can affect the changes in embodied carbon emissions in China, India, Japan, and the US, and the reduction of carbon emission intensity coefficient could effectively mitigate the embodied carbon emissions in exports [21]. For Russia, exporting CO2 emissions are principally from basic resource and energy sectors, and a fossil fuel endowment effect can lead to a specialization in “dirty” sectors and an increase in emissions per unit. Therefore, energy structure and trading effect play an important role in exporting embodied CO2 emissions [22, 23].
Based on MRIO, the transfer route of embodied emission among different countries can also be investigated. Previous studies have found that developing countries are generally net CO2 emissions exporters, whereas developed countries are generally net CO2 emissions importers. That is, more CO2 emissions are transferred from developed countries to developing countries [24, 25]. Furthermore, as the largest net exporter of embodied CO2 emissions, the transfer of embodied CO2 emissions between China and the USA, Japan, India, Germany, South Korea, and other countries is relatively active, and agriculture, mining, manufacturing, electricity, heat, gas, water production and supply, and transportation, storage, and postal services are the major sectors [26]. Besides, manufacturing of commodities in India that are exported to the UK generates 1.053 kilo-tonnes of CO2 emission per million dollars annually, while manufacturing of commodities in the UK that are exported to India generates only 0.141 kilo-tonnes of CO2 emission per million dollars annually [27]. In addition, the US-Japan trade transfers carbon emissions from the US to Japan, which reduced the embodied carbon emissions of the US by 14.6 Mt, whereas Japan increased the embodied carbon emissions by 6.7 Mt [28]. Considering the carbon terms of trade (CTT) indicator is irrelevant to the volume of exports and imports, and appears more appropriate as a long-run structural indicator, Wang and Xue introduced the CTT to measure the relative scale of CO2 emissions caused by China-India trade, indicating that carbon emissions transfer from India to China [29].
Based on the existing literature, there was still a lack of analysis of studies that considered embodied CO2 emissions in the Russia–China trade at the country and sector levels. Besides, most of the literature has focused on the difference between emissions embodied in exports and imports, while the balance of embodied carbon emissions measure is subject to trade imbalance, which may disappear or reverse over time [30]. Consequently, it is unstable for a long-run analysis.
To this end, this paper tries to construct an environmental extended multi-region input-output (MRIO) model to measure the CO2 emissions embodied Russia-China trade at country and sector level. The carbon terms of trade (CTT) index will be calculated to examine whether sectors’ exports to China cause environmental degradation, and identify which sectors’ exports to China cause more environmental degradation. Then, the structure decomposition analysis (SDA) model is used to evaluate the factors that may cause environmental degradation. The marginal contributions of this study include: (1) To the authors’ knowledge, this is the first study that quantify the CO2 emissions embodied in the Russia-China trade at the country and sector levels. (2) The study further identifies sector contributors to the increase in embodied CO2 emissions are identified as well as the relevant driving forces to formulate the evidence-based polices.
The rest of this paper is arranged as follows. In section 2, we introduce material and methods. Section 3 presents the results and discussion of analyzing embodied CO2 emissions in the Russia-China trade and the driving forces. Finally, section 4 provides the conclusion and policy implications.
Material and Methods
Model Construction
Environmental Extended Multiregional Input-Output Model (EE-MRIO)
According to the statement of the noncompetitive input-output table, the MRIO model can distinguish between different flows of goods traded and show a relatively complete industrial chain between different countries and sectors. Based on this, the relationship between the final demand and total output of n countries could be expressed as follows:
where Xir is the monetary value of total output of sector i in region r; xijrs is the monetary value of products produced from sector i in region r and consumed as intermediate input of sector j in region s, whereas yirs represents the monetary value of products produced from sector i in region r and used as final demand in region s.
Equation (1) can be rewritten using matrix form as follows:
where A is the direct consumption coefficient matrix of intermediate goods produced domestically, and its element aij = Xij/Xj indicates that the department j needs to directly consume the quantity product in the department i to produce one unit product. (I – A)–1 is Leontief’s inverse matrix that captures the direct and indirect requirement in the supply chain of goods used as final demand. Using this model to calculate CO2 emissions, let C be the vector of direct CO2 emission coefficient, and its elements represent the direct CO2 emissions per unit output of the sector; then the complete CO2 emissions to meet the final use Y can be expressed as follows:
Based on the above model, for bilateral trade between Russia and China, the embodied CO2 emission in export and import, respectively, can be represented as follows:
Among them, Cr and Cc are the direct carbon emission coefficients for Russia and China, respectively. Ar and Ac are the direct consumption coefficient matrix of intermediate goods produced by Russia and China, and EX and IM are the vectors of Russia’s sectoral exports to and imports from China. The EXC and IMC are the embodied CO2 emissions in Russia’s export and import, respectively. Therefore, the net embodied CO2 emissions in the Russia-China trade (NCEr) can be calculated as Eq. (6). A positive NCEr value implies that Russia is a net exporter of CO2 emission in Russia-China trade. Otherwise, it is a net importer of CO2 emission.
CO2 Emission Transfer in Russia-China Trade
In the Russia-China trade, the status quo of CO2 emission transfer in different sectors, along with its changing trend forms the basis for formulating carbon emission reduction policies. For this purpose, CO2 emission transfer analysis is essential.
Antweiler [31] proposed the pollution terms of trade, which aims to identify the environmental gains or losses a country sustains from engaging in international trade. Based on this, the CTT can be measured by the ratio of embodied CO2 emissions in per unit of export and per unit of import (see Eq. (7)). Let Russia’s CTT be formulated as follows:
where Yex and Yim are the monetary value of products of Russia’ s export to and import from China, respectively. When EXC, Yex, and IMC, Yim are the embodied CO2 emissions at the country level, CTTr is the value of Russia-China at the country level. When EXC, Yex, and IMC, Yim are the embodied CO2 emissions at the sector level, CTTr is the value of Russia–China at the sector level. The value of CTTr at the country and sector levels has similar meanings. When CTTr>1, it indicates that Russia may be responsible for a significant quantity of CO2 emissions because of exports to China. That is to say, exports may lead to the deterioration of Russia’s carbon emissions. When CTTr <1, it indicates that China may be responsible for a significant quantity of CO2 emissions owing to exports to Russia. Imports may lead to deterioration of China’s carbon emissions.
Structure Decomposition Analysis Model of CTTr
Leontief’s inverse matrix can be rewritten as follows:
Therefore, Equation (4) and (5) used for calculation of embodied CO2emissions in trade can also be rewritten as follows:
Additionally, EX and IM can be rewritten as follows:
Where Sex denotes the vector of export structure from Russia to China, i.e., the proportion of different sectors’ export amount in the totals. Sim denotes the vector of import structure from China to Russia, i.e., the proportion of different sectors’ import amount in the totals.
By substituting formula (12) and (13) into formula (10) and (11) respectively, EMC and IMC can be rewritten as follows:
By substituting formula (14) and (15) into formula (7), the CTTr can be rewritten as follows:
First, by using the SDA model to decompose ΔCTTr in the base period [32, 3], the following formula can be obtained:
(17)
Second, by using the SDA model to decompose ΔCTTr in the calculation period, the following formula can be obtained:
(18)
Considering the average of formulas (17) and (18), the SDA model of the change in CTTr can be obtained as follows:
(19)
Formula (19) shows that the ΔCTTr can be decomposed into six effects: Russia’s carbon emission intensity, Russia’s production intermediate input, Russia’s export structure, China’s carbon emission intensity, China’s production intermediate input, and China’s export structure effects. In this study, as we focus on the embodied CO2 emissions of Russia’s exports, only three effects of Russia will be calculated and analyzed. When Cr and Cc are row vectors, the values of these effects are calculated at the country level. When Cr and Cc are diagonalizing matrices and the export structure is the proportion of a particular sector’s exports to total exports, the values of these effects are calculated at the sector level. The carbon emission intensity effect reflects the demand for energy for economic growth. The intermediate input effect reflects the production technology and manner of organizing, the export structure effect reflects the proportion of sectoral exports to total exports, and the export structure of a single sector is the scale of exports.
Data Source and Processing
The MRIO tables referenced in this study were obtained from the World Input-Output Database (WIOD) 2016 release, which contains noncompetitive input-output tables from 2000 to 2014 and related satellite accounts including CO2 emissions.
Additionally, the Russia-China bilateral trade data were sourced from the international supply and use tables, which were considered to construct the WIOD [34]. These data are based on official and publicly available data from statistical institutes; they can ensure a high level of data quality and coordinate with the sectors in the world input–output tables. Simultaneously, the industries in world input–output tables, CO2 emissions, and the international supply and use tables are merged to form 32 sectors, which are represented in Appendix A. Moreover, data were deflated by using the GO-P index to remove the interference of various prices between 2000 and 2014.
Results and Discussion
Embodied CO2 Emissions in Russia-China Trade
at the Country Level
Fig. 1 shows the scale and trend of Russia’s exports to China from 2000 to 2014. The figure also highlights the impact of Russia’s exports to China on Russia’s CO2 emissions. Russia’s exports to China revealed significant growth over the study period, from 100.22 million dollars in 2000 to 201.92 million dollars in 2014. Energy exports occupy the core position of Russia’s exports in the long term and are considered as the main driving force for Russia’s economic growth. Energy exports from Russia to China have steadily increased since the end of the Asian financial crisis in 1998, declining only because of the 2008 financial crisis. Exports grew as the economy recovered until economic sanctions triggered by the Ukraine crisis in 2014 blocked Russia’s exports again. Embodied CO2 emissions in Russia’s exports to China demonstrated an overall downward trend during this period, rapidly declining from 1405.03 Mt in 2000 to 513.37 Mt in 2007 and gradually declining to 500.61 Mt in 2014. From 2000 to 2007, the increase in the value of Russia’s exports to China was accompanied by a decline in the embodied CO2 emissions in Russia’s exports to China. This demonstrates Russia has benefited economically from its trade with China while successfully avoiding an increase in domestic CO2 emissions. Thus, Russia has not sacrificed environmental benefits in exchange for economic benefits during this period. Following the transition crisis, since 1999, the Russian economy has started to recover, and the utilization of idle production capacity will not initially lead to high energy consumption. Moreover, a series of relevant laws and regulations have also played a key role in reducing carbon emissions [35]. These regulations include the 1994 Federal Energy Strategy, the 1996 Federal Law on Energy Conservation, the 1998 Federal Program on Energy Conservation, and the 1998 Additional Measures to Encourage Energy Conservation. Additionally, energy exports account for a significant percentage, and the low-carbon energy measures help control carbon emissions.
However, from 2007 to 2014, the increase in the value of Russia’s exports to China was accompanied by an increase in the embodied CO2 emissions in Russia’s exports to China. In particular, Fig. 2 shows the scale and trends of Russia’s net exports to China and the net embodied CO2 emissions in exports from 2000 to 2014. From 2007 to 2014, Russia experienced a trade surplus with China. During this period, Russia was considered a CO2 emission surplus country, which is consistent with previous studies [36]. From 2007 to 2014, Russia exchanged economic interests at the expense of environmental interests and gradually became a net embodied CO2 emitter in Russia-China trade.
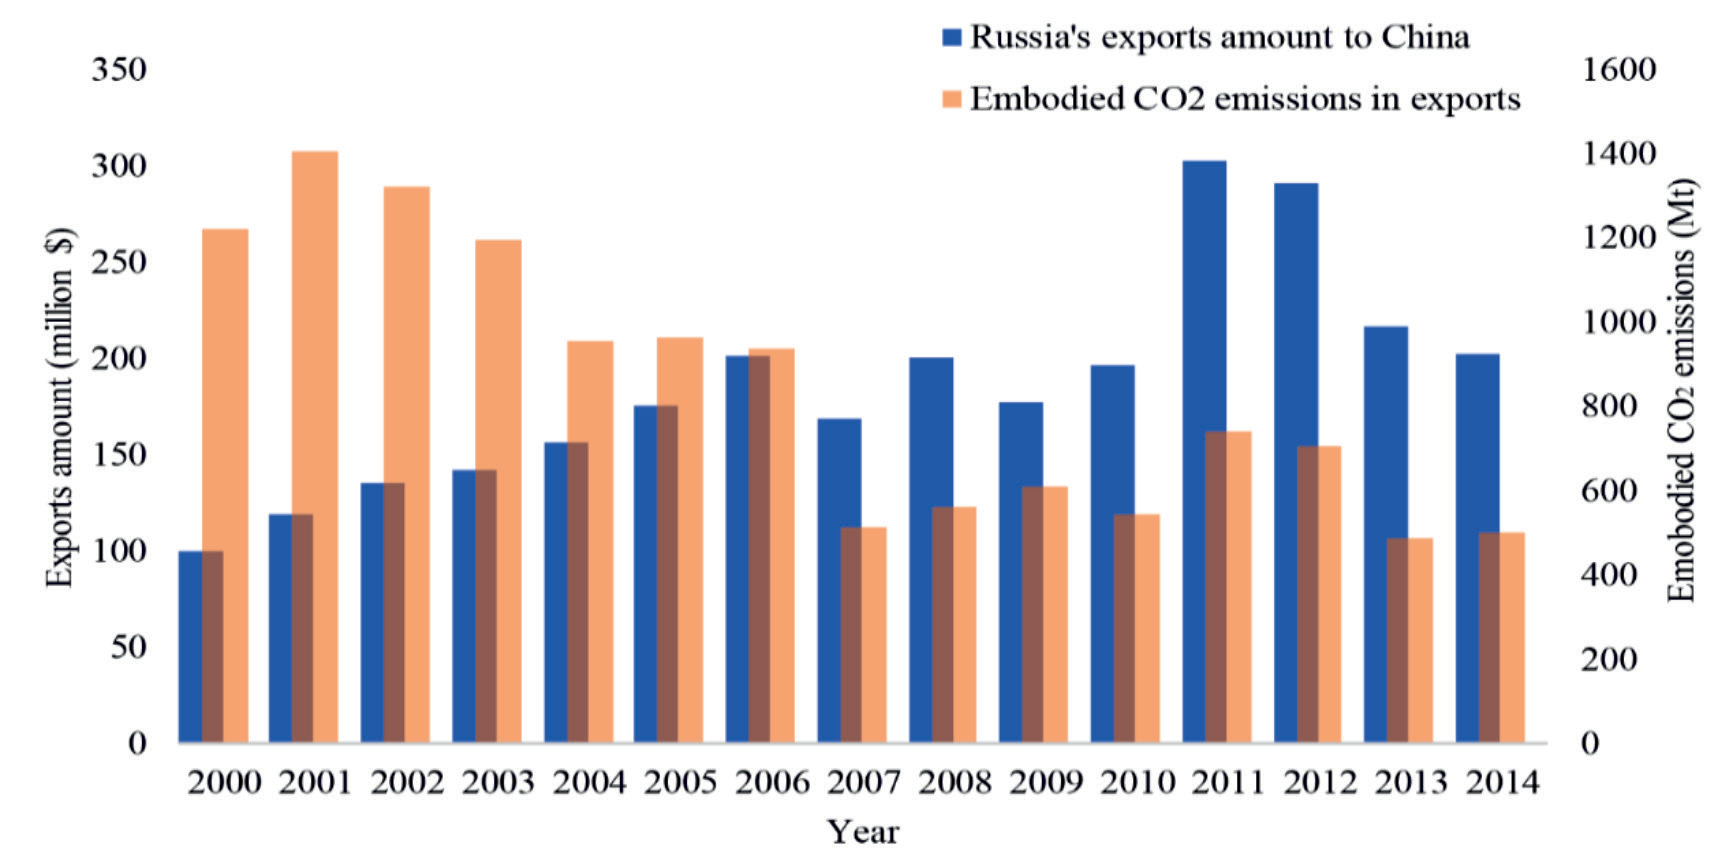
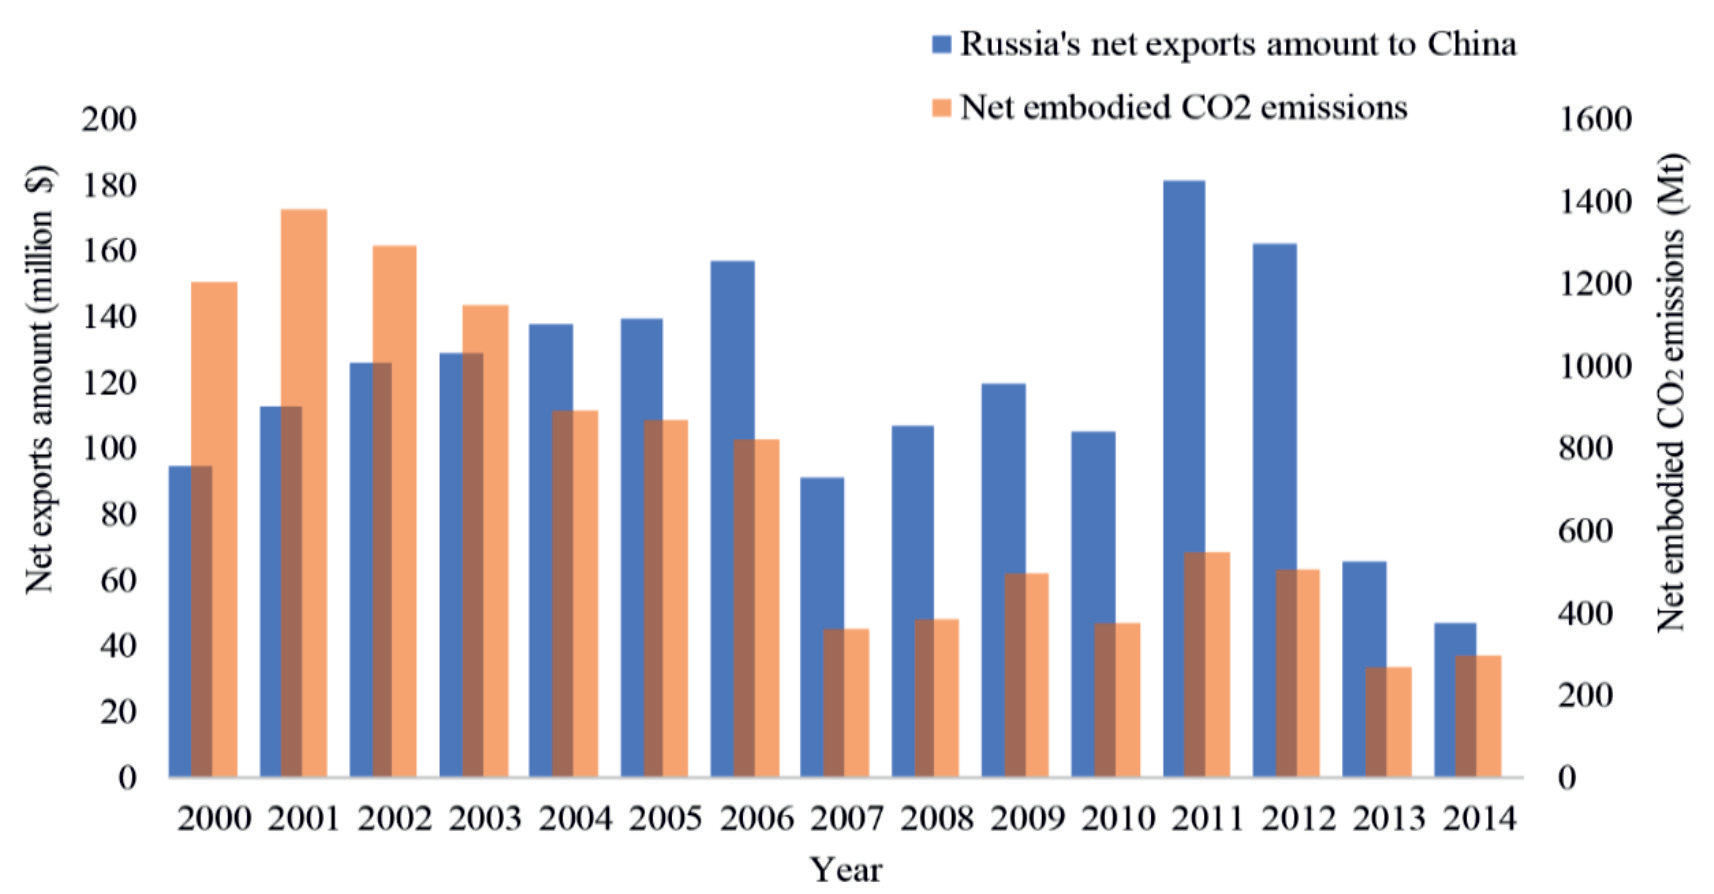
Fig. 3 shows the carbon intensity of Russia’s export in the Russia-China trade and Russia’s CTT (CTTr). Russia’s carbon intensity of export shows a downward trend over the study period, indicating that the overall energy input has been declining in per unit exports. However, the rate of decline has slowed since 2010. The CTTr describes the relative value of carbon coefficient efficiency of Russia’s exports and imports. During the study period, the CTTr was reported to be consistently greater than 1 (also shown in Table 1). Moreover, Fig. 3 also shows the embodied CO2 emission per unit product exported by Russia is higher than the embodied CO2 emission per unit product exported by China (imported by Russia), thus indicating that CTTr are generally not conducive to Russia’s carbon emission reduction. However, the continuous decline of the CTTr shows that the situation is constantly improving. We noticed that since 2013, the CTTr has shown an upward trend, indicating that the embodied CO2 emissions per unit of Russian exports have started to increase, primarily with the increase in Russia’s exports to China in recent years. The improvement of the CTTr has entered a bottleneck period. Therefore, it is necessary to examine this changing trend to achieve the expected goal of controlling carbon emissions.
Embodied CO2 Emissions in the Russia-China
Trade at the Sector Level
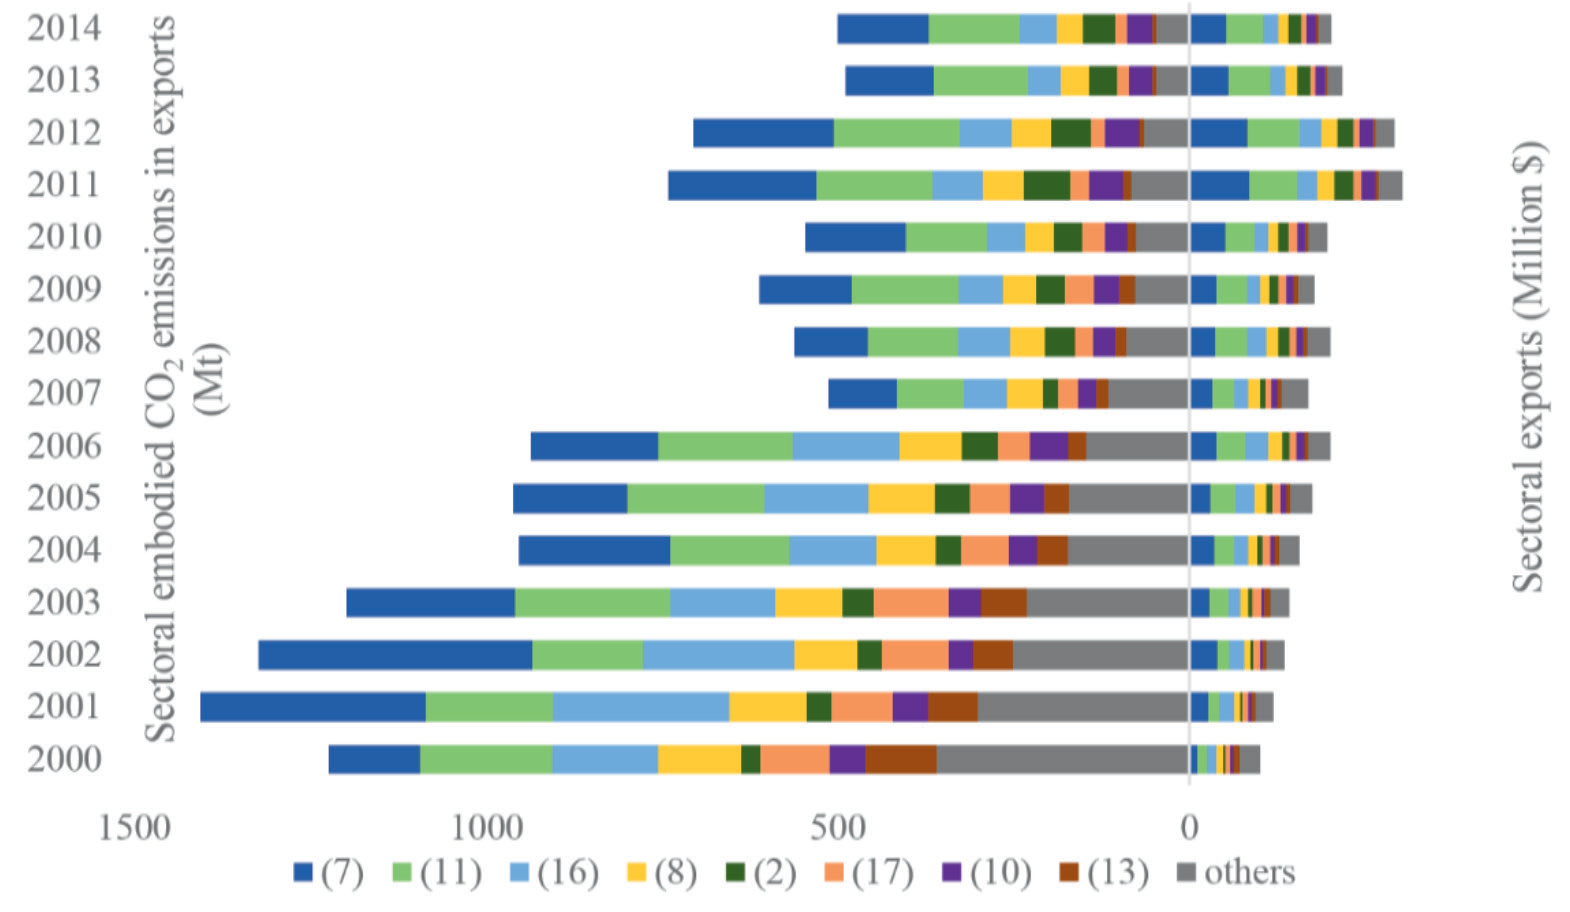
Fig. 4 shows eight sectors with the largest export embodied CO2 emissions in Russia and their export value (the CO2 emissions and export value of the remaining 24 sectors are combined as other). Refer to Appendix B for data on embodied CO2 emissions from exports for all sectors. Fig. 4 presents two distinct features. First, among these eight sectors, the vast majority of exports embodied CO2 emissions come from the energy sector (7, 11, 16, 8, 2), which is not only Russia’s resource endowment but also consistent with Russia’s single export structure to China. Thus, this research discusses these five sectors. Second, the export volume of these five sectors reveals an increasing trend while their export embodied CO2 emissions show an evident change process of first decreasing and then increasing. Before 2007, exports of these five sectors generated several economic benefits for Russia without increasing the domestic CO2 emission burden. After 2007, the increase in the export volume of the five sectors was accompanied by different trends in the embodied CO2 emissions of exports, indicating that the carbon emission intensity of these five sectors differed. For increasing export, different sectors have different energy consumption inputs. Embodied CO2 emissions in exports of the mining and quarrying (2) sector increased from 27.75 in 2000 to 45.07 Mt, and the growth rate was 62.41%. Besides, embodied CO2 emissions in exports of the coke and refined petroleum products manufacturing (7) sector increased from 128.85 Mt in 2000 to 129.84 Mt in 2014 after repeated fluctuations; this sector also witnessed growth. Before 2007, the transformation of the energy structure led to a certain decrease in energy intensity. However, post 2007, the energy intensity has remained relatively fixed, which has led to an increase in energy consumption and contributed to a large amount of CO2 emissions from the production processes of these sectors [37, 38]. Conversely, embodied CO2 emissions in exports of the electricity and gas (16) sector decreased significantly, from 150.45 Mt in 2000 to 52.54 Mt in 2014, and the decline rate was 65.08%. Renewable energy is being supported by the Russian government in this sector. Renewable energy mainly includes wind energy, solar energy, and hydropower. Green electricity reduces CO2 emissions by 53,000 tons and reduces nitrogen oxide emissions by 110 tons [39]. Embodied CO2 emissions of chemical products manufacturing (8) also experienced a significant decline, from 117.29 Mt in 2000 to 36.89 Mt in 2014, and the decline rate was 68.55%. Besides, the embodied CO2 emissions of manufacture of basic metals (11) decreased from 189.03 Mt in 2000 to 130.32 Mt in 2014, and the decline rate was 31.06%. These two sectors mainly include several energy-intensive companies that are in the center of a relatively complete supply chain and have certain competitive advantages. The primary goal of these sectors is to reduce energy consumption costs. Although reducing CO2 emissions is not their main goal, the pursuit of energy conservation has objectively led to a substantial reduction in CO2 emissions [40].
Fig. 3.
Carbon intensity of export and CTT (the ratio of carbon intensity of export of Russia and China) in the Russia-China trade.
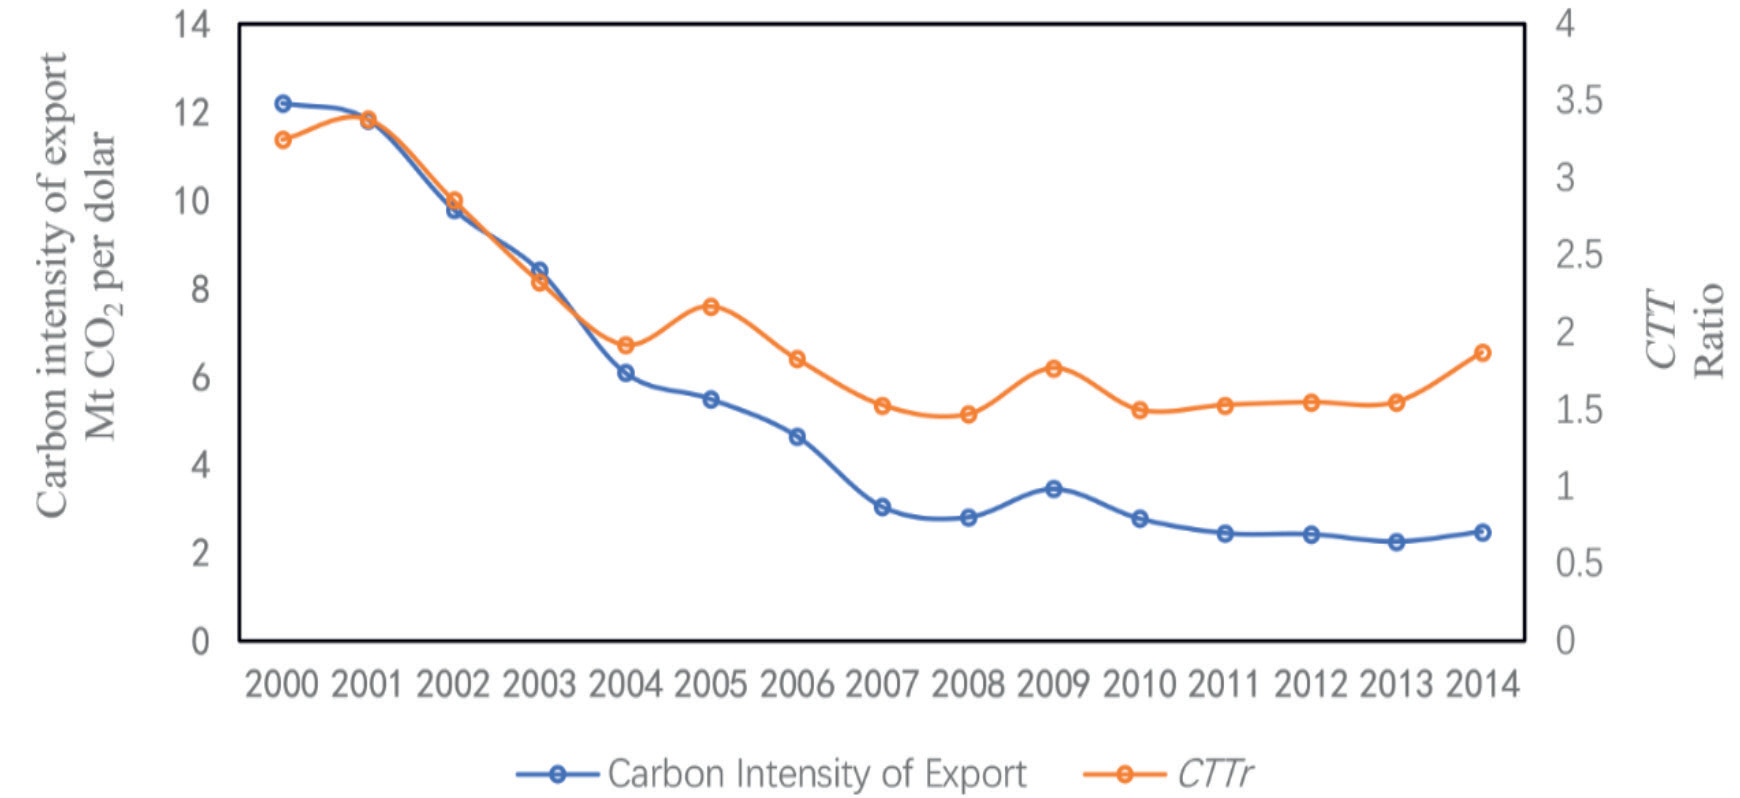
Fig. 5 shows the export carbon intensity and CTT for five sectors with the largest export CO2 emissions (CTTr). The export carbon intensity for the five sectors showed a downward trend over the study period, indicating that their energy input use was declining in per unit exports. However, the relative export and import carbon intensity values differ for various sectors. The CTTr for the manufacture of coke and refined petroleum products (7) among them was the highest from 2004 to 2014 (1.81 on average, see Table 1), indicating its unfavorable performance. This sector has caused the most serious deterioration of Russia’s trade environment. The CTTr of mining and quarrying (2) followed closely with an average value of 1.48 from 2004 to 2014.
Fig. 4.
Sectoral structure of exports and embodied CO2 emissions in exports (2) Mining and quarrying, (7) Manufacture of coke and refined petroleum products, (8) Manufacture of chemical products, (10) Manufacture of other nonmetallic mineral products, (11) Manufacture of basic metals, (13) Manufacture of machinery and equipment, (16) Electricity and gas, and (17) Construction.
Compared with the above two sectors, the export carbon intensity for the electricity and gas (16) and the manufacture of chemical products (8) sectors is lower than the import carbon intensity. The average CTTr values from 2004 to 2014 for these two sectors were 0.87 and 0.77, respectively, indicating that the CTTr in these two sectors were more conducive to improving Russia’s trade environment than that of other sectors. Additionally, the export carbon intensity for the manufacture of basic metals (11) sector is generally consistent with the import carbon intensity. Its average CTTr value from 2004 to 2014 was 1. If the scale of imports and exports of the manufacture of basic metals (11) sector can maintain the balance, this sector will not cause a deterioration of the Russian trade environment. Sectoral analysis reveals that the CO2 emission reduction pressure in Russia is primarily generated by the manufacture of coke and refined petroleum products (7) and the mining and quarrying (2) sectors. Reducing embodied CO2 emissions in exports from these two sectors initially requires determining the reasons for the deterioration of CTTr. The CTTr for electricity and gas (16), the manufacture of chemical products (8), and the manufacture of basic metals (11) are conducive to improving the trade environment. However, it is also necessary to recognize the drivers of embodied CO2 emissions in the exports of these three sectors to avoid deterioration in their CTTr.
Decomposition of Embodied CO2 Emission in the Russia-China Trade
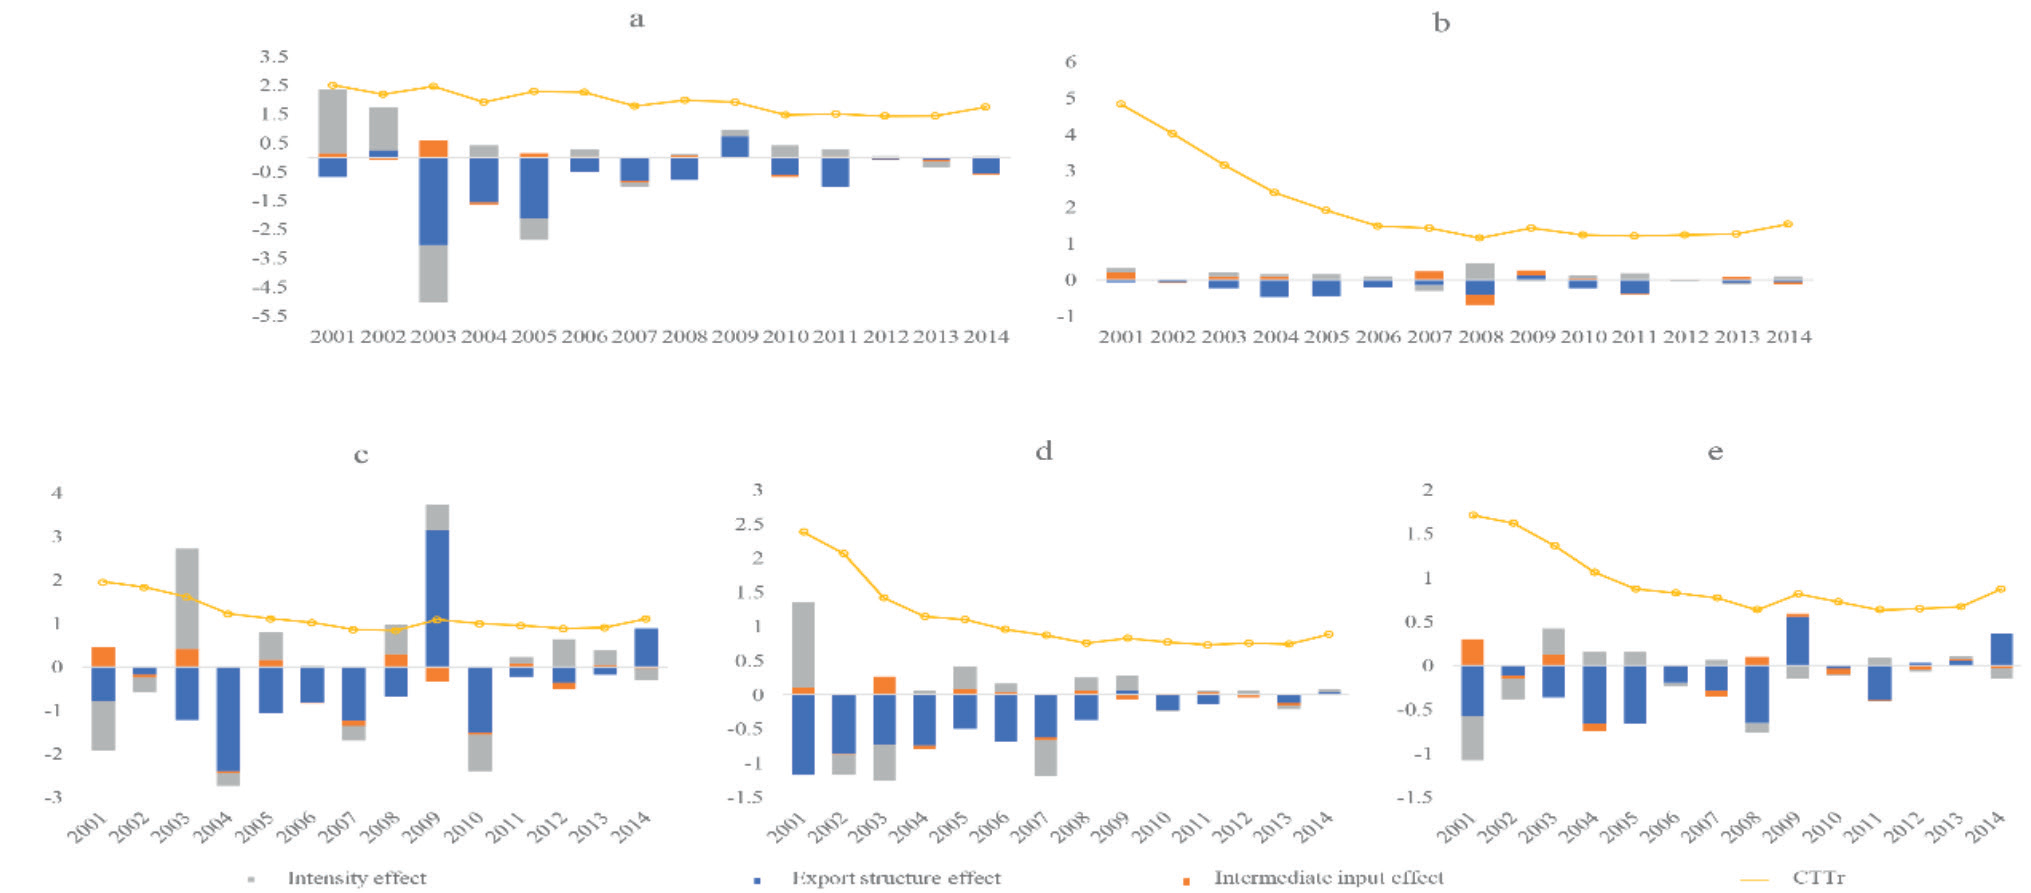
Table 2 shows the results of the decomposition of the overall CTT in the Russia-China trade. Russia’s carbon emission intensity effect was negative, with a total numerical value of −2.36, which indicates that it has played a positive role in curbing the deterioration of the CTT between Russia and China. Russia’s intermediate input effect was also negative but its numerical value of −0.07 was too low to have any noticeable effect on the improvement of CTT. It indicates that the production of intermediate products in Russia’s exports is inefficient and consumes high energy. The development of related technology was limited during this period. Additionally, Russia’s export structure effect was positive and its total numerical value was 0.12, indicating that high-carbon products comprised a significant proportion of Russia’s exports to China, thereby exacerbating the deterioration of the environment in Russia. In conclusion, the carbon emission intensity effect does not completely offset the export structure effect. However, to further explore the influencing effect of the sectors with the largest embodied CO2 emissions in exports, this study further decomposed the CTTr changes in the top five sectors, thereby hoping to propose corresponding carbon emission reduction policies for different influencing factors.
The decomposition results of changes in the embodied CO2 emissions of exports for five sectors are presented in Appendix C. Fig. 6 shows the effect decomposition of CTTr changes. Regarding the intermediate input effect, the absolute value in manufacture of coke and refined petroleum products sector (7) was small during this period (Fig. 6a), which demonstrates that production techniques do not reduce CO2 emissions effectively [41]. As for the intensity effect, its numerical value was negative for most of this period while the absolute value consistently decreased, thereby indicating that the intensity effect plays a key role in energy conservation and emission reduction. However, its strength gradually weakened [42], indicating that this sector’s demand for energy production cannot continue to decline and offset the increase in embodied CO2 emissions caused by increasing exports. For example, from 2013 to 2014, the absolute value of the intensity effect has increased, but the increase in exports may still lead to deterioration of the environment. Therefore, the export structure effect is dominant in reducing CO2 emissions if the other two effects are insufficient. The change trend for its three effects of the mining and quarrying sector (2) is similar to that of the manufacture of coke and refined petroleum products (7) (Fig. 6b). The strength of the intensity effect and intermediate input effect has gradually weakened. It is increasingly evident that increased exports led to the increase in embodied CO2 emissions. Since China joined the World Trade Organization (WTO) in 2001, China’s rapid economic growth has led to a continuous increase in the demand for energy. Most of the energy is mainly derived from Russia’s exports. This has resulted in large amounts of continuous energy input in the production of these two sectors, which gradually exceeded the rate of technological update and led to an increase in embodied CO2 emissions from exports. For the manufacture of basic metals sector (11) (Fig. 6c), its intermediate input effect has been negative since 2010, which has played an active role in reducing CO2 emissions; however, the effect is limited. Export structure effect of this sector has little impact on increasing CO2 emissions. For example, the proportion of exports in 2012 and 2013 was larger than that in 2014, but the CTTr in these two years was smaller than that in 2014. The intensity effect’s numerical value was negative during most of this period and became positive in 2014. Although the CTT in 2014 did not significantly worsen the trade environment (CTTr = 1.11), the Russian government should be concerned about its possible negative impact on CO2 emissions. With regard to the electricity and gas sector (16) and the manufacture of chemical products sector (8) (Fig. 6d and 6e), whether positive or negative, few changes have occurred in the intermediate input effect since 2010. Thus, the effect is limited in improving the CTTr. The export structure effect may not exacerbate the environmental deterioration in recent years. For example, the export structure effect of manufacturing chemical products (8) was 0.04 in 2013 while its CTT was 0.67. The export structure effect of electricity and gas was 0.06 in 2012 while its CTT was 0.88. Both were lower than 1 and neither contributed to the deterioration of the trade environment. In other words, there is still a possibility for increase in the proportion of exports if the other factors remain unchanged. Although the CTT in 2014 did not significantly deteriorate the trade environment, the intensity effect of both these sectors became positive in 2014 (CTTr was 0.88 and 0.87, respectively). However, the Russian government should be concerned about the probable negative impact on CO2 emissions. The production and export to China in the above three sectors (manufacture of basic metals, electricity and gas, manufacture of chemical products) also require a large amount of energy input; however, the intensity effect was mostly negative before 2014. The reduction in CO2 emissions per unit of output reflects the reduction in energy demand and the adjustment of the energy structure. For example, in the electricity and gas (16) sector, Russia has continuously provided policy support to promote the replacement of polluting energy with clean energy, including the growth of the nuclear and renewable energy power plants, increased proportion of natural gas in thermal power plants, and development of hydropower plants [43]. Additionally, compared to mineral resources, exports from these sectors were limited. Thus, it did not lead to a substantial increase in embodied CO2 emissions in exports.
Fig. 5.
Carbon intensity of export and CTTr in sectoral trade. a) Mining and quarrying (2), b) Manufacture of chemical products (8), c) Manufacture of basic metals (11), d) Manufacture of coke and refined petroleum products (7), and e) Electricity and gas (16).
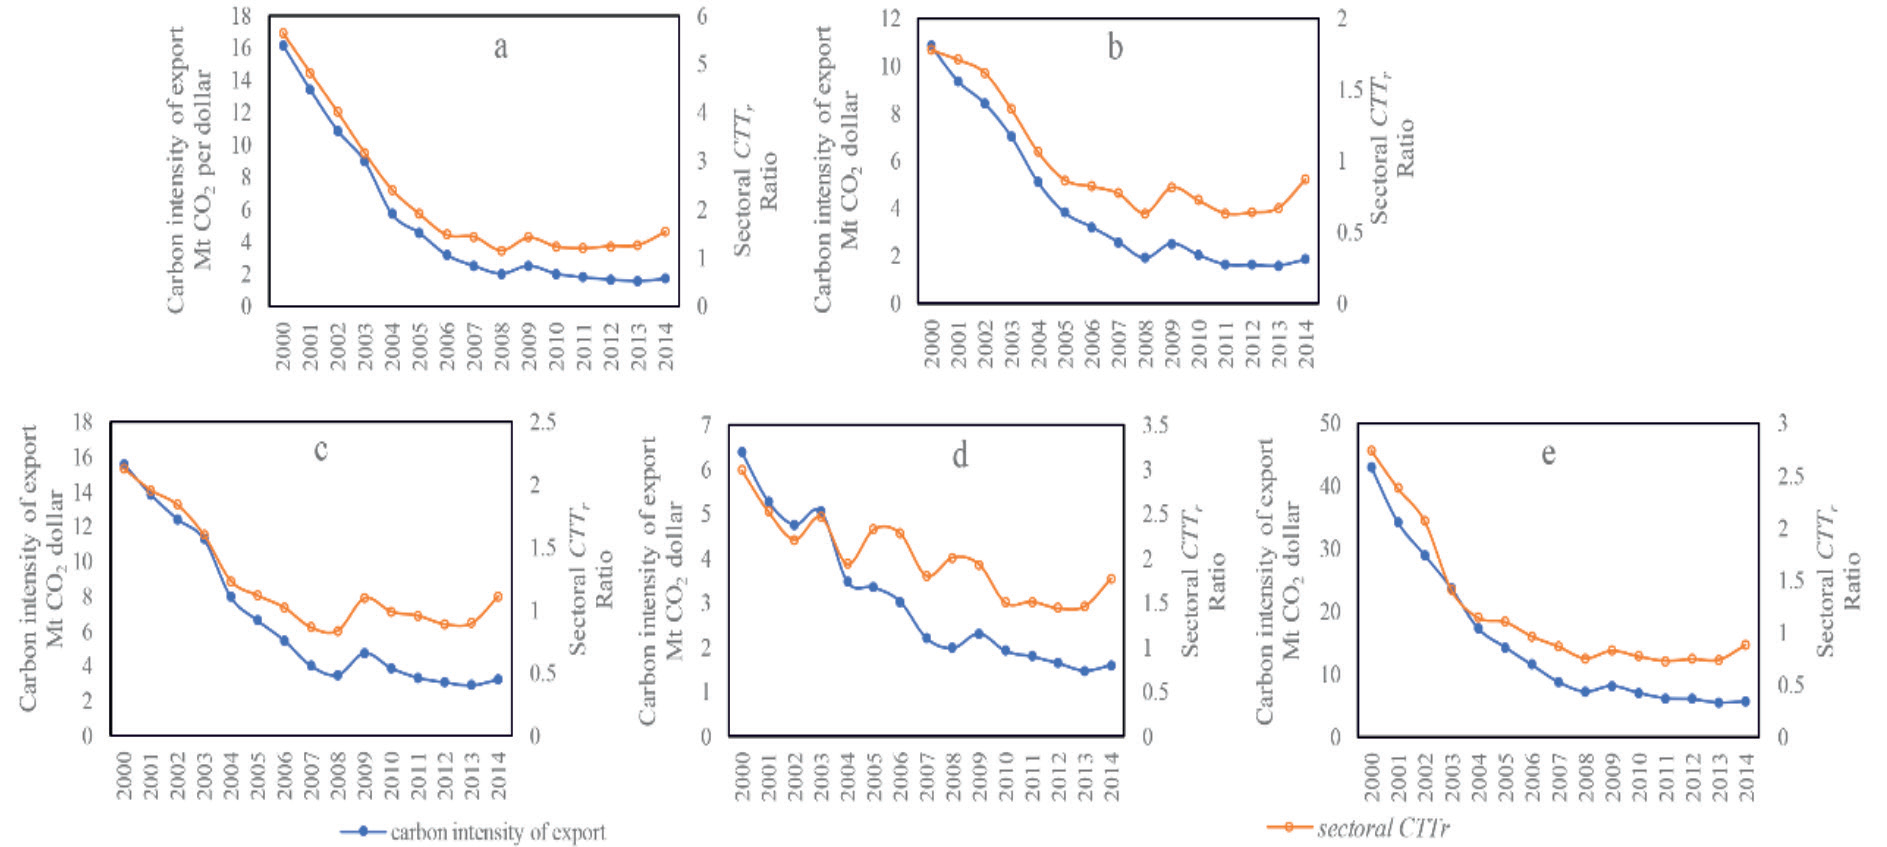
Table 1.
CTTr of Russia-China at the country and sector levels.
Table 2.
CTTr of Russia-China and the effect decomposition.
Conclusions and Policy Implications
Conclusions
In this study, an MRIO model was applied to measure embodied CO2 emissions in the Russia-China trade at the country and sector levels from 2000 to 2014. Moreover, a structure decomposition analysis model was used to measure the driving forces of the change in embodied CO2 emissions at the country and sector levels. The main findings are as follows:
First, at the country level, since 2007, Russia has been both a net exporter of embodied CO2 emissions and a net exporter in the trade between Russia and China. While exports boost economic growth, they also increase environmental costs. Since 2014, Russia’s net embodied CO2 in exports has shown an upward trend. It is foreseeable that this trend may not significantly change as China’s import demand for Russia’s energy increases. Additionally, the overall CTT between Russia and China shows that Russia’s exports to China bring additional embodied CO2 emissions. The higher the scale of Russia’s exports, the more serious to the detriment of Russia’s CO2 emissions.
Second, at the sector level, most of the embodied CO2 emissions in exports come from the energy sector. However, since 2007, although the scale of exports from these sectors has increased in varying degrees, embodied CO2 emissions in exports have shown the opposite trend. Among them, the mining and quarrying sector witnessed the highest increase in embodied CO2 emissions in exports, whereas the manufacture of chemical products sector witnessed the highest decline in embodied CO2 emissions in exports. Additionally, as shown in the sectoral CTT, CTT for the manufacture of coke and refined petroleum products and mining and quarrying sectors were greater than 1, indicating that exports from these two sectors will exacerbate the deterioration of the trade environment. The CTT for the electricity and gas, manufacture of chemical products, and manufacture of basic metals sectors were less than 1, indicating that the exports from these sectors do not worsen the trade environment.
Third, the results of structural decomposition indicate that the main reason for the increase in embodied CO2 emissions in Russia’s exports to China is the increase in the scale of exports. That is, China’s economic growth increases the import demand for Russia’s energy. Although the intensity effect has played a key role in restraining the increase in embodied CO2 emissions in exports, its role varies depending on the sector. It plays a small role in the manufacture of coke and refined petroleum products and mining and quarrying sectors and a relatively large role in the electricity and gas, manufacture of chemical products, and manufacture of basic metals sectors. However, reducing embodied CO2 emissions in exports by reducing the scale of energy sectors’ exports to China will inevitably lead to a slowdown in Russia’s economic growth.
Policy Implications
Our results shed light on the directions on the formulation of policies and measures to mitigate CO2 emission embodied in Russia-China trade.
First, at the country level, Russia’s future reduction policy should consider the relationship between CO2 emissions and industrial structure. Embodied CO2 emissions in exports are largely determined by the industrial structure in Russia. The government should promote the transformation of the economic and industrial structure, by increasing the share of low-energy-consuming industries and reducing the share of traditional industries. With the decarbonization of the global economy and the energy transition, Russia must gradually mitigate its high dependence on energy exports, and shift to the path of clean and low-carbon industrial development. Afterward, Russia should participate actively in the international trade, which are supposed to coordinate environmental costs and economic benefits, particularly for its future industrial upgrading.
Second, in the bilateral trade, embodied CO2 emissions can be controlled through the cooperation between importers and exporters [44]. Specifically, Russia will still be the significant energy and resource exporters in present and future. To control the CO2 emission embodied in energy exports, the cost of embodied CO2 emissions can be internalized through energy pricing. That is to say, the responsibility of embodied CO2 emissions can be transferred directly to the consumption side by internalizing carbon costs via products and services pricing in the Russia-China trade. Additionally, the cooperation can be extended to the technology exchange. Advanced technology from those consumption countries that are more developed can be imported to exchange the exports from less-developed countries. Higher level of technique in China can be used in the manufacture of coke and refined petroleum products, and mining and quarrying sectors of Russia, which can also improve energy efficiency and reduce CO2 emissions embodied.
Third, although the carbon intensity decreased in studying sectors, the increase in the scale of exports to China will offset the intensity effect in reducing embodied CO2 emissions. Carbon emission intensity can be reduced by adjusting the energy structure in the exporting sectors. The decreasing consumption of coal, increasing consumption of natural gas, nuclear energy, and other renewable energy has already been observed over this period [45]. Russian government should encourage the development of combined cycle, nuclear and renewable electricity generation to meet the growing demand for electricity while minimizing the use of coal-fired energy. For the long run, enhancing the development of renewable energy to make the energy structure cleaner is necessary for maintaining increasing export scale and controlling CO2 emission. Furthermore, improving the technology of intermediate processing to obtain higher energy efficiency is important for CO2 emission reduction. To be specific, Russian government can encourage the development of energy transformation technologies (e.g. coal washing, petroleum refining, and power generation) by providing financial subsidies and tax incentives.

