

Introduction
A healthy wetland water environment has the potential to provide significant health benefits to urban environments and the residents living in close proximity [1]. By regulating the water ecosystem and enhancing the landscape of wetland parks, it contributes to improving the overall quality of life for residents. According to the World Urbanisation Prospects 2018 report [2], it is projected that by 2050, the global urban population will reach 68% of the total population, with China's urban population estimated to reach 1.086 billion. As urban populations continue to rise, the demand for limited blue and green spaces within cities increases, often encroaching upon valuable wetland resources. The ecological quality of wetlands directly impacts the well-being and comfort of wetland residents, and it plays a crucial role in determining the overall ecological health of these areas. Therefore, it is imperative to recognize that the ecological environment quality of wetlands directly influences the psychological and physiological health of residents to a considerable extent. By prioritizing the preservation and enhancement of wetland ecosystems, we can positively impact the health and well-being of individuals residing in these areas [3].
The assessment of wetland water environments encompasses numerous factors. However, the current research landscape lacks a comprehensive technical system for evaluating the water environmental quality of wetlands in the Yellow River region. Most domestic and international studies focusing on assessing the water environmental quality and health services of wetlands suffer from methodological limitations, often narrowly focusing on single elements. Countries such as Brazil and Japan have adopted the Biological Integrity Index (IBI) assessment method for wetland ecological monitoring and biological health assessment [4, 5]. Additionally, Ulrich's psychological evolutionary model, stress reduction theory, and ecological restoration theory provide valuable insights into the role and mechanisms of the natural environment in alleviating psychological stress from various perspectives [6, 7]. These theories collectively suggest that the natural environment plays a significant role in reducing the psychological stress experienced by individuals living within it. While existing studies primarily aim to establish the relationship between the water environment and biological health, they often employ singular research indices. Consequently, there remains a dearth of in-depth research on realizing the synergistic benefits of the water environment and human psychophysiological health services [8]. Therefore, it is crucial to explore the synergistic relationship between the water environment and health services in wetland parks characterized by a certain scale, complete water ecosystems, and a strong experiential element for residents.
Paying attention to the health service functions of wetland parks is an inherent requirement for realizing the "people-centered" development ideology. Wetland parks possess a pristine natural ecological environment that captivates people [9]. These parks serve as frequented locations where residents engage in daily recreational activities, thus playing a crucial role in providing important health services. To effectively guide the planning and construction of marshland parks, it is essential to consider multiple service demands and perspectives while aiming to enhance their ecological quality and comprehensive service functions [10]. This necessitates a shift from singular to synergistic assessment of the water environment service functions within marshland parks. Through a scientific evaluation of the ecological quality of the water environment and the health service function of wetland parks, this study explores the spatial-level synergy between these two aspects. Building upon these findings, a synergistic water environment and health service evaluation system is proposed. Based on the study's results, an optimization strategy for wetland parks is recommended, emphasizing the scientific construction of wetland parks with integrated health service functions [11].
Experimental
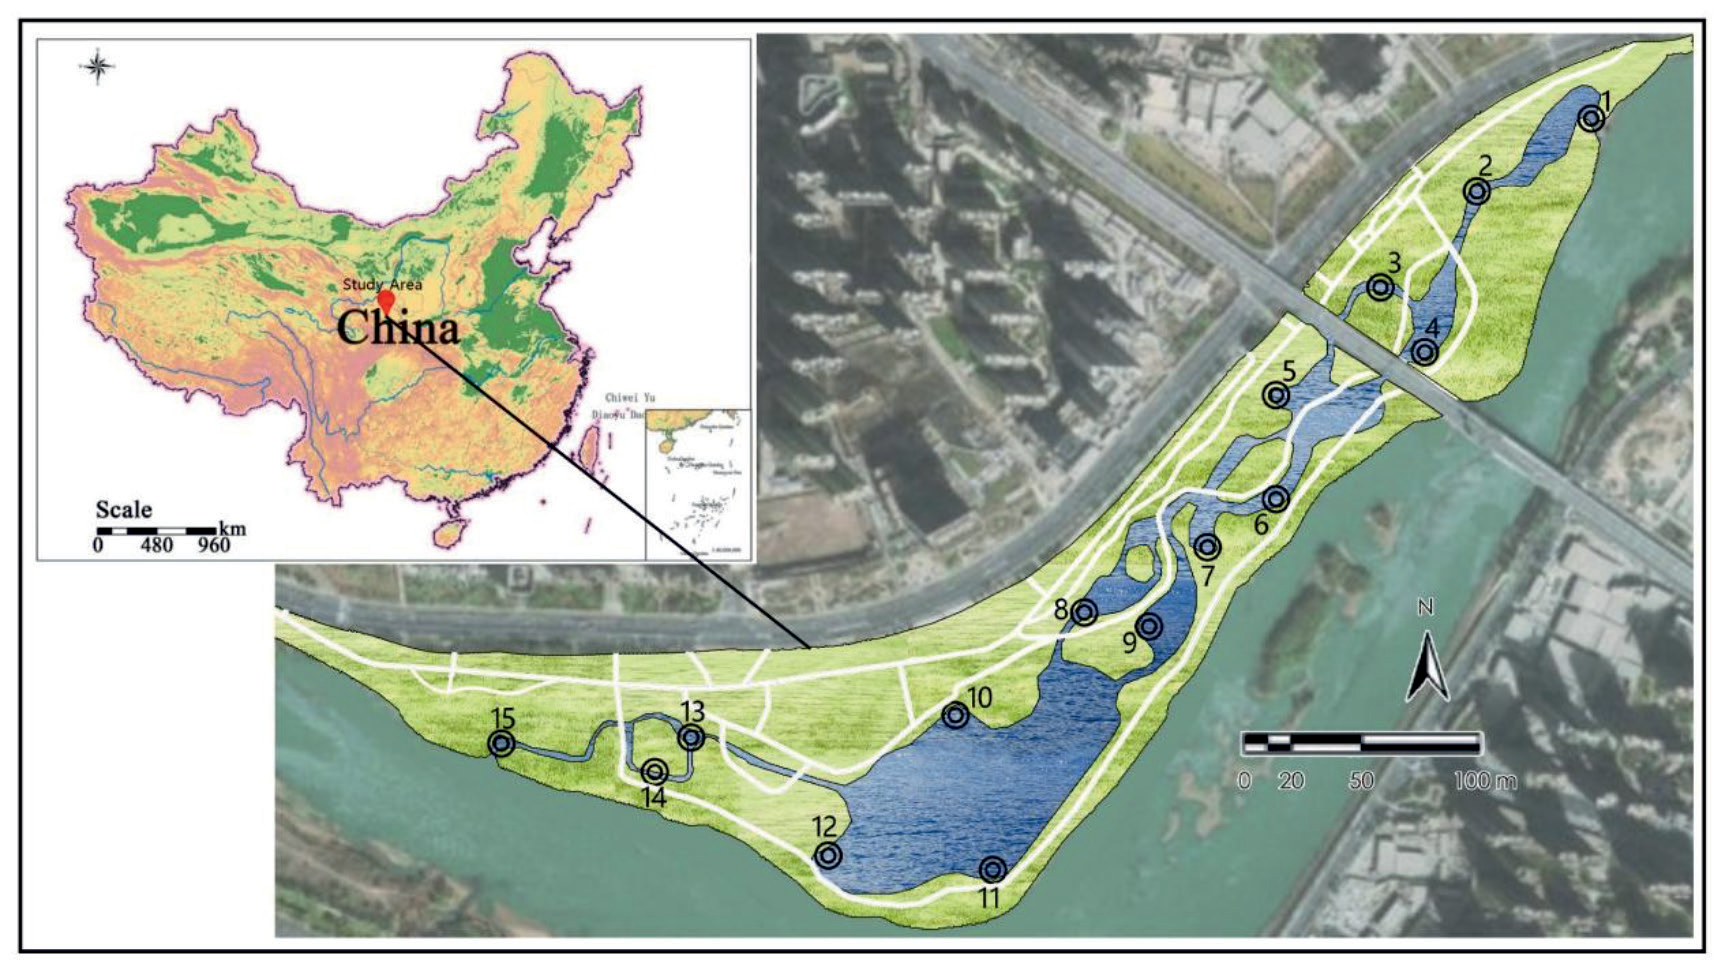
Yintan Wetland Park is located in the Yintan section of the Yellow River on the North Binhe Road in Lanzhou City, China, covering an area of thirty-two hectares and about three kilometers long. The site has a large variation of east-west trend and is about ten meters wide at its narrowest point. The wetland is a mudflat wetland formed by the sediment deposition carried by the turning of the Yellow River, which is an inland wetland of the Yellow River. Lanzhou has a temperate continental monsoon climate with four distinct seasons, the summer is hot, the winter is cold and dry, and the spring and autumn are relatively short, so it is vital to create a comfortable environment and healthy service functions inside the park.
Research Methodology
Data Source
To carry out this research, the data required include the data obtained from field monitoring of the site, as well as the data obtained from evaluating the recreation services [12, 13]. Among them, the field survey of the wetland park, the water system in Yintan Wetland Park for multiple point method, selected 15 points with obvious characteristics of the water environment and a high degree of gathering of visitors, (Fig. 1) with these 15 base points for water quality, habitat and aquatic life monitoring. The health service quality evaluation data included the park questionnaire data collected through field surveys, and the health service satisfaction evaluation was obtained from all the evaluation data of Yintan Wetland Park from the popular review website using crawler technology [14] (Table 1).
Evaluation Parameters of the Park Water Environment Quality Calculation
To create a scientific and universally applicable evaluation system for the water environment quality in the park, specific water quality parameters were selected based on their relevance to the biological habitat environment [15, 16]. These parameters include oxygen demand, dissolved oxygen, ammonia nitrogen, phosphorus, and nitrogen [17]. Habitat parameters were selected with factors related to the barge plant growth environment (river shape, river composition, river substrate, barge stability, barge vegetation type, plant cover, water velocity, water volume to calculate the habitat composite index), and finally the biological IBI index was calculated by the amount and species of phytoplankton in the wetland water body to build a scientific, universal and simple evaluation system of the park water environment quality [18].
Parameters of Water Quality
Water quality evaluation indexes include ammonia nitrogen, phosphorus amount, nitrogen amount, construct a multi-factor index evaluation model, and determine the weight of each index by entropy weighting method. Referring to the "surface water environmental quality standard: GB 3838-2002" basic items standard setting value comparison. For the Yellow River wetland water body, surface water class III was used as the water quality evaluation fixed value comparison [19, 20].
In which Q is a comprehensive index of water quality; Ii is the ith water quality index, Ii = Pi/Ui, where Pi is the ith water quality test concentration, mg/L; Ui is the ith water quality is the evaluation standard, mg/L; Ki is the ith pollutant specific gravity plant; n is the evaluation of the number of water quality indicators.
Habitat Parameters
Studies conducted in Germany and Finland have revealed a strong correlation between habitat indicators and wetland channel morphology and structure [21]. The structure of wetland channels, encompassing sediment composition, changes in morphology, and variations in barge stability, directly impacts the quality of streamflow and the overall habitat within the wetland [22]. Consequently, the assessment parameters for habitat evaluation encompass seven key metrics: water quantity, water velocity, substrate and channel structure, channel morphology, bank stability, and the species composition and abundance of bankside vegetation. The scoring and cumulative calculation of these different indicators are determined based on the habitat assessment table, indicator settings, and specific scoring criteria, as outlined in Table 2. This nature-inspired approach ensures a comprehensive assessment of habitat quality, allowing for a detailed understanding of the wetland ecosystem’s health and functioning.
Table 1.
Data source.
Table 2.
Habitat parameter indicators and scoring criteria.
Parameters of Aquatic Fauna
Phytoplankton and zooplankton have short life cycles and are highly responsive to disturbances, making them important indicators for evaluating the performance of water ecological environments [23]. Changes in water environment quality can lead to alterations in the abundance, type, and community composition of zooplankton, and relevant community structure indices can be used to reflect the overall condition of water quality. The IBI comprehensive zooplankton index can be constructed to further assess water quality based on these indices [24].
Evaluation of the Water Environment
A comprehensive assessment of the ecological environmental quality of wetlands using the integrated assessment method, using water quality, habitat and aquatic life factors for weighted calculations to construct a comprehensive assessment index (MPI) as in Equation (2).
Where MPI is the comprehensive assessment index of wetland ecological environmental quality; Xi is the value of the factor assessment index; Yi is the factor assessment index weights. As in Table 3, the weights are determined by expert evaluation.
Evaluation of Health Services
The wetland park boasts abundant water resources and diverse plant resources, making it a prominent blue-green space connecting people with nature within the urban landscape [25]. The focus of research on health services in such parks revolves around enhancing mood, alleviating mental stress, promoting physical well-being, and improving attention. These objectives are achieved through various functional areas within the wetland park, including plant landscapes, recreational spaces, garden retreats, and water healing features. To assess the health services provided by wetland parks, this study adopts two indicators: health service quality and health service satisfaction. Using the ArcGIS 10.6 platform, a 4m×4m grid is established, and the evaluation results of each index, along with the data on health service satisfaction, are plotted onto the vector grid of Yintan Wetland Park [26]. The evaluation of health service in Yintan Wetland Park was calculated using a weight of 0.7 for health service quality and a weight of 0.3 for health service satisfaction [27]. The comprehensive evaluation was then obtained and the results were visualized using the ArcGIS10.6 platform to show the spatial distribution.
Evaluation of health service quality: The evaluation of health service quality is a quantitative measure that captures the extent to which park visitors experience a sense of well-being and resilience. In the context of wetland parks, the distribution of plants and water resources, as well as the design of the landscape, can significantly impact the quality of health services. However, research on health service quality in Chinese parks remains limited, primarily focusing on theoretical foundations and relying heavily on questionnaire-based data collection. To address this gap, a comprehensive assessment was conducted involving 40 professionals and 30 tourists who completed questionnaires. Within the park, 15 specific locations were marked as reference points. Participants were asked to score their psychophysiological experiences throughout their park visit, reflecting any changes in their well-being. Each questionnaire was scored by the same individual, ensuring consistency and scientific rigor in the data obtained [28]. By utilizing this approach, the evaluation of health service quality in wetland parks can be based on more robust and reliable data, providing valuable insights into the well-being benefits experienced by park visitors.
Evaluation of Health Service Satisfaction: A total of 118 user evaluations were collected from a public review platform using the keyword 'Yintan Wetland Park' from June 2022 to June 2023. These evaluations were imported into the ArcGIS10.6 platform for spatial visualization distribution. The evaluation data was filtered to locate the photographer's evaluation and photos were used to enhance the visual representation of the data [29].
Evaluation of Synergy between Water Environment and Health Services
The structural equation model for water environment and health services allows for analysis of the interrelated effects between two or more factors [30]. This model can identify both positive and negative influences between factors, making it an effective evaluation system for the synergy between multiple factors [31]. The model includes the synergy degree C and synergy index T, with a larger C indicating a more significant positive effect between factors. The calculation formula for C is as follows:
Table 3.
Expert assessment weights.
| Indicators | Score range | Weighted value |
|---|---|---|
| Water quality indicators | 0~5 | 0.6 |
| Habitst indicators | 0~5 | 0.2 |
| Aquatic life indicators | 0~5 | 0.2 |
In the equation: C represents the degree of synergy, which ranges from 0 to 1. Q1 and Q2 denote the evaluation results of the synergy between water environment and health services.
Results and Discussion
Evaluation of Water Environment Quality in Wetland Parks
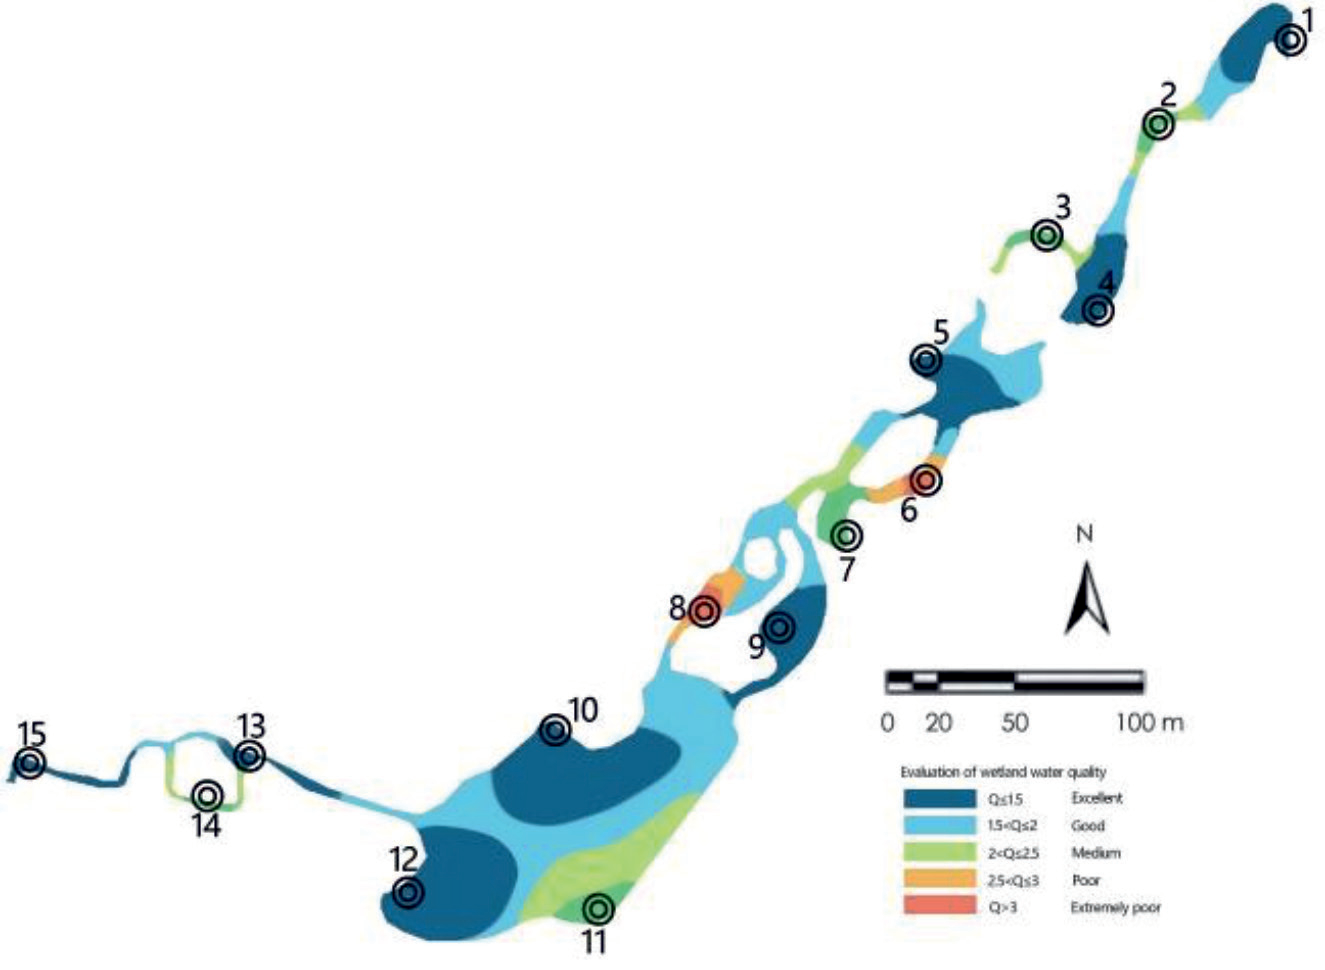
Evaluation of Wetland Water Quality
As depicted in Fig. 2, the evaluation of 15 monitoring marker points, labeled as Q1-Q15, reveals the water quality status. Among these points, 7 exhibit excellent water quality, 1 demonstrates good water quality, 5 show good water quality, 1 reflects poor water quality, and 1 indicates very poor water quality. Notably, the proportion of points with excellent and good water quality accounts for 53%, while the proportion of points with good water quality alone constitutes 33%. Conversely, the proportion of points with poor and very poor water quality amounts to 13%.
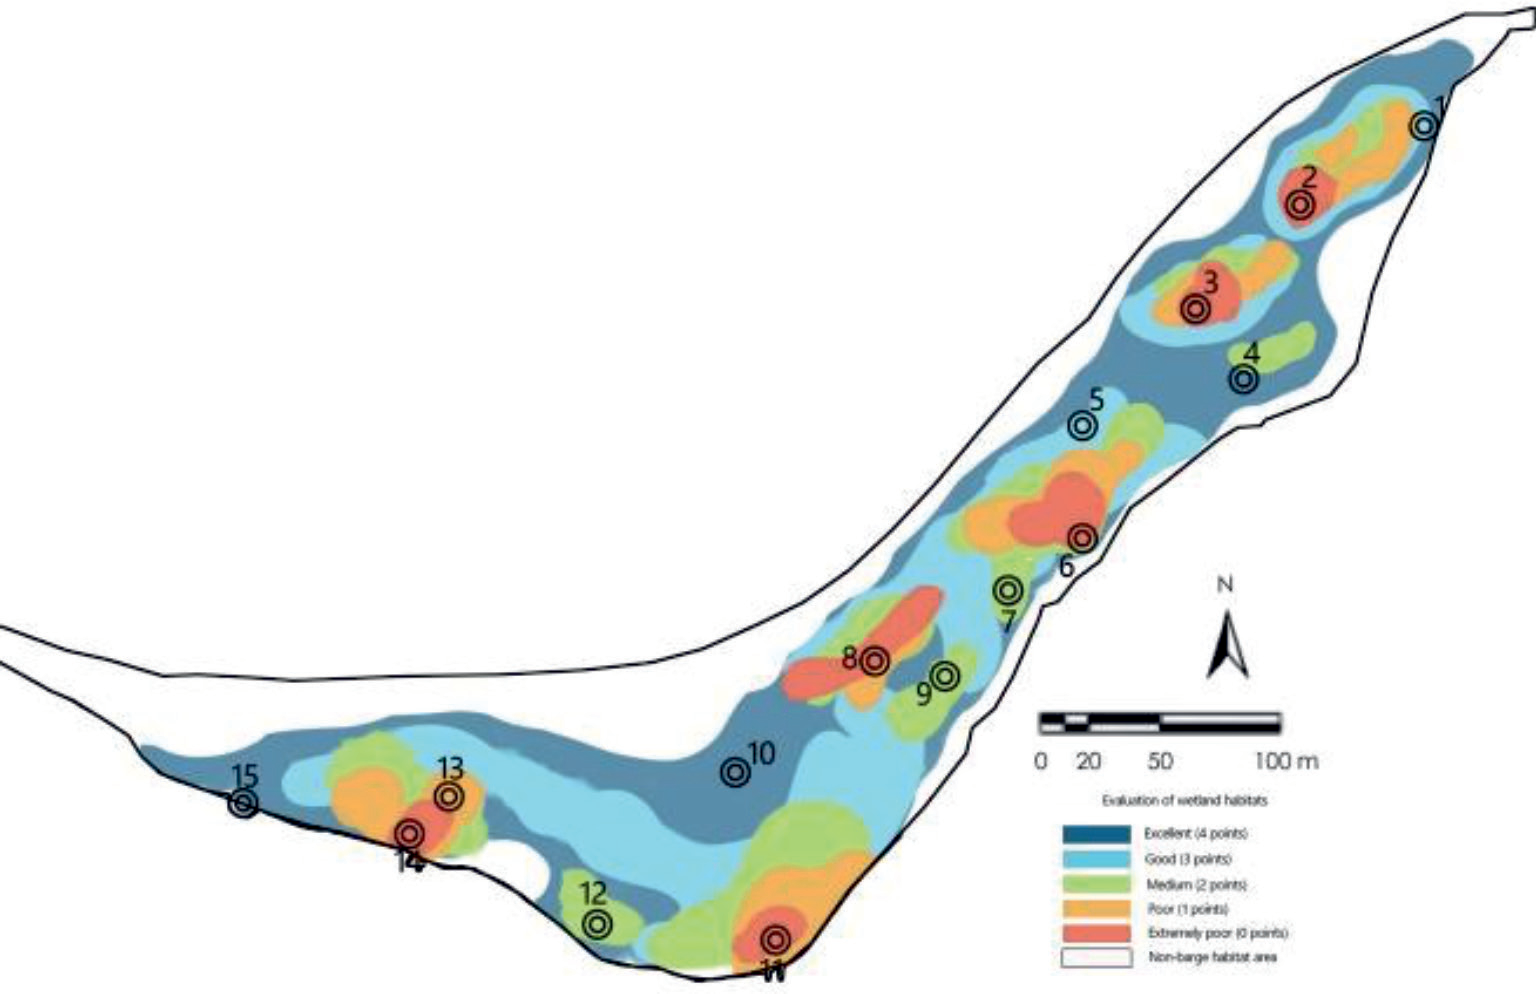
Evaluation of Wetland Habitats
Fig. 3 illustrates the assessment results for the 15 monitoring sites, indicating the quality of habitats. Among these sites, 2 demonstrate excellent habitat quality, 2 show good habitat quality, 4 exhibit moderate habitat quality, 1 reflects poor habitat quality, and 6 indicate very poor habitat quality. It is worth noting that sites Q2, Q3, Q5, Q8, and Q14 were assessed as very poor due to dry river construction during the summer flood control project and severe landslides during rainy days at site Q11. The proportion of excellent and good habitat quality amounts to 27%, while the proportion of moderate habitat quality constitutes 27%. Conversely, the proportion of poor and very poor habitat quality is 46%. These findings suggest that the environmental quality of wetland habitats varies significantly, and the distribution of natural resources is uneven.
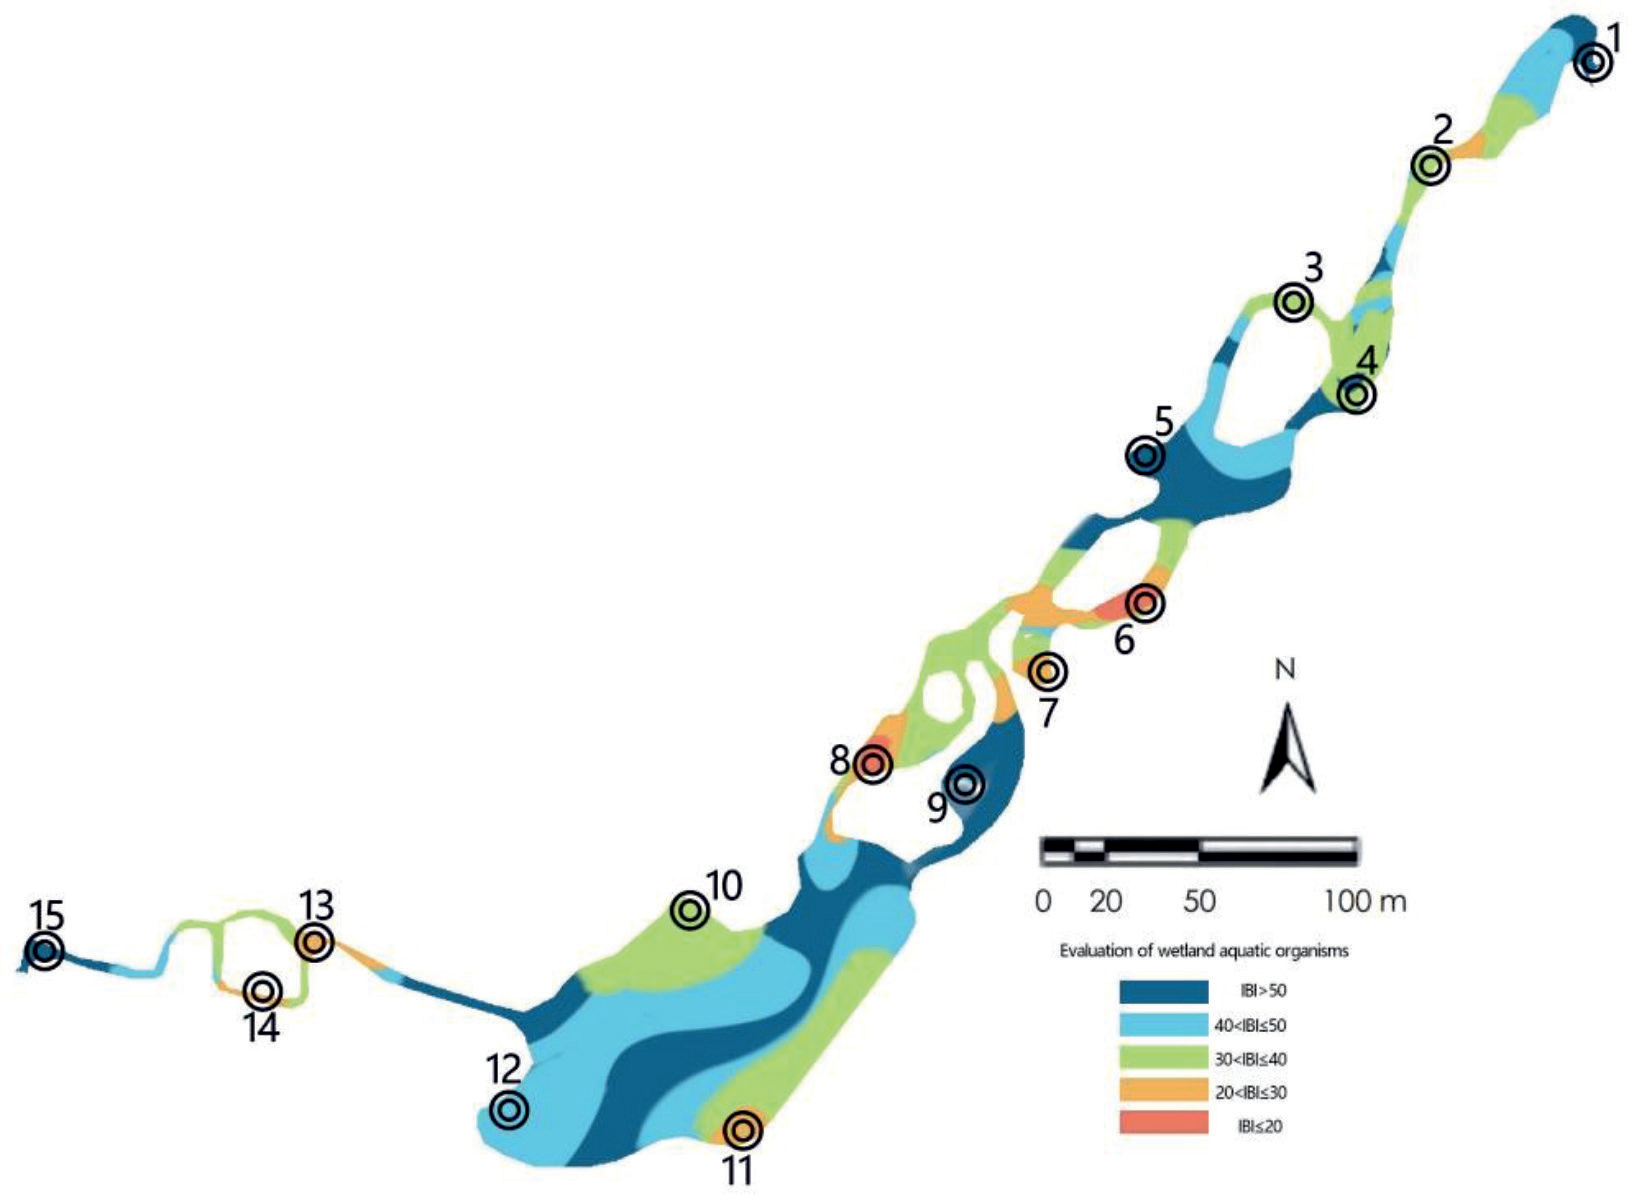
Evaluation of Wetland Aquatic Organisms
Aquatic biological assessments were conducted at 15 designated sites with comprehensive biological information available [32, 33]. Thirteen biological indices were considered, including eight indices related to zooplankton diversity and evenness, four indices related to biomass, and the Palmer algal pollution index. By utilizing superimposition and IQ score methods, redundant indices were eliminated, resulting in the construction of the IBI (Index of Biological Integrity) using zooplankton Shannon and total zooplankton biomass indices, as well as algal Shannon and total algal biomass indices [34]. The evaluation of aquatic organisms in the wetlands was based on the IBI biocomprehensive index, as depicted in Fig. 4.
Fig. 4 illustrates that among the 15 monitored sites, 4 were classified as excellent, 1 as good, 4 as moderate, 4 as poor, and 2 as very poor in terms of the status of aquatic organisms. The proportion of sites with excellent and good aquatic organism status was 33%, while 27% were categorized as moderate, and 40% were rated as poor or Extremely poor. These findings indicate that the overall condition of wetland aquatic organisms in the study area is average, and the living environment of these organisms has deteriorated due to frequent flooding, erosion, and river destruction during the summer water storage period, resulting in a decline in biological diversity.
Evaluation of Wetland Ecology and Environment
As depicted in Fig. 5, the comprehensive evaluation results based on the index weight algorithm for the 15 monitored sites reveal that 3 sites exhibit excellent comprehensive quality of wetland ecological environment, 4 sites demonstrate good quality, 5 sites exhibit medium quality, 2 sites display poor quality, and 1 site is categorized as very poor. Among these, the proportion of wetland ecological environments with excellent and good quality amounts to 47%, while 33% have medium quality, and 20% have poor or very poor quality. These findings suggest that the overall ecological environment of the study site is generally favorable, particularly in the eastern and western regions, while the central part, representing the urban river, shows an average ecological environment.
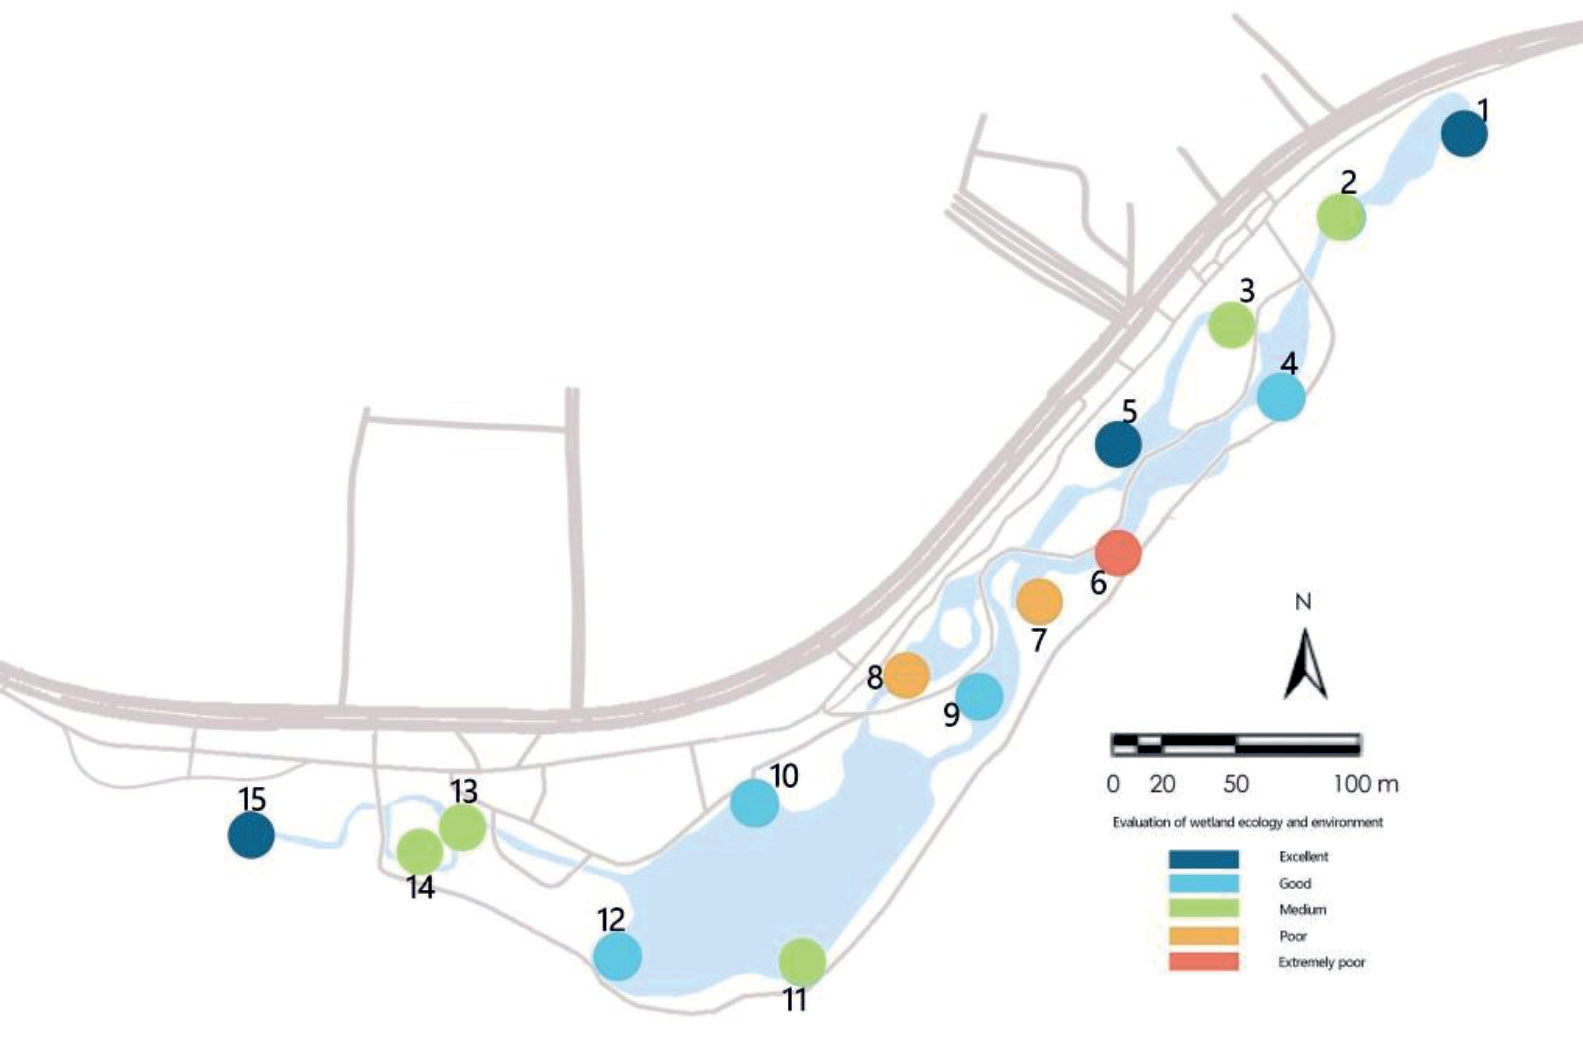
Evaluation of Health Services in Wetland Park
Results of Health Service Quality Evaluation
Among the respondents surveyed at Yintan Wetland Park, 55% were male and 45% were female, with a slightly higher representation of males. The majority of respondents were aged 40-60 and over 60, accounting for 32% and 40% respectively. Retired and near-retired individuals constituted the largest proportion of the workforce, making up 29%. The questionnaire data underwent reliability analysis in SPSS22.0 (Statistical Product and Service Solutions Software) , yielding a reliability coefficient of 0.722 for health service quality, indicating high reliability of the questionnaire.
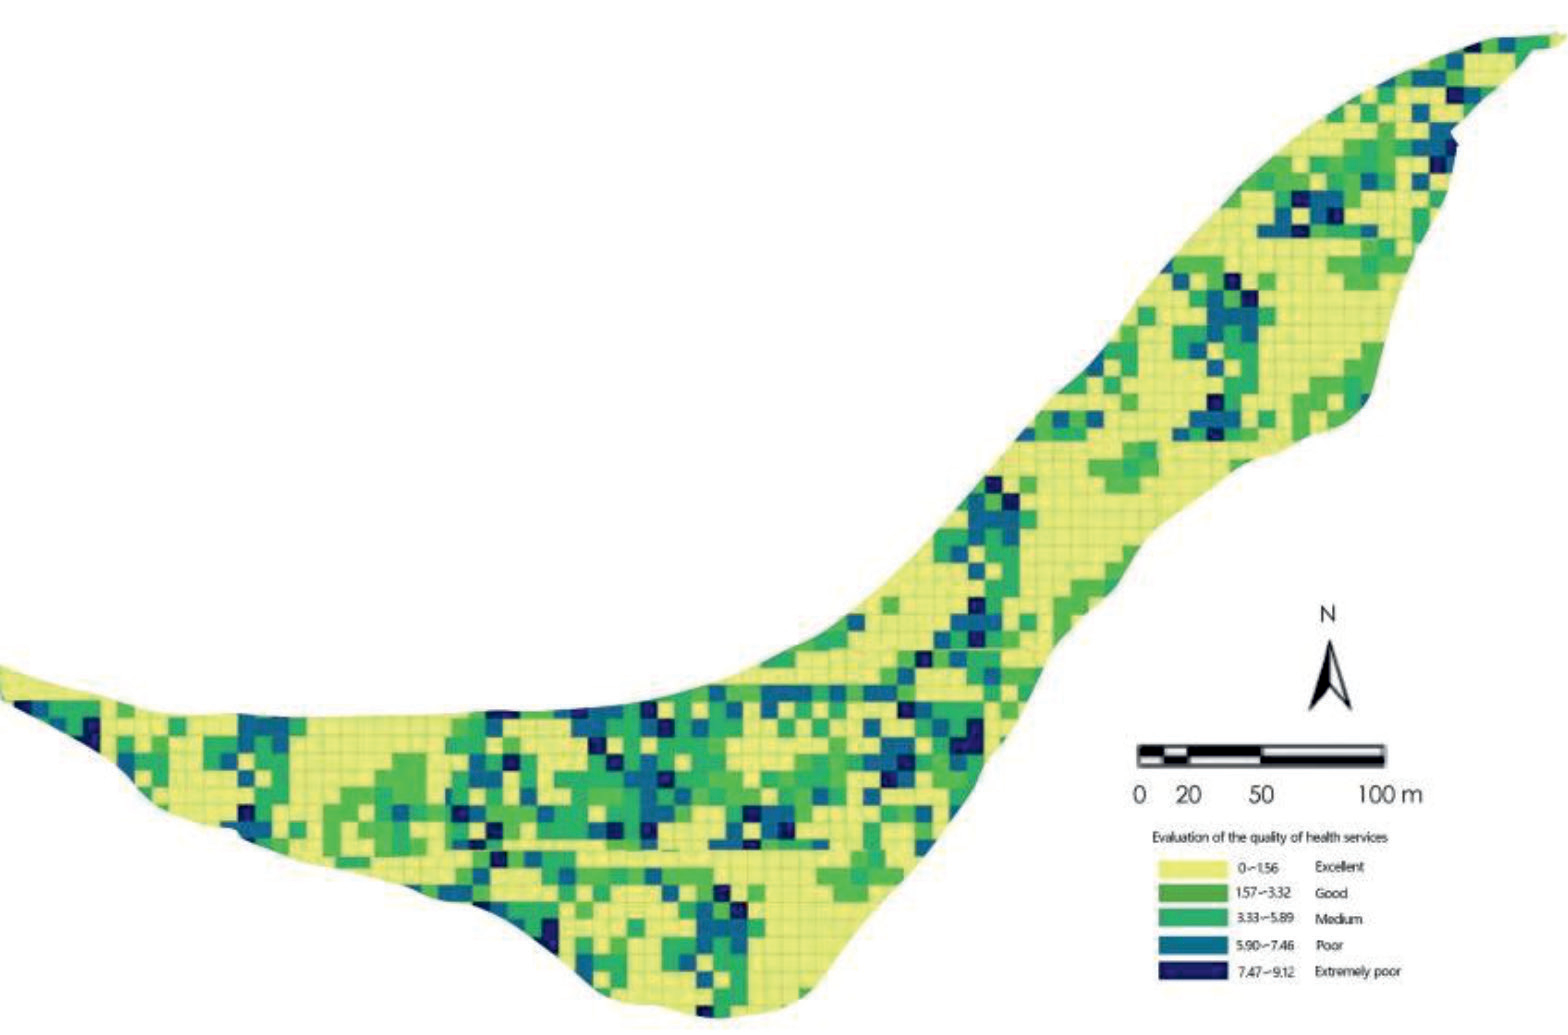
As depicted in Fig. 6, the spatial evaluation results of health service quality reveal distinct distribution patterns. High-quality health services are concentrated in the entrance area and the active zones with large water surfaces, while other areas lacking water surfaces and those with poor water quality exhibit lower health service levels. The areas with high health service quality mainly coincide with the park's main activity spaces and the resting areas near the water system. In contrast, areas without entrances and other parts of the park receive lower evaluations. Considering the evaluation results of each index, areas with extensive water surfaces generally offer good health services. However, areas with dry siltation or barge landslides experience a noticeable decline in health service levels. Moreover, flowing clean water bodies and areas with abundant plant diversity receive the highest ratings in terms of health service quality. To enhance the health service quality of wetland parks, attention should be given to the configuration of water surfaces and the creation of flowing clean water spaces.
Evaluation of Health Service Satisfaction
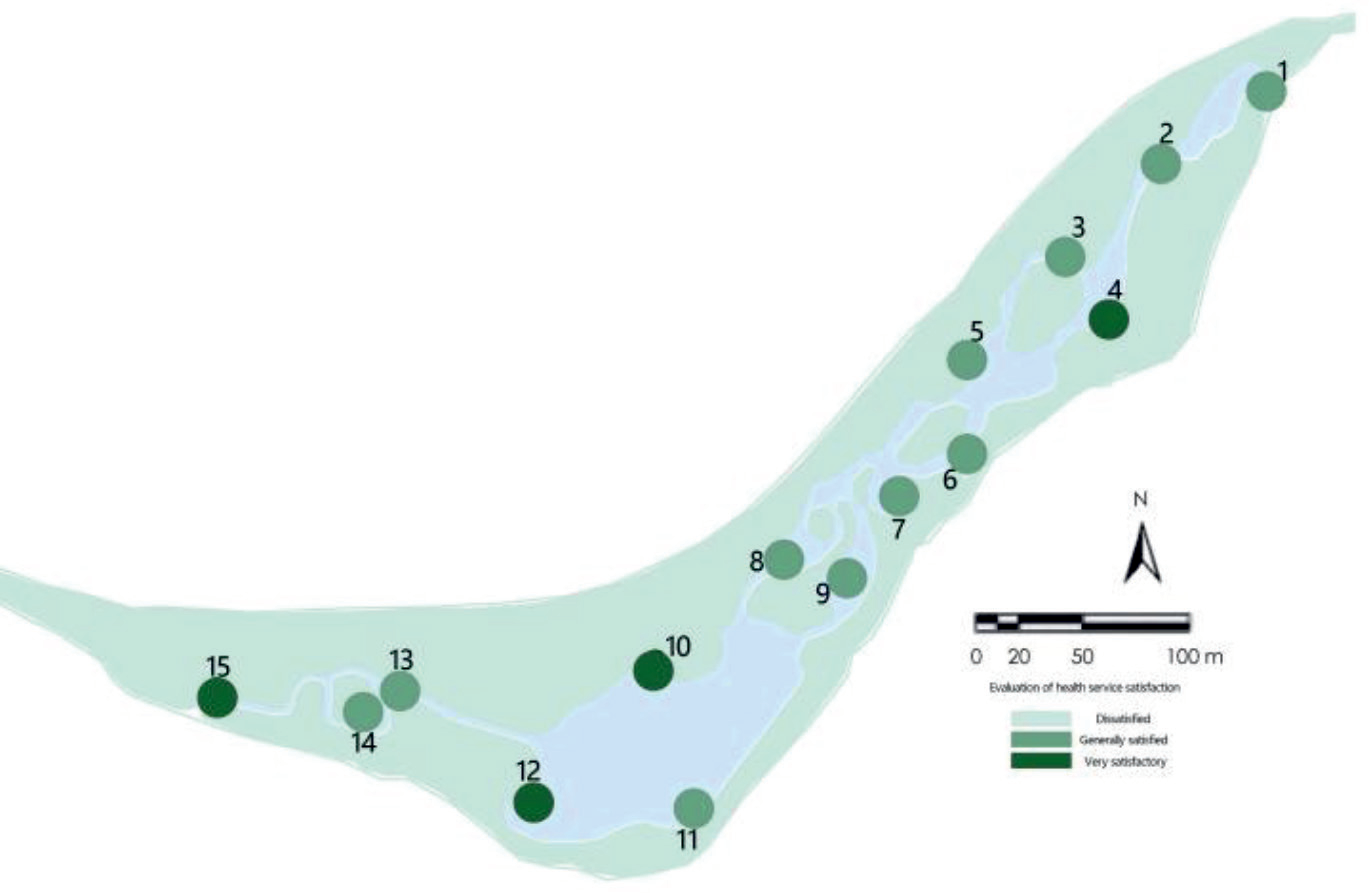
As depicted in Fig. 7. The evaluation results of health service satisfaction, based on the VW driving data, demonstrate strong spatial clustering. The areas with high satisfaction are concentrated in the entrance hall and its expansive water area, as well as the central activity area located in the eastern part of the park. Through panoramic video analysis, it was observed that these high satisfaction areas possess a favorable water environment quality and are adorned with lush plant landscapes. Conversely, the low satisfaction areas are primarily found in regions where the main road of the park is distant from the water system, lacking resting places, and experiencing frequent flooding in the wetland areas. Additionally, certain parts of the park exhibit outdated and deteriorating service facilities, contributing to low satisfaction in those areas. Moreover, inaccessible dense forests on the eastern and western sides of the park result in an absence of health service satisfaction ratings. Overall, the evaluation of health service satisfaction indicates a clear spatial pattern, with certain areas of the park offering highly satisfactory experiences due to their favorable water environment, abundant plant life, and well-maintained facilities, while other areas face challenges such as distance from the water system, limited resting spaces, and inaccessibility to certain natural features.
Results of Comprehensive Health Service Evaluation
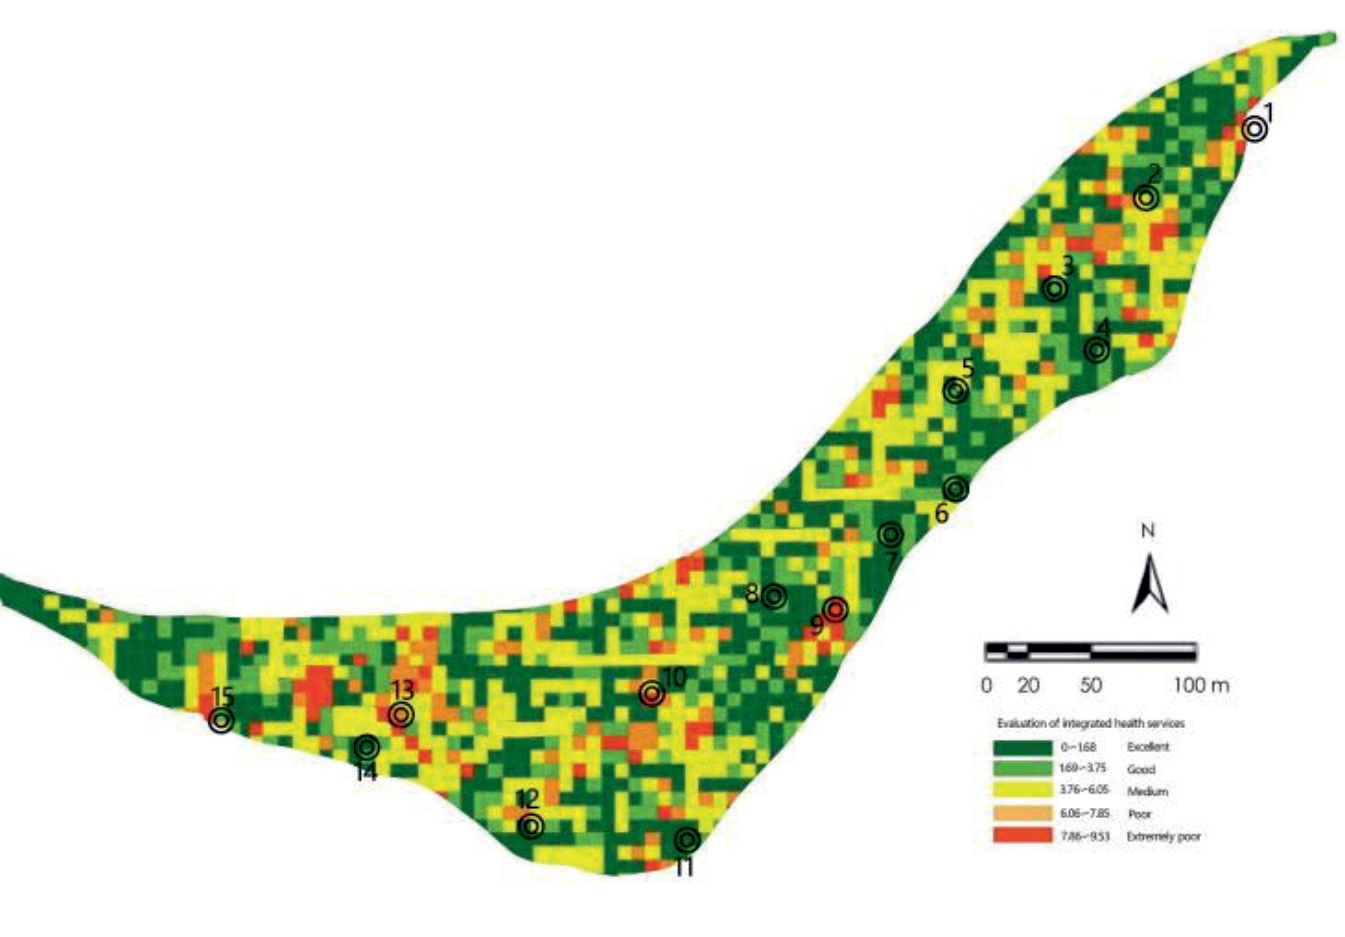
As depicted in Fig. 8, the evaluations reveal that the health service ratings are notably low in areas affected by severe river flooding, attributed to deteriorating service facilities along a section of the main road. Conversely, the southern part of the site receives higher health service evaluations due to its pristine water quality, dense habitat vegetation, and a diverse array of recreational plazas.It is worth noting that Marker 11, which experienced a barge landslide, presents a high-risk area with a significantly lower health service rating. Similarly, Markers 6, 7, and 8 exhibit dry and clogged water bodies, sparse vegetation density, and outdated surrounding facilities, resulting in inferior health service assessment outcomes.
Evaluation of Synergy between Water Environment and Health Services in Wetland Parks
The study employed the ArcGIS 10.6 platform to rasterize and label the simulation results of water environment and health services assessments. It calculated the synergy index between the simulation results of three factors: water quality, aquatic life, and habitat assessment, and the comprehensive evaluation of health services.
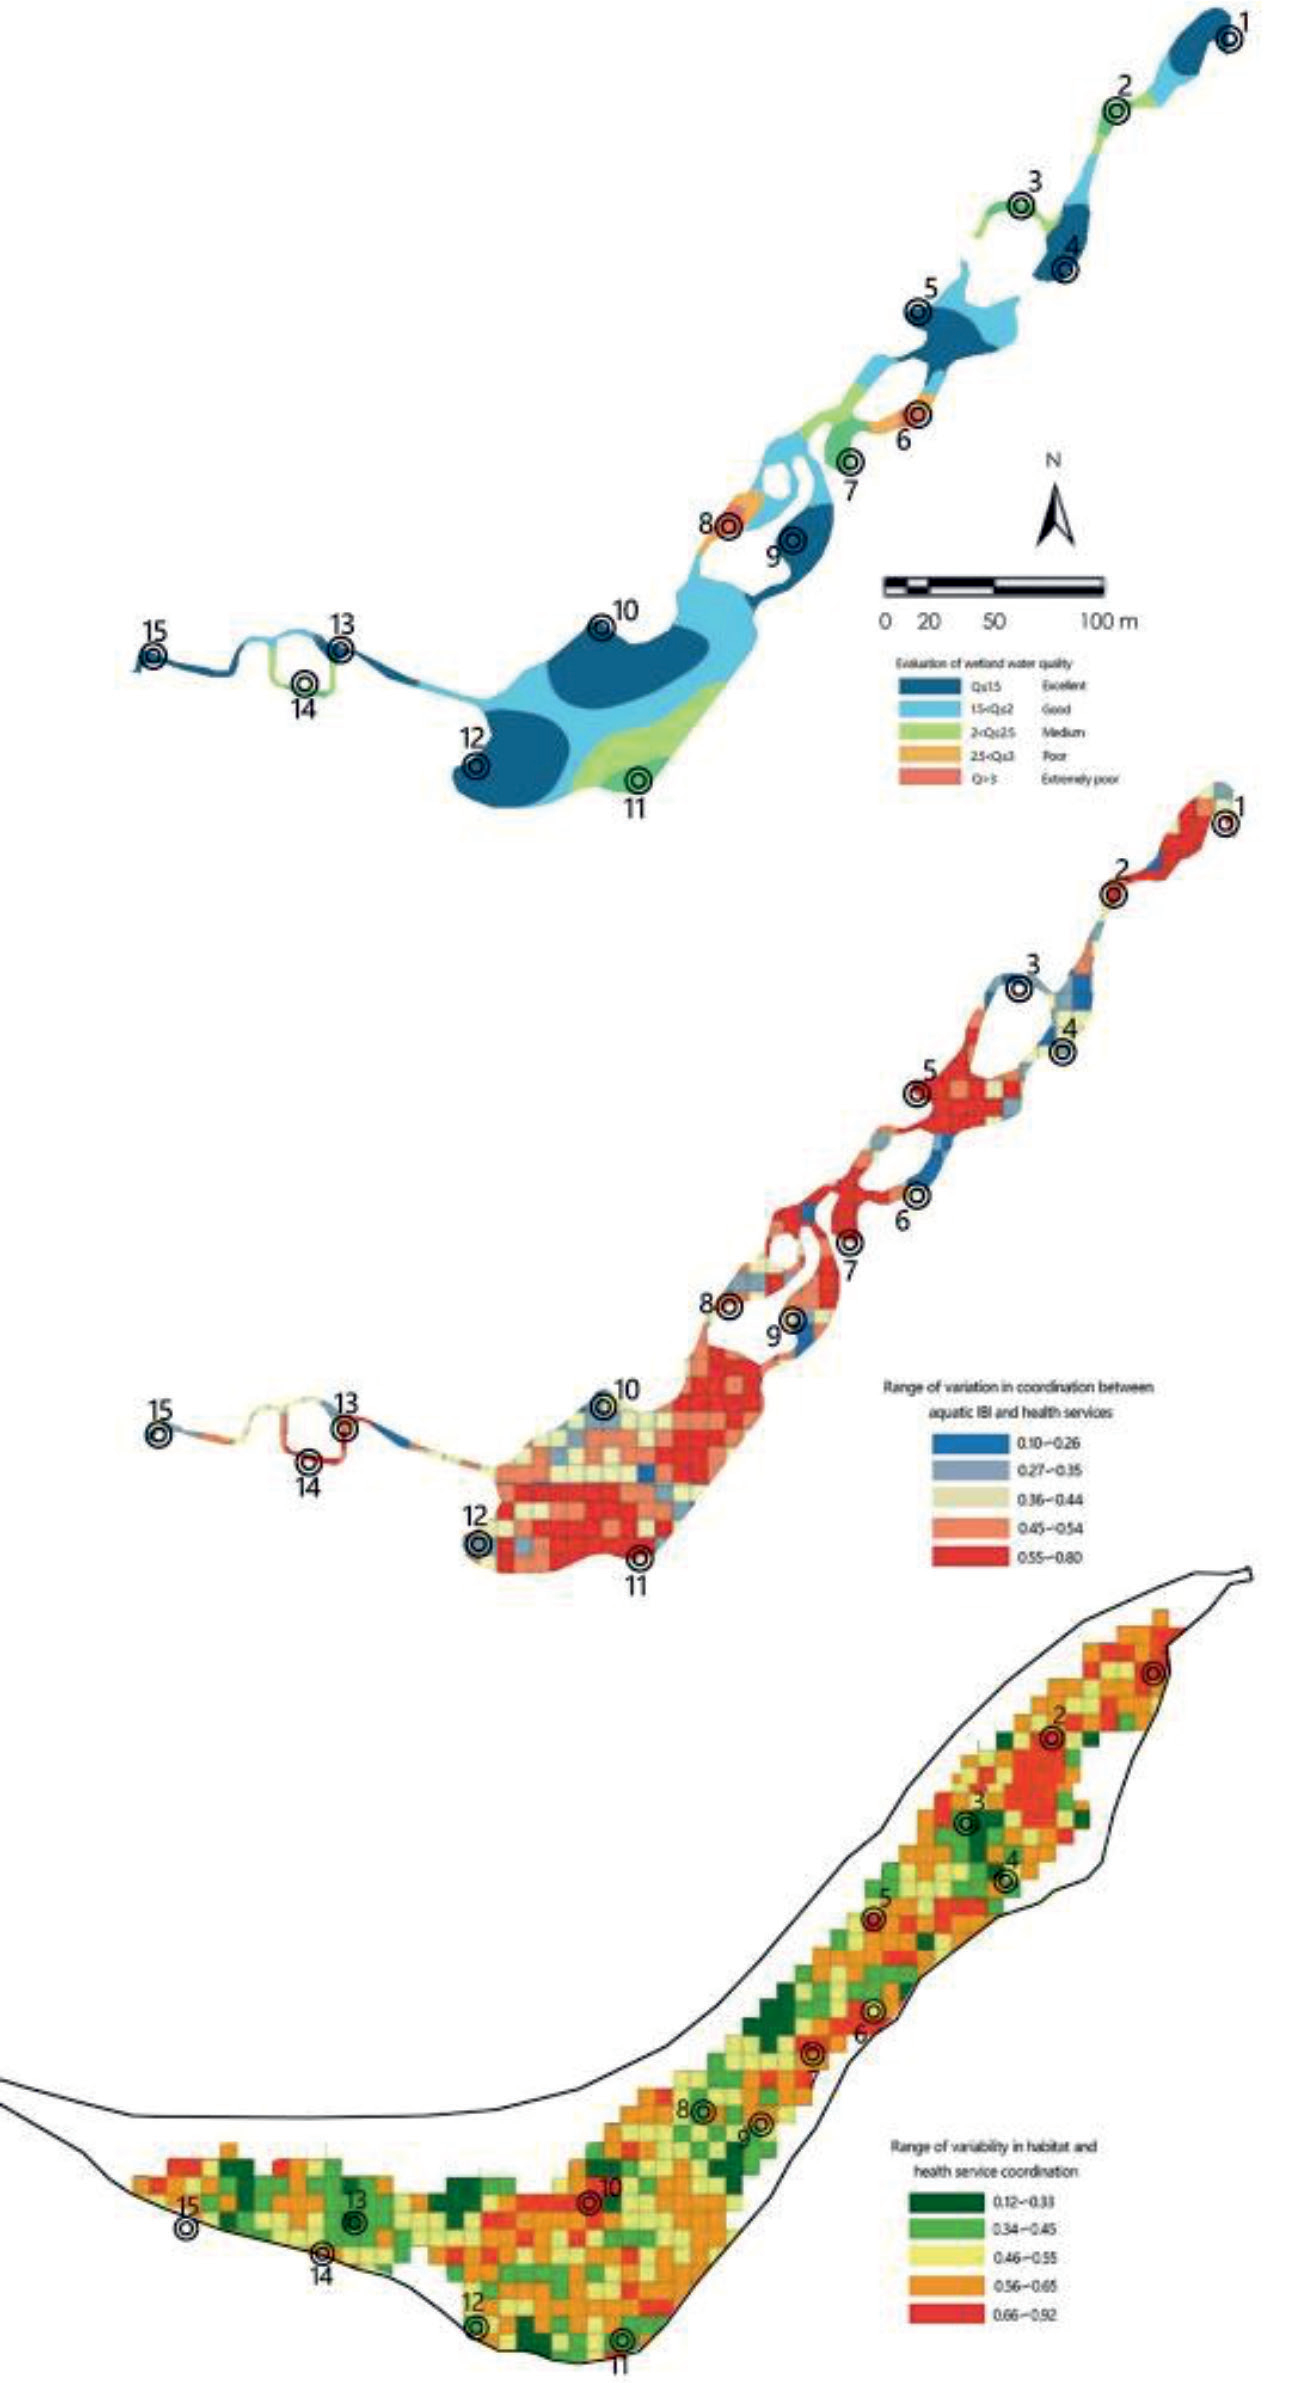
As depicted in Fig. 9, the coupling synergy (C-value) between water quality factors and health services ranged from 0.12 to 0.78. High synergy areas were predominantly concentrated in the large water surface at the northern park entrance, the water-friendly square at markers 6.7, the wetland inlet and outlet in the east and west, and the vicinity of the bird watching lake in the central area. Low synergy areas were primarily found in regions with river drying and sliding, open grasslands with limited buildings and trees, and near the park boundary. The spatial distribution trend of overall synergy and the coupling synergy between water quality factors and health services showed similarities. High synergistic areas were distributed in the central and northern parts of the park and linearly distributed in the southern part with a high density of aquatic plants. Low synergistic areas were concentrated in regions with intense human activity, particularly near areas with high human activity and open lawns with fewer trees in the western part of the park.Regarding the coupling synergy between habitat factors and health services (C-value), it ranged from 0.12 to 0.92. High synergistic areas were primarily located near the large water surface at the northern entrance, the wetland outlet and activity sites in the eastern part, and the barge area with abundant vegetation in the western part. On the other hand, low synergy areas were scattered throughout the study site.
To investigate the synergistic relationship between the overall water environment and health services, this study assessed the coupling coordination degree (C-value) between the integrated water environment assessment results and health services. The range of coordination (C-value) between the results of the integrated.
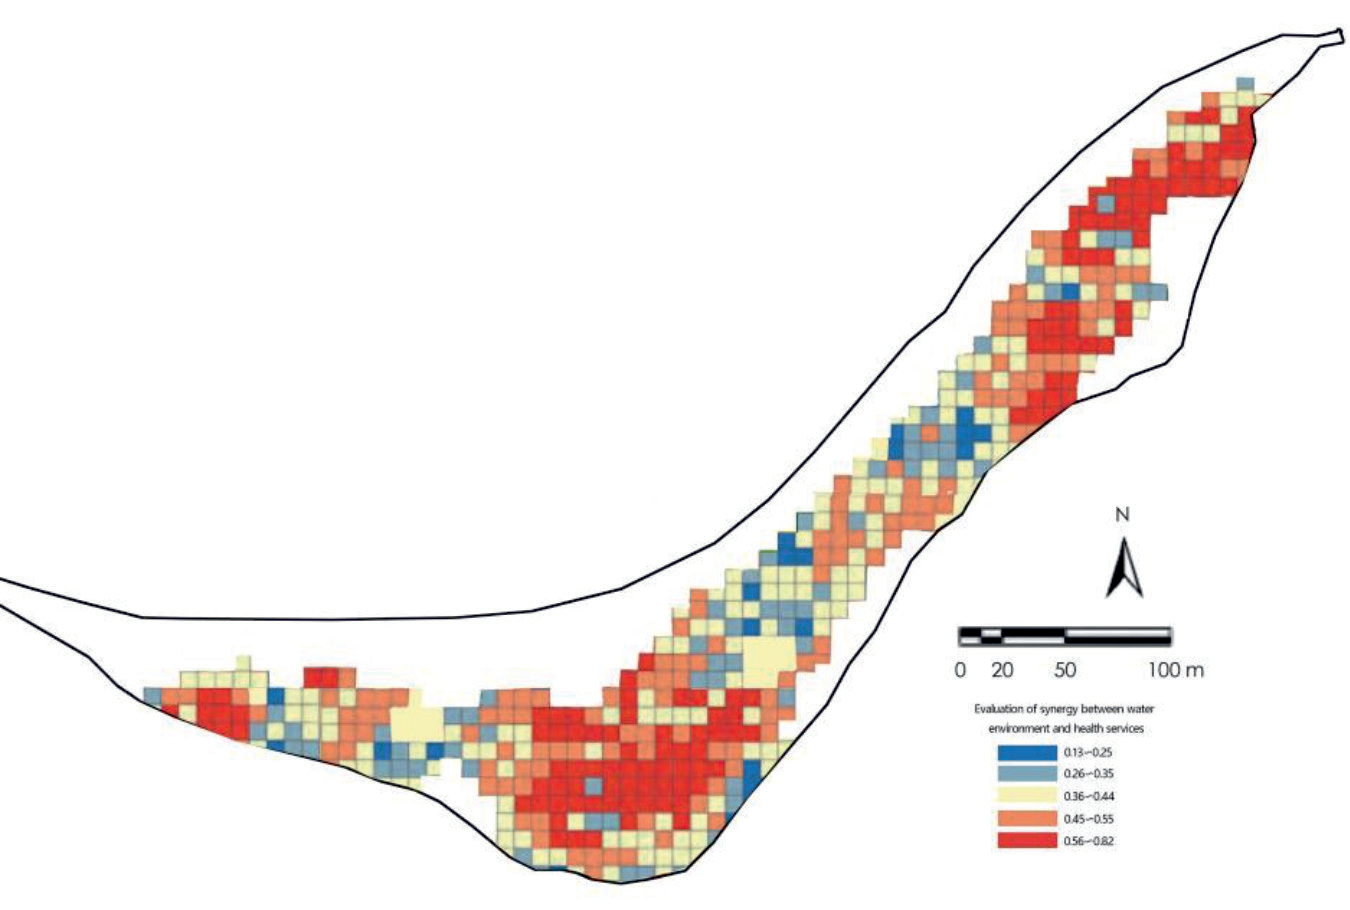
As depicted in Fig. 10, the assessment of the water environment and the health services is 0.13~0.78. The high coordination areas are mainly concentrated near the water bodies in the southern part of the park, as well as near some tree activity sites in the eastern part of the park and the wetland inlet activity area in the west, and the low synergy areas are mainly distributed in the eastern area of the middle section of the park and the site boundary area, as well as some point distribution in the western part of the middle section.
Conclusions
Collaborative Relationship between Water Environment and Health Services in Yintan Wetland Park
The study simulated the data requirements for water environment and health services at Yintan Wetland Park through field monitoring, questionnaires and combined with software, and evaluated the synergy of the two services using a coupled synergy model [35]. It was found that the synergy between the 3 water environment indicators and health services was evaluated, the synergy between the water quality indicators and health services was higher, and the synergy between aquatic life and habitat indicators was the lowest, indicating that in the planning and construction of the wetland park, more attention should be paid to the improvement of water quality, which will bring a healthier recreational experience.
The study shows that the synergistic relationship between aquatic environment and health services in Yintan Wetland Park is related to the degree of disaster, plant landscape and spatial perception of the site [36], and the conclusions are as follows:
1) The central square area in the south of the park, which experiences the highest frequency of use, requires optimization of the surrounding plant landscape.
2) The eastern side of the middle section of the park exhibits a distribution trend of higher synergy in the central area and lower synergy on both sides. This pattern is associated with frequent flooding in the wetland river, indicating the need for ecological restoration in this section.
3) The western side of the middle section of the park shows the highest synergy only in areas with lush aquatic and terrestrial vegetation, while the open lawn area exhibits lower synergy. This highlights the importance of multi-level plant landscapes in enhancing the health service experience.
4) The entrance/exit area of the park and the connected areas within the park demonstrate higher synergy, emphasizing the need to strengthen connectivity between the internal and external spaces of the wetland park.
5) Areas with lower synergy between the water environment and health services in the wetland park are typically characterized by squares or buildings with higher crowd density. This suggests that the degree of node connection within the site plays a crucial role in achieving synergy. Therefore, during the planning and design process of the wetland park, attention should be given to smooth flow and recreational guidance to prevent visitor congestion.
Strategies for Optimizing Wetland Parks based on the Synergy of Water Environment and Health Services
Based on the analysis results, this review provides a comprehensive summary of optimization strategies for wetland parks, focusing on the synergy between water environment and health services [37]. The strategies are presented in three main aspects: ecological restoration, site planning, and plant landscape. These findings aim to serve as a valuable reference for the planning and design of wetland parks, enabling the creation of sustainable and harmonious environments that maximize the benefits of the water environment and health services [38].
Sustainability of Ecological Restoration
Based on the analysis conducted in this study, it was observed that the interior of the wetland park has suffered significant damage, including barge bank formations caused by temporary flooding, resulting in river blockages and landslides. In response to the sensitivity of the wetland environment, engineering techniques will be employed to enhance the ecological environment, particularly by promoting the growth of plant communities. In areas where the wetland environment has been severely degraded and exhibits high sensitivity, specific engineering techniques such as gravel reinforcement of the physical substrate and the controlled regulation of water volume through weirs can be skillfully utilized. These measures aim to improve habitat heterogeneity and restore the plant community, thereby rejuvenating the ecosystem. Native plant species that demonstrate resilience to water and moisture conditions will be carefully selected to establish a natural plant ecosystem, ultimately enhancing the overall biodiversity of the wetland environment [39]. These strategies will contribute to the successful restoration and revitalization of the wetland park’s ecological integrity.
Improvement of Park Planning Connectivity
The study findings reveal that the current connectivity of nodes within the wetland park is insufficient, resulting in visitors predominantly gathering in the square or inside the buildings [40]. Moreover, there is a noticeable separation between the entrance square and the internal nodes of the park, which negatively impacts the overall experience of health services. To address this issue and enhance node connectivity, it is crucial to adopt a dynamic approach in managing the wetland park while considering the connectivity relationship with the surrounding communities [41]. This can be achieved by strengthening the park’s openness and establishing a comprehensive park road system. These measures will contribute to an improved quality of health services for visitors by facilitating better accessibility and seamless movement between different areas of the park.
Optimization of Plant Landscape Layout
The optimised plant landscape layout is crucial to improve the types of health services such as plant recreation, five-sense therapy and garden recreation in wetland parks, while the green covering is also an important factor in improving the quality of health services [42]. According to the research results, it is recommended to improve the plant landscape layout of the wetland park by adding some dense forest arrangements or planting tall trees within the open grassland area to provide a sense of privacy for the crowd and improve the synergy of health services. Also plant flowering shrubs and groundcovers in key areas to enhance the plant hierarchy.
Research Limitations and Perspectives
There are limitations to this study. Firstly, the limitations of the data, the evaluation indicators on the water environment need to be further completed. Such as water quality by several effects change more, summer rainy season high temperature, flooding various wetland areas damaged, will lead to data changes in water quality, the future can be through long-term, all-season monitoring, with more data to indicate the true water quality situation. Secondly, the use of questionnaires to assess health service quality in this study has limitations. The limited sample size and significant variations observed in the responses may reduce the generalizability of the findings. Future studies could aim to increase the sample size and employ diverse data collection methods to enhance the reliability and universality of the health service quality data. Thirdly, the synergistic evaluation model used in this study may be influenced by different types of environments. To overcome this limitation, field data should be collected at different time periods, seasons, and various types of wetlands to enable comprehensive comparisons and optimization of the research findings. Lastly, this study primarily focuses on exploring the relationship between water environment and health services in wetland parks. However, it is important to recognize that there are numerous factors that influence health services in wetland parks. To achieve a comprehensive improvement of health services, future research should gather more fundamental data and establish a coupling mechanism that accounts for the diverse factors related to health services in wetland parks.

