

Introduction
“Dual carbon” development involves widespread and profound economic and social systemic transformation, resulting in more stringent requirements for high-quality energy development. As the key component of energy transformation and emission reduction, power generation involves greater responsibility for systemic transformation. Therefore, building a new power system is crucial to achieving the goal of carbon peaking and carbon neutrality. Power systems will develop in a cleaner, more efficient, and more economical direction [1, 2]. In order to sustain the continuous growth of new-energy grid connections and build modern energy systems, the development of the power grid is facing increasingly high requirements. How to comply with power grid reforms, increase investment returns, improve investment efficiency, and achieve precise, efficient, and scientific investment management and benefit evaluation will become a key focus of attention in the next stage of development [3, 4].
The construction of a new type of power system involves a wide range of fields, has a large impact range, and requires the investment of a large amount of funds, which has resulted in new requirements for power grid investment and construction. Currently, research on the comprehensive benefits of power grid investment focuses more on the relationship between power grid investment and transmission and distribution electricity prices, as well as the impact on enterprise economic benefits. There is less research on the social and related entity benefits that power grid investment can generate. Regarding the effectiveness of power grid investment, Espie et al. conducted research on the economic evaluation of power grid projects, constructing evaluation models based on utility value function and analytic hierarchy process(AHP) [5]. Su et al. added ROI and internal rate of return indicators on this basis. In the research and analysis of the effectiveness of power grid investment in China, the general object is power grid engineering projects [6]. Liu et al. proposed a data-driven multidimensional quantitative analysis method for the effectiveness of distribution network investment [7]. González et al. constructed a power grid business investment efficiency model and proposed a calculation model for power grid enterprise investment efficiency based on theoretical research on power grid investment efficiency [8].
Regarding the relationship between power grid investment and socio-economic benefits, Chen et al. constructed a precise investment decision-making model for power grids based on technological, social, and economic benefits, providing a decision-making basis for controlling the investment rhythm and reasonably configuring the power grid scale [9]. Chen et al. constructed a comprehensive benefit model for power grid investment based on four modules: power grid investment capacity, investment plan, profit, and social responsibility. The calculation results show that the construction of rural power grids, the consolidation and poverty alleviation effect of electricity, and the consumption of new energy are the key measures by which to improve the comprehensive benefits [10]. Yang et al. proposed a composite evaluation system for investment in power grid infrastructure projects that balances economic and social benefits, and optimizes the investment strategy for power grid infrastructure [11]. Zhu et al. established a quantitative socio-economic benefit model for grid-side energy storage, providing a tool for technical scheme comparison and selection [12].
Regarding evaluation index systems for power grid investment, Yang et al. established a comprehensive evaluation index system for power grid investment strategies from four aspects: economic indicators, technical indicators, social indicators, and environmental indicators [13]. Jin et al. combined expert evaluation and the triangular fuzzy method to standardize the quantitative operation of qualitative indicators [14]. Wang et al. started from the long-term, systematic, and comprehensive characteristics of power grid investment and construction, focused on the economic benefits of the power grid, including cost and capital, and used the coefficient of variation method and the Delphi method to calculate the index weight [15]. The subjective and objective weighting method makes up for the disadvantages of the single weighting method to a certain extent. Based on the background of power system reform and from the perspective of energy development, Wu et al. established an evaluation index system for power grid investment benefits from the perspectives of system operation and the power market. A comprehensive analysis method for the node side and system side was used to comprehensively evaluate the market returns of different investment methods [16].
Regarding the selection of methods for evaluating the investment benefits of power grids, Gong et al. systematically and qualitatively analyzed the relative relationships among multiple factors based on the decision-making and evaluation laboratory method [17]. A combination weighting method combining the entropy weight method and the analytic hierarchy process was introduced, and the consistency of the weighting results was tested using Kendall’s coefficient of covariance in non-parametric testing. Wang et al. started with the comprehensive efficiency evaluation of distribution networks, combining the ANP method, DEMATEL method, and AEW method, and quantified the weights of each indicator in sequence using various weighting methods [18]. Based on grey relational analysis and principal component analysis, Liang et al. corrected the shortcomings of the grey relational analysis method in describing the characteristics of high-level indicators, providing a new approach for a comprehensive evaluation index system [19]. Bao et al. observed that when assigning weights to distribution network indicators, the Delphi method and fuzzy evaluation method based on expert opinions can be combined, and the improved entropy weight method based on information entropy can be used for the quantitative analysis of the index weight ranking, so as to solve the uncertainty and bias of the weight distribution [20].
Based on our literature review, we found that the current research on the comprehensive benefits of new investment in the power grid under the new power system focuses more on the power grid itself and the economic benefits, while there is less research on the comprehensive quantitative evaluation of the spillover benefits and comprehensive benefits of new investment in the power grid. However, from the perspective of fairness, external benefits are crucial for accurately evaluating the investment benefits of the power grid and reasonably allocating transmission and distribution costs.
In this study, we take the following research path: new power system requirements – new investment – typical projects – full life-cycle – social benefit model – comprehensive benefit quantification. Based on the characteristics of typical new investment in a power grid under a new power system, the typical new investment categories of the power grid are designed from the sources and functions. Based on the theory of system dynamics, a transmission path between power grid investment and social benefits is constructed. Then, based on the operation of existing power grid construction projects, a comprehensive benefit evaluation model for typical new investment projects in the power grid is constructed. By adding exogenous variables (that is, considering the impact of power grid investment on multiple related entities), a social benefit model is established for various entities, including reliability benefits, environmental benefits, and driving the economy. We quantify and measure the overall social benefits of promoting employment from multiple aspects. Based on the relevant data in respect of project investment, taking into account the constraints of the project operation mode, carbon reduction, national economic consumption, and human demand, the comprehensive benefit evaluation results of the investment project are obtained, providing a reference for the comprehensive quantitative evaluation of power grid project benefits.
Materials and Methods
Classification of New Investment in Power Grid under a New Power System
The new power system is a new era power system with the basic premise of ensuring energy and electricity security, the primary goal of meeting the electricity demand of economic and social development, the main task of constructing a high proportion of new energy supply and consumption system, the strong support of multi-directional coordination and flexible interaction between source, grid, load, and storage, the strong, intelligent, and flexible power grid as the hub platform, and the basic guarantee of technological innovation and institutional mechanism innovation. It is an important component of the new energy system and a key carrier for achieving the "dual carbon" goal [21]. According to the definition of the New Power System, this article focuses on the power grid part of the new power system, focusing on the comprehensive benefit evaluation of power grid investment, providing support for guiding effective investment in the power grid. The power grid is connected to the production and consumption of electricity, and is the center and hub of energy transformation and power systems. It should not only support the development and consumption of new energy, but also ensure the safe supply of electricity to the people. In the energy transformation stage, China’s power system will face problems, such as the electricity balance, safety of new-energy equipment, and rising comprehensive costs. Solving these problems will undoubtedly increase the level of power grid investment. Power grid investment is a complex investment decision-making process that involves many aspects and uncertainties. It is necessary to classify power grid investment in the new development stage reasonably, and analyze and evaluate the benefits by category.
New investment in the power grid should first serve the regular transportation business. This refers to investment newly added by the power grid enterprise to engage in normal business such as power transmission and distribution, ensuring the safety of the power grid system, and fulfilling the obligation of a universal power service.
In addition, investment in the power grid should also meet the needs of the construction of new power systems and serve other policies proposed by the country. Under the new power system, the power generation side requires the grid to synchronize and complete the grid connection of new energy in a timely manner. On the transmission side, it is necessary for the power grid to solve the problem of reverse distribution of resources and demand, achieving large-scale long-distance power supply. In addition, due to the impact of new energy and new loads, it is necessary to establish a stronger and more intelligent new power system to achieve safe and reliable power supply. At the same time, large-scale energy storage facilities need to be installed to solve the randomness and volatility problems created by new energy.
Based on the requirements and functional analysis of the new power system, the new grid investment can be divided into the following categories, as shown in Fig. 1.
1) Investment in conventional power grid transfer business
a. Investment in electricity growth
With the development of the economy, the demand for transferred electricity continues to increase, and there is investment in the power grid to meet the demand for increased energy supply and enhance its coordinated operation ability.
b. Load growth investment
With the improvement of social and economic levels, there is investment in the power grid in order to meet the maximum load demand and ensure the safe and reliable operation of the power grid.
c. Improved safety and reliability
The power grid needs to provide high-quality electricity for transportation, which results in requirements for the safe and reliable operation of the power grid to reduce economic losses caused by overloading, congestion, etc. As the distance and quantity of transferred electricity become longer and larger, respectively, the business requirements become higher, and there needs to be investment in the power grid in this category to maintain and improve safety and reliability. For example, adopting reliable power supply equipment and performing high-quality equipment maintenance.
d. Investment in improving transportation capacity The increase in electricity transfer across provinces and regions has prompted the power grid to increase investment in transmission capacity, such as the installation of high-voltage and ultra-high-voltage lines. This type of investment can increase the transmission capacity and distance of the power grid, reduce transmission losses, and enhance transportation capacity.
2) Policy investment in new power systems
Under the construction of the new power system, in order to adapt to the new situation and new demands, the focus of investment is on new-energy consumption, large-scale energy storage facilities, distributed and widespread access, intelligent construction of the power grid, and breakthroughs in key technology upgrades [22].
a. Large-scale new-energy access and grid strengthening
The large-scale integration of new energy requires the installation of corresponding transmission lines to improve the transmission network and achieve the transfer and transmission of new-energy power generation.
b. Distributed power supply integration supporting power grid investment
Users equipped with distributed power sources no longer rely solely on the power grid to provide electricity transfer, but have become users with “source load duality”. In supporting construction, investment is needed to provide corresponding lines and prepare for the corresponding backup capacity.
c. Investment of grid-side pumped-storage hydroelectricity
Pumped storage, as a relatively mature and large-scale energy storage category, is applied to grid-side investment to suppress fluctuations in new-energy output and reduce the risk in grid operation. Meanwhile, with the development of the electricity market, energy storage stations can also act as independent entities for market-oriented transactions.
d. Investment in new-energy storage on the power grid side
Fig. 1.
Classification of new investment in power grid under the target of new power system construction.
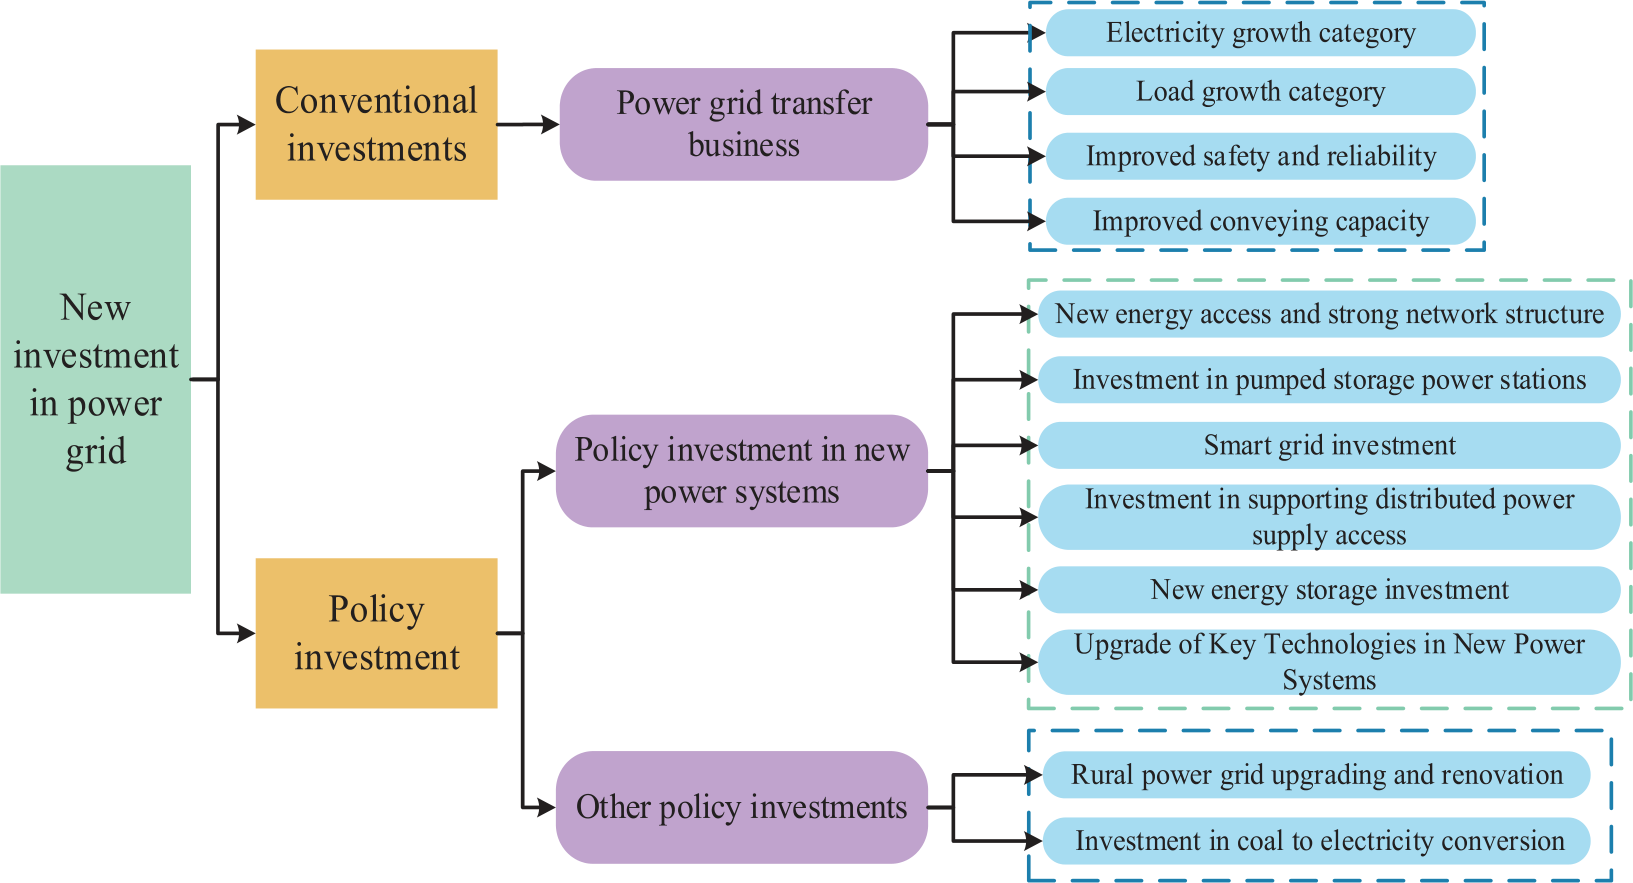
New-energy storage includes electrochemical energy storage, hydrogen energy, compressed air, etc. [23]. Its technical level is high, and the energy storage and discharge efficiency is high. The layout of new-energy storage on the power grid side enhances the stable and controllable level of the external characteristics of power equipment, thereby ensuring the safety and stability of the power system.
e. Smart-grid investment
The significant increase in the number of new-energy sources has resulted in a higher demand for digital intelligence such as power grid communication and information data processing capabilities, and the diversification of the load structure cannot be separated from the support of power grid intelligence [24]. In the power generation process, the smart-grid can be compatible with the access of various power sources, reducing the occurrence of wind and light waste. In the transmission and distribution process, intelligent equipment monitors the real-time operation of the power grid, proactively identifies potential problems in the power grid, and takes action to effectively improve power quality and reliability. In the electricity consumption process, intelligent electricity meters are used to collect electricity consumption information, helping to achieve load management, load forecasting, and energy-saving management.
f. Breakthrough in upgrading key technologies of new power systems
In the construction of a new type of power system, it is necessary to focus on technologies that achieve high efficiency, high safety, and large-capacity energy storage. Attention should also be paid to hydrogen energy and fuel cells, the coordinated operation of source network load storage, and comprehensive energy systems.
3) Other policy investments
The power grid not only provides transportation services, but also serves national policies. In response to the national policies of rural revitalization and targeted poverty alleviation, other policy investments in the power grid include the upgrading and reconstruction of rural power grids, construction of coal-to-electricity supporting projects, etc. This type of investment aims to improve the electricity consumption conditions of rural residents, promote electricity substitution, coordinate and solve the problems with rural power grid development, and promote new urbanization and the equal development of urban and rural residents.
Economic Benefit Evaluation Method for New Investment in Power Grid under New Power System
In this section we focus on three typical projects under the construction of new power systems: distributed photovoltaic grid-connected supporting investment, new-energy grid-connected supporting investment, and grid-side energy storage investment [25]. We determine the cash inflows and outflows during the investment cycle and establish an economic benefit model that adapts to typical investments.
The economic benefit model of new investment in typical power grids under the construction of new power systems is shown in Equation (1):
In the formula, Beco represents the economic benefits of new investment in the power grid, Iall represents the present value of cash inflows throughout the entire life-cycle, and Call represents the occurrence value of cash flows throughout the entire life-cycle.
The evaluation of economic benefits can provide a reference for investment decisions by calculating the internal rate of return and the rate of return on the investment.
The internal rate of return refers to the discount rate when the total present value of capital inflows equals the total value of capital flows and the net present value equals zero. Generally, the project is feasible when the internal rate of return is greater than or equal to the benchmark rate of return. The sum of the discounted values of the cash flows of the investment project in each year is the net present value of the project. When the net present value is zero, the discount rate is the internal rate of return of the project. The calculation formula is shown in Equation (2):
where t represents the year, (CI–CO)t represents the net cash flow of year t, and IRR represents the internal rate of return.
The investment return rate, also known as the investment profit rate, refers to the ratio of the investment income (after tax) to the investment cost. The specific calculation formula is shown in Equation (3):
In the formula, ROI refers to the return on investment, EBIT is the annual pre interest and tax profit, and TI is the total investment of the project.
Next, we conduct an economic benefit model study for three typical projects under the construction of the new power system (distributed photovoltaic grid-connection projects, large-scale new-energy grid-connection projects, and energy storage investment projects) based on a summary of cash inflows and outflows throughout the entire life-cycle.
Economic Benefit Evaluation Method for Supporting Investment in Power Grid under the Promotion of Distributed Photovoltaics
Under the promotion of distributed photovoltaics, supporting investments are made in the power grid to promote the connection of distributed photovoltaics to the grid and ensure the safe and reliable use of electricity by users. Some of the users’ electricity needs are met by distributed photovoltaics, resulting in a decrease in electricity demand for the grid and a decrease in revenue from electricity sales. In addition, the investment in supporting the power grid generates initial investment, operation, and maintenance costs, as well as income from distributed power grid fees, capacity reserve fees, and possible residual value recovery gains and losses [26], as shown in Equation (4).
In the formula, Mg represents the economic benefits of the power grid under the investment of the distributed photovoltaic grid connection supporting project, Ies represents the changes in the sales revenue of the power grid before and after the investment of the distributed photovoltaic grid connection project, Iia represents the revenue from grid passing fees, Irs represents the revenue from capacity reserve fees, Irv represents the residual value of fixed assets, Cinvest represents the initial investment cost of the distributed photovoltaic grid connection supporting project, COM represents the project operation and maintenance costs, and Cep represents the changes in the purchase cost of the power grid before and after the investment of the distributed photovoltaic grid connection project. Cretirement represents the cost of scrapping and disposal.
In the formula, Iia is the income of the grid-crossing fee, Qi't, is the grid-crossing electricity involved in the m i-th voltage level and m-th user in the t-th year. The value of i is between 1 and 5, representing the voltage levels 1kV and below, 10kV, 35kV, 110kV, and 220kV. The value of m is 1-2, representing the general industrial and commercial and large industrial user categories. P'i,m is the power transmission and distribution price of the i-th voltage level and m-th user access, and P'maxd,g is the power transmission and distribution price of the highest voltage level involved in distributed generation marketization transactions.
When pricing is based on capacity, the capacity reserve fee income is the reserve capacity electricity price income, as shown in Equation (6), where m is the month, Smt is the transformer capacity or maximum demand of the user in the month of year t, and Psrt is the corresponding capacity reserve fee standard.
Economic Benefit Evaluation Method for Supporting Investment in Power Grid under New-Energy Grid Connection
Under the integration of new energy into the grid, the investment in supporting the power grid has led to changes in the original electricity sales revenue, electricity purchase cost, and transmission and distribution revenue of the power grid. The main economic benefits comprise changes in the electricity sales revenue before and after the grid investment, changes in the electricity purchase cost, changes in the transmission and distribution revenue, initial investment costs, operation and maintenance costs, fault costs, scrap disposal costs, large-scale renewable energy connection fee income, and residual value recovery profit and loss.
In the formula, Mne represents the economic benefits of supporting investment in the grid under the new-energy grid connection, Ies represents the changes in electricity sales revenue before and after the investment, Itd represents the changes in income from transmission and distribution business, Iinte represents the income from large-scale renewable energy grid-connection fees, Irv represents the residual value of fixed assets, Cinvest represents the initial investment cost of the project, COM represents the operation and maintenance costs of the project, Cep represents changes in the electricity purchase cost before and after the investment, CF represents the fault cost of the project, and Cretirement represents the disposal cost of scrapping.
Renewable energy generation grid-connection can be divided into three types: shallow grid-connection, hybrid grid-connection, and deep grid-connection. Under the shallow grid-connection mechanism, renewable energy power plants only pay the cost of connecting the public grid to the power grid. Under the hybrid grid-connection mechanism, renewable energy power plants pay the cost of connecting to the public grid and some strengthening fees to the grid. Under the deep grid-connection mechanism, renewable energy power plants pay the cost of connecting to the public grid and all strengthening fees to the grid.
In the formula, Iinte represents the income from large-scale renewable energy connection fees; Iut is the cost of the grid connection line between the renewable power point and the public substation; ahybrid is the connection fee coefficient. When ahybrid is 0, this indicates shallow connection; ahybrid∈(0,1) indicates mixed connection; and when ahybrid is 1, this indicates deep connection. Irein represents the cost of grid strengthening brought about by the integration of renewable power sources.
Evaluation Method for Social Benefits of New Investment in Typical Power Grids under New Power Systems
In this section, we focus on solving the problems and future development directions of typical new investment in the power grid under the new power system, analyze the social benefits promoted by typical new investment in the power grid, and establish social benefit models for various entities in power grid investment. With regard to the selection of indicators, this paper refers to the environmental impact and social benefit assessment of investment projects in the ‘Regulations on the Implementation of Post evaluation of State Grid fixed assets investment Projects (363-2014)’, and combines the research results of literature [27], based on the solution problems and future development direction of typical new investment in power grids under the new power system, analyzes the social benefits of typical new investment in power grids, And social benefit models of power grid investment on various entities have been established separately. The social benefits of power grid investment on various entities are shown in Fig. 2.
Beneficial Entities of New Investment in Typical Power Grids under the New Power System
1) All members of society
The social benefits of power grid investment should serve the whole of society [28]. Firstly, power grid investment can drive local economic growth, mainly manifested as support for GDP. Secondly, increasing investment in the power grid and increasing investment in new energy can effectively reduce the utilization rate of coal, reduce the emission of harmful substances, and reduce the emission of gas pollutants, thereby protecting the environment. Once again, new investment in the power grid can promote the development of local and project-related industries, increase the income of relevant personnel, and promote employment. Finally, electricity is an important infrastructure and public service sector. A safe, stable, reliable, and affordable power supply can play a positive role in attracting investment and affect the economic development of various regions.
2) Distributed users
The power grid makes supporting investments to promote the application of distributed power sources, allowing distributed users to reduce electricity costs and gain additional benefits. Self-built distributed photovoltaic users can use distributed photovoltaic power generation to achieve the spontaneous self-use of surplus electricity.
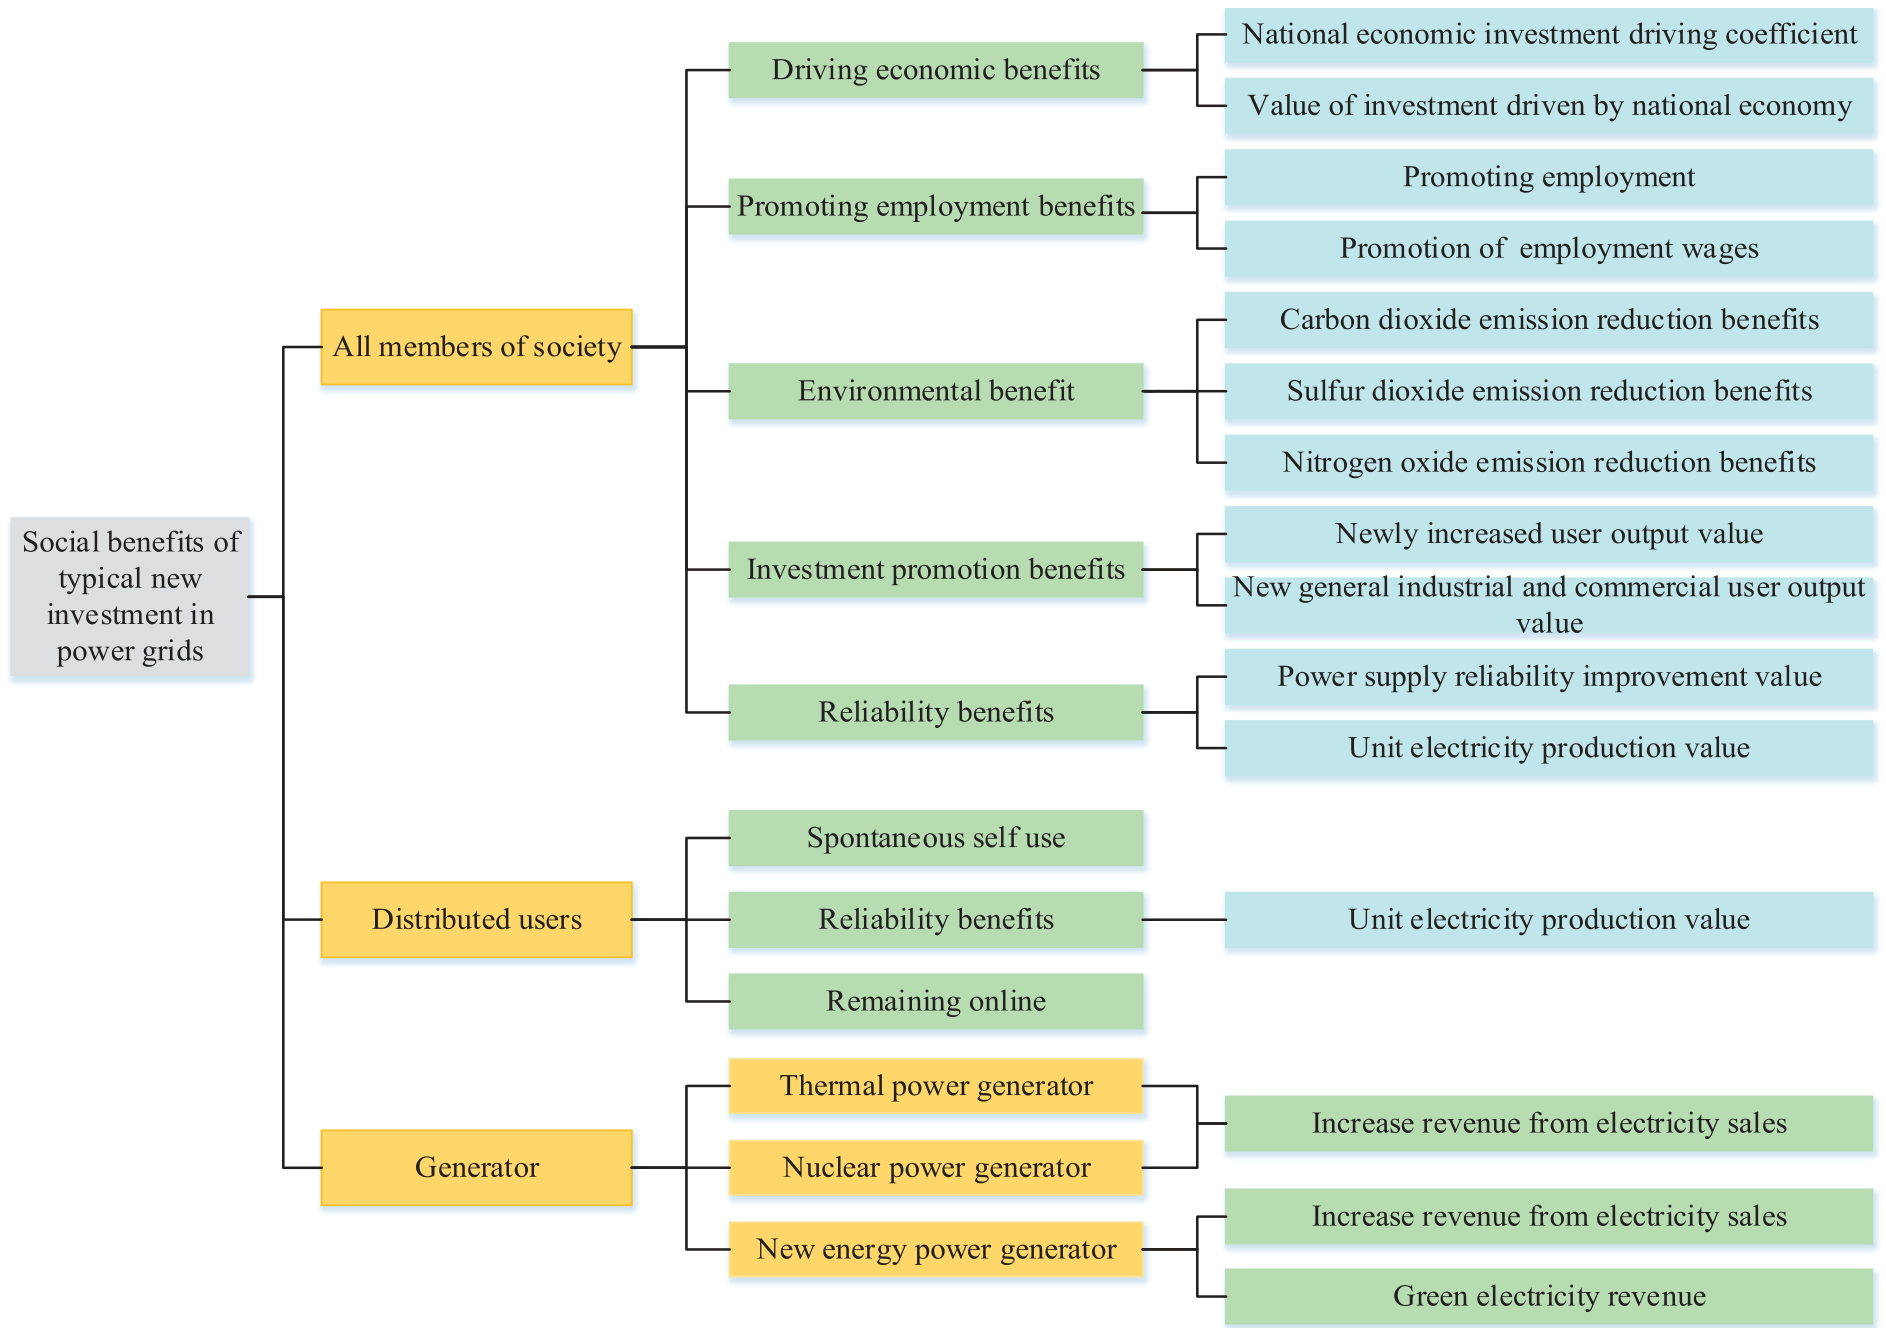
3) Power producers
Under the new power system, investment in the power grid can also generate benefits on the power side, even if the power generation company obtains benefits. Firstly, increasing investment in ultra-high-voltage lines by the power grid can enable power producers to sell more electricity and achieve electricity sales benefits. Secondly, investment can promote the consumption of new energy and reduce the phenomenon of new-energy power generation companies abandoning electricity. With the maturity of China’s carbon trading market, new-energy power generation companies can also gain benefits by selling green trading certificates.
Changes in the Benefits of All Members of Society under the New Investment in the Power Grid
Typical new investment in the power grid under the new power system has driven economic development, promoted employment, reduced emission pollution through promoting new-energy consumption, and improved network security and reliability through supporting investments in distributed photovoltaic and new-energy grid-connection projects. Typical new investment in the power grid under the new power system will generate new benefits for all members of society, as shown in Equation (9):
In the formula, Btsocial represents the social benefits of the project investment in year t, Btpull represents the driving economic benefits of the project investment in year t, Btwork represents the employment promotion benefits of the project investment in year t, Btenvir represents the environmental benefits of the project investment in year t, Btattract represents the investment attraction benefits of the project investment in year t, and Btreliable represents the reliability benefits of the project investment in year t.
1) Driving economic benefits
Firstly, it is necessary to decompose the investment in power grid investment projects into different sectors of the national economy under different industry categories, calculate the consumption of power grid investment projects in each sector of the national economy, and then obtain the driving benefits of power grid investment for each sector of the national economy, as shown in Equations (10) and (11).
In the formulas, Bpull–complete represents the direct driving economic benefits of the power grid investment project, Cdirect,i represents the direct consumption of the i-th national economic department by the engineering investment of the power grid investment project, vi represents the input–output added value of each national economic department, and Bpull–complete represents the complete driving economic benefits of the power grid investment project investment.
2) Promoting employment benefits
The fixed-asset investment construction of power grid enterprises will directly and indirectly drive the development of related industries and promote social employment. Based on the consumption value of project investment in various sectors of the national economy, combined with the compensation coefficient of workers in various industries and the average wage of personnel in each industry, the benefits of promoting employment and new employment positions by investing in new power grid investment projects can be calculated[29], as shown in Equations (12) to (17).
In the formula, Bwork represents the benefits of promoting employment through project investment, Bdirect represents the benefits of directly promoting employment through project investment, Bindirect represents the benefits of indirectly promoting employment through project investment, Qwork represents the number of new employment opportunities through project investment, Qdirect represents the number of direct new employment opportunities through project investment, and Qindirect represents the number of indirect new employment opportunities through project investment. The values of n range from 1 to 17, representing 17 national economic sectors. Itotal represents the total project investment, ahuman represents the proportion of project personnel salaries, and phuman represents the average salary of project personnel. Ci is the consumption value of project construction investment in various national economic departments, wi is the coefficient of labor compensation for each department in the input–output direct consumption coefficient table, and pi is the average salary of personnel in each department.
3) Environmental benefits
The environmental benefits of typical new investment in the power grid under the new power system depend on its ability to promote economic development, energy conservation, and emission reduction. The environmental benefits of typical new investment in the power grid under the new power system are the environmental protection effects of reducing emissions of gaseous pollutants such as carbon dioxide, sulfur dioxide, and nitrogen oxides due to energy conservation and emission reduction.
The environmental benefits generated by energy conservation and emission reduction in power grid investment projects are represented by the sum of the governance costs for carbon dioxide, sulfur dioxide, and nitrogen oxides, as shown in Equation (18).
In the formula, Btenvir represents the environmental benefits generated by the grid investment project in the i-th year, Btcarbon represents the carbon dioxide reduction benefits in the i-th year, Btsulfur represents the sulfur dioxide reduction benefits in the i-th year, Btnitric represents the nitrogen oxide reduction benefits in the i-th year, and λcontribution represents the contribution coefficient of the investment project in pollutant reduction, expressed as the ratio of the cost of photovoltaic power generation in the grid connection to the total production chain cost.
The reduction in carbon dioxide, sulfur dioxide, and nitrogen oxide emissions due to energy conservation and emission reduction is calculated based on coal-fired power units, as shown in Equations (19) to (21).
In the formula, Btcarbon is the carbon dioxide emission reduction benefit in the i-th year, Btsulfur is the sulfur dioxide emission reduction benefit in the i-th year, Btnitric is the nitrogen oxide emission reduction benefit in the i-th year, Qenvir is the energy-saving and emission reduction electricity in the i-th year, Qcarbon,coal represents the carbon dioxide emissions per unit of thermal power generation, Qsulfur,coal represents the sulfur dioxide emissions per unit of thermal power generation, Qnitric,coal represents the nitrogen oxide emissions per unit of thermal power generation, Ccarbon is the treatment cost per unit of carbon dioxide, Csulfur is the treatment cost per unit of sulfur dioxide, and Cnitric is the treatment cost per unit of nitrogen oxides.
4) Investment Promotion Benefits
The investment and construction of power grid investment projects have a promoting effect on the improvement of power reliability and corresponding power services, as well as the entry of users into various industries. We can use the newly added output value and input–output table of users in various industries to measure the benefits of investment attraction, as shown in Equation (22).
In the formula, Battract represents the benefits of investment and investment attraction for power grid investment projects, ΔGi represents the output value of the i-th newly added industry, vi represents the value-added coefficient of the i-th industry in the input–output table, and ei represents the power input coefficient of the i-th industry in the input–output table.
5) Reliability benefits
The typical new investment in the power grid under the new power system can increase the reliability of the power supply, thereby reducing the negative social impact caused by power shortages and reducing the loss of social benefits. It is used to measure the reliability benefits of the typical new investment in the power grid under the new power system. In this paper, we use the regional gross domestic product generated per unit of electricity as the loss coefficient of social benefits to calculate the reliability benefits created by investment projects, as shown in Equation (23).
In the formula, Breliable is the reliability benefit generated by the power grid project investment, Qtotal is the total electricity consumption of the investment area, Rt is the power supply reliability rate of the investment area in the current year, Rt–1 is the power supply reliability rate of the investment area in the previous year, and PGDP is the regional gross domestic product generated per unit of electricity.
Calculation of the Comprehensive Benefit of New Investment in the Power Grid for Distributed Photovoltaic Projects
Changes in the Benefits of Self-Built Distributed Photovoltaic Users under the New Investment of the Power Grid
The supporting investment made by the power grid ensures the effective promotion of distributed photovoltaics. Self-built distributed photovoltaic users use photovoltaic power generation for their own production and daily use, as well as selling surplus energy, in order to reduce electricity costs and bring economic benefits to users. In addition, the investment in supporting the power grid has also improved the reliability and efficiency of users’ electricity consumption. Therefore, a benefit model for self-built distributed photovoltaic users has been established, as shown in Equations (24) to (28):
In the formulas, BtYH represents the added benefits of users in year t, Btreliable represents the reliability benefits of users in year t, and BtZJ represents the economic benefits of users in year t. BtZJ represents the economic benefits of self-built distributed photovoltaic users in year t, BtJS represents the electricity costs saved by self-built distributed photovoltaic users in year t, BtSD represents the electricity sales revenue of self-built distributed photovoltaic users in year t, PBT represents the electricity price of government-subsidized distributed photovoltaic power generation projects, and CtPV represents the construction cost of self-built distributed photovoltaic users in year t. QtPV represents the self-built distributed photovoltaic self-consumption in year t, Pe represents the electricity price corresponding to the voltage level of one user, Qt'PV represents the excess photovoltaic power generation excluding self-consumption in year t, PSW represents the grid electricity price, and BtBT represents the government subsidy income in year t.
Changes in the Benefits of Power Generation Enterprises under the New Investment in the Power Grid
New investment in the power grid can increase the sales efficiency of power generation enterprises on the power supply side. Under the new power system, a profit model for power generation enterprises is established by combining the sales revenue of power generation enterprises and the green certificate trading revenue of new-energy power generation enterprises, as shown in Equations (29) to (31):
In the formulas, BtED represents the total benefits of the power generation enterprise in year t, BtSD represents the sales benefits of the power generation enterprise in year t, BtLZ represents the green certificate transaction revenue of the new-energy power generation enterprise in year t, CtFD represents the cost of the power generation enterprise in year t, QtSD represents the electricity sold by the power generation enterprise in year t that is more than the previous year, PSW represents the grid electricity price, QtLZ represents the number of green certificates sold by the new-energy power generation enterprise in year t, and PtLZ represents the unit price of green certificates in year t.
Results and Discussion
According to the large-scale development of distributed photovoltaics in a certain province of China in 2022, the majority of distributed photovoltaics in the region are fully connected to the grid and have a surplus, while a small portion are fully self-used, with a total scale of over 4.65 million kW. Before the promotion of distributed photovoltaic projects, both residents and agricultural users directly purchased electricity from the power grid and used it. Large industrial users directly participated in market transactions, while small industrial and commercial users chose to purchase electricity through power grid agents or directly participate in market transactions. However, after the construction of distributed photovoltaics, users can use distributed photovoltaics to generate electricity for their own use, thereby reducing power grid purchases. In the example analysis, it is assumed that the proportion of distributed installed capacity for different voltage levels is 4:4:2, and the electricity trading of distributed photovoltaics adopts the acquisition mode. The power grid purchases the online electricity from distributed photovoltaics at a regional acquisition price of 0.45 yuan/kWh, as shown in Table 1.
Under distributed photovoltaic construction, users generate different benefits through the full self-use mode, spontaneous self-use margin online mode, and full online mode. In the full self-use mode, distributed photovoltaics do not generate online electricity, and are fully self-used. In this mode, the economic benefits of users are electricity cost savings. However, due to the inconsistency between photovoltaic output and user energy consumption, power abandonment may occur. Under the spontaneous self-use surplus grid-connection mode, a portion of the power generated by distributed photovoltaic stations meets users’ energy needs, while the remaining electricity is acquired and connected to the grid, resulting in electricity cost savings and electricity sales revenue. Under the full grid-connection mode, distributed photovoltaic power generation is not used to meet users’ self-use, and full acquisition of grid connection generates electricity sales revenue, as shown in Table 2.
Table 1.
Installation scale and annual power generation of distributed photovoltaic systems in different modes.
Table 2.
Economic benefits of distributed photovoltaic users under different online modes.
Table 3.
Investment situation of distributed photovoltaic supporting power grid.
| Unit | 35~11 kV | 1~10 (20) kV | <1 kV | |
|---|---|---|---|---|
| Investment cost of power grid | 10,000 kWh/year | 30,126.15 | 38,986.78 | 23,923.70 |
After the completion of distributed photovoltaic power generation, users can use distributed photovoltaic power generation in three modes, which can be divided into two parts according to self-use and grid connection. The spontaneous self-use electricity part refers to the part where users meet their energy needs through distributed photovoltaic power generation, and no longer need the grid to provide this part of the transfer of electricity. However, in order to facilitate the consumption of distributed photovoltaics and provide users with safe and reliable services, the power grid still needs to make relevant supporting investments, as shown in Table 3.
The investment in supporting the power grid under the promotion of this distributed photovoltaic project mainly solves the problem of grid connection for photovoltaic power generation, while also promoting the utilization of clean energy, effectively driving the economy and employment. Therefore, the social benefits of supporting investment in the distributed photovoltaic project power grid mainly comprise environmental benefits, driving economic benefits, and promoting employment benefits.
1)Environmental benefit calculation
The investment in supporting the power grid provides support for the consumption of distributed photovoltaics, achieving energy conservation and emission reduction through higher consumption of renewable energy. Calculated based on the annual electricity output from photovoltaic power generation, the energy-saving and emission-reduction electricity due to distributed photovoltaics is shown in Table 4.
Based on the environmental benefits of distributed photovoltaic annual energy conservation and emission reduction, and unit energy conservation and emission reduction, the annual environmental benefits brought by grid supporting investment under distributed photovoltaic construction were calculated. The environmental benefits are shown in Table 5.
2) Calculation of driving economic benefits
Based on the driving economic benefit model of typical power grid investment projects under the new power system, the project investment was decomposed. According to the investment classification of various national economic industry categories, the investment amount of distributed photovoltaic power grid supporting investment in various national economic departments was obtained, as shown in Table 6.
Based on the consumption of typical grid investment projects in various sectors of the national economy under the new power system, the added value of distributed photovoltaic projects directly driving and fully driving various sectors of the national economy was calculated, as shown in Table 7 and Table 8.
Table 5.
Annual environmental benefits brought by investment in supporting distributed photovoltaic power grids.
Table 6.
Decomposition of investment projects for distributed photovoltaic power grids into various national economic departments.
Table 7.
The situation where investment in supporting distributed photovoltaic power grids directly drives various sectors of the national economy.
Table 4.
Distributed photovoltaic annual energy-saving and emission-reduction electricity.
| Project | Unit | 1~10 (20) kV |
|---|---|---|
| Photovoltaic installed capacity | 10,000 kW | 465.43 |
| Annual illumination time | hour | 1,160 |
| Distributed photovoltaic power generation | 10,000 kWh/ year | 539,897.31 |
Table 8.
The situation where investment in supporting distributed photovoltaic power grids fully drives various sectors of the national economy.
Table 9.
Direct promotion of employment through investment in supporting distributed photovoltaic power grids.
| Project | Unit | Numerical Value |
|---|---|---|
| Total project investment | 10,000 yuan | 513,916.61 |
| Proportion of labor costs | % | 3.44 |
| Average wage | yuan | 71,724 |
| Directly promoting employment numbers | Number of people | 446 |
Under the promotion of distributed photovoltaic technology, the annual supporting investment of the power grid reached 93.036 million yuan, directly driving economic benefits of 23.055 million yuan, and fully driving economic benefits of 94.527 million yuan.
3) Promoting employment benefits
The fixed-asset investment construction of power grid enterprises will directly and indirectly drive the development of related industries and promote social employment, as shown in Table 9.
The above analysis shows that under the promotion of distributed photovoltaics, the power grid not only needs to bear the investment and construction of supporting facilities, but its electricity sales business is also affected by the increase in the self- consumption of distributed photovoltaics, resulting in a decrease in electricity sales revenue. That is, the economic benefits of supporting investment in the power grid are negative. However, under distributed photovoltaics, supporting investment in the power grid enables users to obtain higher economic benefits, which plays a great role in energy conservation and carbon reduction. It has also driven economic development and promoted employment, with significant social benefits.
Conclusions
In this study, we first classified new investment in the power grid under a new power system based on investment drivers and functions, and then established a comprehensive benefit model for the entire life-cycle based on typical investments. Social benefits were proposed based on the perspectives of power generation enterprises, users, and the whole of society, which may generate the main economic benefits, reliability benefits, environmental benefits, driving economic benefits, and promoting employment benefits. An empirical analysis was conducted around the typical scenario of distributed photovoltaic promotion, and it was concluded that supporting investment in the power grid under the promotion of distributed photovoltaics has increased the economic benefits of distributed users in three modes: full self-use, self-use surplus grid-connection, and full grid-connection. Supporting such investment also promotes the consumption of renewable energy and reduces the emission of carbon dioxide, sulfur dioxide, and nitrogen oxides, resulting in environmental protection benefits. In addition, investment in supporting the power grid under the promotion of distributed photovoltaic technology has directly and indirectly driven economic development, promoted employment, and provided social benefits to varying degrees.
This study mainly considers the investment efficiency of power grids from a macro perspective at the provincial power grid level. Given that different levels of power grids, such as provincial-level, prefecture level, and county-level, have different considerations, the evaluation index system and method for power grid investment efficiency constructed in this article have some problems such as algorithm reliance on empirical guidance. In addition, under strict regulatory policies for transmission and distribution business, the investment structure, investment timing, and investment constraints of the power grid will all affect the investment efficiency of the power grid. This study did not consider the correlation between investment efficiency and transmission and distribution electricity prices, and future related research still needs further refinement.

