

Introduction
China has made significant progress and rapid economic growth through reform and opening up over the past forty years. However, the country continues to face several challenges, including a sharp increase in resource consumption, severe environmental pollution, and abnormal climate fluctuations [1, 2]. In 2022, China’s total energy consumption reached 5.41 billion tons of standard coal, up by 2.9% from the previous year. Furthermore, the 2022 BP Statistical Review of World Energy reports that China’s carbon emissions in 2021 were 10.523 billion tons, accounting for 31.1% of total global carbon emissions [3]. Being a responsible global country, the Chinese Government recognizes the crucial role of ecological civilization in driving economic growth. The government’s consistent emphasis on “protecting the ecological environment to safeguard productivity” is complemented by a series of policies to improve energy efficiency, reduce emissions, and promote the adoption of green technologies. China has also actively participated in global cooperation to address environmental challenges and contributed towards creating a sustainable future. To achieve high-quality development, China needs to adopt sustainable and green development strategies while managing increasingly tight resources and environmental challenges. The report of the 20th National Congress of the Communist Party of China also highlighted that “promoting the green and low-carbon development of economic and social development is a crucial link in achieving high-quality development.” The industry serves as the foundation of high-quality economic growth, and therefore it is a critical need to strengthen technological innovation, establish a modern green industrial system, and promote the transformation of traditional industries and the upgrading of green and low-carbon industries. In order to achieve this goal, there is a critical need to focus on strengthening technological innovation, establishing a modern and green industrial system, and promoting both the green transformation of traditional industries and high-quality development of green and low-carbon industries. The digital economy plays an important role as an engine for boosting green high-quality development of industries. The digital economy’s advantages in high technology, high growth, and high cleanliness offer new opportunities for driving the development and transformation of industries towards a green, clean, digital and intelligent system. The green high-quality development of industries widens the application scope and opportunities for the digital economy. Both development aspects complement and augment one another in the overall process, requiring coupling coordination, and coexistence.
The Yangtze River Economic Belt serves as a pivotal bridge between the eastern and western regions of China, distinguished by its abundant resources, industry-intensive economic area and the most advanced digital economy infrastructure in the country, this belt has emerged as the epicenter of China’s flourishing digital economy industry. The coordination level of digital economy and green high-quality development of industries not only impacts the sustainable development but also affects the consistent implementation of China’s regional strategy. Therefore, this article analyzes the correlation, current situation, and factors of coordination between digital economy and green high-quality development of industries in the Yangtze River Economic Belt. It aims to offer valuable insights and recommend strategies for facilitating the region’s green high-quality development of industries.
Literature Review
“Digital economy” was introduced by Professor Don Tapscott, who focused on the convergence between the information and communication industry and e-commerce [4]. Subsequently, scholars and institutions expanded the scope to include the application of information technology in various economic and social fields, production and business activities in the network space [5-7]. Information technology serves as the backbone of the digital economy and provides necessary basic guarantees to introduce digital transformation across industries. This shift has resulted in improved operational methods and efficiency [8-10]. Particularly, there are certain green characteristics in the platform and sharing economies [11-13]. However, it is important to pay close attention to the differences and fluctuations in how enterprises adopt digital technology. Scholars in China have a comprehensive understanding of the digital economy [14-16], covering aspects such as digital industrialization, industrial digitization, and governance digitization [17, 18]. The definition of the digital economy at the G20 Hangzhou Summit (2016) is now widely accepted and frequently referenced. Many quantitative studies use traditional research tools and methods to measure the impact of the digital economy from a national or regional perspective [19-22]. The OECD considers the supply, demand, infrastructure, products, and content of ICT [23], while the European Commission constructed the “Digital Economy and Society Index” to measure the impact of digitalization on the economy and society [24]. In China, there are two recognized approaches to measuring the digital economy: the comprehensive measurement that includes digital infrastructure, media, and transactions [25], and the broad-caliber measurement that considers core industries and industrial digitization [26]. As for the governance of the digital economy, there are various collaborative governance concepts. Du proposed a collaboration model that integrates relationship, subject, and mechanism collaboration [27]. Japan and the United Kingdom have employed taxation to control the behavior of digital enterprises, while China’s digital government has enhanced the capabilities of digital governance [28].
The concept of green development is derived from research on green and ecological economy. It is a new developmental model that prioritizes natural environment protection while adhering to ecological and resource capacity constraints, guided by the principles of sustainable development [29]. The core of green development involves the coordination and interactivity of the economy, nature, and society [30, 31]. Green development of industries is a response directed at green development on the industry level [32]. Most scholars typically focus on investigating theories, development mechanisms, approaches, and regional differences of green development within various fields such as agriculture, industry, manufacturing, energy, modern services, construction, and other sectors on a national or regional level. The industrial green development and innovation is contingent on various factors, such as the enterprise’s scale, economic benefits, inter-enterprise cooperation, and environmental regulations [33-35]. Regarding empirical research, many scholars adopt various research methods to evaluate green Total Factor Productivity (TFP) or comprehensive green development indicators, including the entropy weight method, principal component analysis, and the SBM-Malmquist model. They advocate for planned, policy-guided, and standardized governance approaches towards developing industrial green practices that prioritize sustainable growth [36, 37].
Amidst the new era of high-quality development, green development of industries aligns with the five critical concepts of “innovation, coordination, green, openness, and sharing” underpinning high-quality development [38]. The green high-quality development of industries combines the principles of industrial green development and high-quality development, with a focus on achieving goals in a circular, ecological, and green economy. The underlying objectives are to promote coexistence among industrial, ecological, and social practices. The digital economy is widely recognized as a key driver of high-quality economic growth [39]. Recent scholars have examined the correlation in three principal aspects. Firstly, combining digital and green technology can improve innovation levels of green technology, promote the conversion of traditional economies [40], and optimize industrial structure to enhance energy efficiency [41]. Secondly, With the help of the digital economy, we can quickly, accurately, and effectively collect information related to ecological and environmental protection. This facilitates the digital tracking and detection of various links, including R&D, design, production and manufacturing, logistics , and recycling. This approach improves the precision and efficiency of monitoring and managing energy and carbon emissions [42, 43]. Thirdly, digital public platforms facilitate residents to share concepts and ways of green living [44], rapidly and accurately allocate supply and demand information, lower the cost of green development, and optimize the industrial structure [45]. Additionally, the improvement of residents’ digital literacy can increase digital supply and change the structure of energy consumption [46]. Green development also has implications for the digital economy. It can encourage carbon reduction of digital economy infrastructure, which would ultimately lead to green digital transformation within industries [47]. In terms of the coordination of both, scholars believe that obstacles in usage need to be overcome, it is possible to achieve organic unity between the two by synergizing technology, industry, and concepts, allowing for mutual permeation and coordination [48].
In summary, scholars have made significant contributions to the fields of the digital economy and green industrial development. This article’s potential contributions are: (1) analyzing the coupling coordination mechanism between the digital economy and green high-quality development of industries, and laying the theoretical foundation for coupling coordination approaches; (2) utilizing the coupling coordination model, spatial autocorrelation model, and Tobit model with fixed and random effects to study the spatiotemporal characteristics, spatial correlation, and influencing degree of major factors on coupling coordination. This will provide practical guidance for exploring coupling coordination pathways between the two systems.
Material and Methods
Construction of Indicator System
The green high-quality development of industries emphasizes the high-end level of industrial green development, which mainly includes two aspects: the green and low-carbon transformation of traditional industries and the high-quality development of green industries. The transformation of traditional industries to green and low-carbon production signifies a synergy between the green and low-carbon technology innovation and industrial upgrading [49]. This aims to achieve a shift from scaling up to structural upgrading and from resource-driven to innovation-driven practices. Green high-quality industry development is characterized by four fundamental dimensions, “high economic efficiency, reasonable structure”, “high resource utilization rate”, “low emissions and low pollution”, and “circular development”. The concept highlights the significance of resource circulation and interconnected symbiosis among various industries, including local and regional industries, facilitating the evolution of industries from the lower to the mid-to-higher value levels. This process facilitates a shift from energy-intensive, pollution-heavy, and high-emission production models to low-energy-consumption, low-pollution, and low-emission operations.
In the index system of industrial efficiency and structure, the rationalization of industrial structure reflects the degree of effective utilization of industrial resources and the degree of coordinated development between industries. This article adopts the New Theil Index (defined by Gan et al.) to measure the rationalization of industrial structure, as follows:
Table 1.
The Index System of Green High-quality Development of Industries and Digital Economy in the Yangtze River Economic Belt.
In which, n denotes the number of industries, Yi denotes the i industrial output value, Y denotes GDP, Li represents the number of employees in the i industry, and L represents the total number of employees. NTL = 0, It indicates that the economy is in a balanced state, with the most reasonable industrial structure; If NTL0 ≠ 0, it indicates that the economy has deviated from an equilibrium state and the industrial structure is unreasonable; Therefore, it is a reverse indicator, and the lower the index value, the higher the rationalization degree of the industrial structure [50]. The upgrading of industrial structure refers to the process of continuously evolving industrial structure from low to high levels, measured by the proportion of output value of the second and third industries to GDP. The larger the value, the higher the level of industrial structure [51].
The digital economy indicator system has been constructed, referring to the research of Liu et al. [52]. The system will be built around three critical factors: digital basic conditions, Digital innovation, and digital applications. Digital infrastructure will serve as a foundation for promoting industrial development, which includes both traditional infrastructure and new infrastructure. Digital innovation will play a decisive role in enabling industrial structural transformation through innovation input and output. digital applications will encompass two fundamental aspects, namely digital industrialization and industrial digitization, thereby facilitating the smooth transition to a more sustainable and eco-friendly future (see Table 1).
The above indicators are assigned weights based on the entropy method, a commonly adopted research methodology used by scholars. As the method has been thoroughly discussed and explained in previous literature, this study does not delve into its detailed calculation process. For a comprehensive understanding of this approach, interested readers may refer to earlier works by Wang. et al. [53], where the application and rationale of the entropy method in research are elucidated in greater detail.
Data Source and Processing
This research assesses the extent of 11 provinces and cities in the Yangtze River Economic Belt from 2008 to 2021. The raw data used was obtained from various reliable and established statistical sources, including the China Statistical Yearbook, China Science and Technology Statistical Yearbook, China Environmental Statistical Yearbook, China Energy Statistical Yearbook, and ESP Database.
Research Method
(1) Coupling Coordination Mode. The dynamic interplay and level of coordination between these subsystems can be quantified through the measure of coupling coordination model [54]. To begin with, we embark on constructing a coupling degree model through the incorporation of the notion of physical capacity coupling. Subsequently, we proceed to quantify the coupling degree denoted by C and undertake a comprehensive analysis of the mutual influence between the subsystems. This is of great significance in distinguishing the intensity of the two systems’ actions and the order of early warning development.
Wherein, Ug and Ud respectively represent the comprehensive scores of the green high-quality industry development and the digital economy. The value range of C is 0-1, and the larger its value, the better the coupling between Ug and Ud, and the stronger the interaction between the two systems; The smaller C, the worse the coupling between Ug and Ud, and the weaker the interaction between the two systems.
Subsequently, the formulation of a coupled coordination model becomes imperative. While the coupling degree can adequately assess the level of interaction and influence between two systems, it cannot indicate the development level of each system itself. It is plausible to encounter situations where the development level of two subsystems is relatively low despite a remarkably high degree of coupling. Hence, relying solely on the degree of coupling is insufficient in determining the coordinated relationship concerning the development of two systems. Refering to the research conducted by Cong X.N. et al., this study adopts a coupling coordination degree model to further gauge the degree of coupling coordination between the digital economy and green high-quality industry development. By employing the coupling coordination degree, the model reflects the progression of the system from disorder to order, thereby presenting the level of fruitful and harmonious coupling coordination between the systems. Furthermore, It can not only reflect the development level of each subsystem itself, but also reflect the degree of interaction between systems [55]. The formula is:
Among them, T represents the comprehensive evaluation index between the green high-quality industry development and the digital economy, T = a1Ug + a2Ud, a1 and a2 signify the significance of the two subsystems, a1 + a2 = 1. It is generally acknowledged that both subsystems are of equal significance in coupling coordination, which implies that a1 = a2 = 0.5. The greater the value of D, the more robust the coupling coordination.
Indeed, while the coupling coordination model serves as a comprehensive measure of coordination, it falls short in capturing the relative development status of the two systems involved. To address this limitation, this study follows the research methodology proposed by Chen et al. and integrates the relative development degree model. By employing this model, the relative development coefficient of the two systems is calculated [56]. This enables the identification of potential issues and deficiencies pertaining to the coupling coordination between the digital economy and green high-quality industry development in the Yangtze River Economic Belt.
Among them, R represents the relative development degree. In order to more directly reflect the coupling coordination status of digital economy and green high-quality industry development in the Yangtze River Economic Belt, this article refers to the relevant research of Bi et al. [57] and Gai [58] to divide the intervals and levels of coupling coordination (see Table 2).
(2) Spatial Autocorrelation Model. Spatial autocorrelation is an important form of spatial dependence, which refers to the spatial correlation of the research object. It is commonly classified into global spatial autocorrelation and local spatial autocorrelation. Global spatial autocorrelation primarily scrutinizes the extent of spatial correlation and spatial disparities across an entire region, typically assessed through the application of the Global Moran’s I. Local spatial autocorrelation is predominantly employed to analyze the distribution pattern of research objects within a heterogeneous space. This analytical technique facilitates the measurement of local spatial correlation between each region and its surrounding areas, often denoted by the Anselin Local Moran’s I. The value of the index ranges from -1.0 to 1.0. A Global Moran’s I index exceeding 0 indicates a positive correlation in the coupling coordination degree of different provinces, with clustering trends.Conversely, a Global Moran’s I index less than 0 suggests a negative spatial correlation among different provinces.The smaller the index value, the greater the spatial variation between provinces and cities.When the Global Moran’s I index is equal to 0, it signifies the existence of spatial randomness. An Anselin Local Moran’s I above 0 signifies that regions with high or low coupling coordination are surrounded by areas holding similar high or low values.In contrast, an Anselin Local Moran’s I index less than 0 indicates that regions with high or low coupling coordination are surrounded by areas with contrasting low or high values. The calculation formula used is:
In the formula, the variable n denotes the total number of provinces, which in this article is 11. The variable m refers to the number of neighboring provinces in any given province. wij is the spatial weight, when i province is adjacent to j province, wij = 1, and when i province is not adjacent to j province, wij = 0.Furthermore, the variables Di and Dj denote the coupling coordination degree in i and j provinces. D̅ denotes the average values of these degrees. S2 represents the variance.
(3) Random-effects Tobit model. The random-effects panel Tobit model is adopted for estimation due to two reasons. Firstly, when the number of cross-sectional data in the three regions of the upstream, middle, and downstream is too small, the spatial weight matrix may be scaled down, leading to inaccurate model estimation results. Secondly, the coupling coordination degree is limited to 0-1. There may be biases by using traditional OLS estimation parameters [59]. Therefore, the Tobit model can be used to measure the influencing factors of coupling coordination degree. The model can be expressed as follows:
Table 2.
Division intervals and states of coupling coordination degree.
Wherein, Dit represents the level of coupling coordination. α0 denotes a constant value. The coefficient αi represents the influence degree of the factors on the coupling coordination. δit represents the random interference.
Results and Discussion
Characteristics of Spatio Temporal Evolution
As depicted in Fig. 1, the relative development degree of the two systems exhibits changing trends. Notably, the digital economy has attained a relatively high level of development, particularly following China’s elevation of the Yangtze River Delta integration development strategy to a national strategy in 2018. Focusing on the two key factors of integration and high-quality, a series of policy documents such as the “ Digital Economy Five Year Doubling Plan in Zhejiang Province” have been issued, which have planned and guided the development of the digital economy from different perspectives, supporting the better and faster development of the digital economy in various provinces. Conversely, the industries within the middle and upper reaches of the Yangtze River Economic Belt are predominantly reliant on labor-intensive processes and exhibit substantial natural resource consumption. These industries engender a relatively high level of environmental damage, thus impeding the overall level of green development within the industrial sector. Consequently, the green high-quality development of industries lags behind the progress achieved in the digital economy. However, despite this disparity, it is noteworthy that the average growth rate of green high-quality development is outpacing that of the digital economy. This dynamic results in a gradually ascending trend in the relative development degree, albeit at a slow pace.
Fig. 2 presents the overall and regional evolution of coupling and coordination between the two systems. During the investigation period, the coupling degree of both subsystems exceeded 0.87, indicating that they were in a highly coupled state with a strong degree of mutual influence. The two subsystems were in the initial phase of coupling coordination, and the degree of coordination showed a slow upward trend, with a noteworthy increase observed after 2016. This can be attributed to the elevation of ecological and environmental issues to a top priority by the national government in 2016, promoting green, innovative, and coordinated development in the provinces of the Yangtze River Economic Belt. Nevertheless, the degree of coupling coordination was markedly lower than the degree of coupling, implying that additional efforts are needed to optimize the coordination relationship of the two subsystems.
After evaluating the degree of coupling, and degree of coupling coordination in the upstream, midstream, and downstream areas of the Yangtze River Economic Belt, a pattern of “high in the east and low in the west” has been observed (Fig. 2). It is important to note that the upstream region includes Guizhou, Sichuan, Yunnan Province and Chongqing City, the midstream region includes Anhui, Jiangxi, Hubei, Hunan provinces, and the downstream region includes Zhejiang, Jiangsu provinces and Shanghai city. From 2008 to 2010, the coupling coordination degree in the upstream regions was slightly higher than that in the midstream regions. However, since 2011, the midstream regions have demonstrated advantages in the digital economy, surpassing the upstream regions. The downstream regions have an absolute advantage in terms of economic development, infrastructure, resource access, and policy support, which has improved the overall level of coupling coordination. Before 2011, the middle reaches of the region experienced rapid economic growth, with a focus on agriculture in the upstream regions, particularly in Yunnan and Guizhou. The level of green development in the upstream regions was comparatively superior to that in the middle regions due to their predominantly agrarian characteristics. Nonetheless, Chongqing, being a significant industrial sector in China, exhibited sluggish advancements in eco-friendly industrial development, impeding the level of coordination in the upstream areas. Therefore, it is imperative to expedite the progress of sustainable green industrial development through the digital economy’s dividends. This would improve the overall synchronization of the digital economy with the eco-friendly industry, thus boosting coordination.
Fig. 1.
Relative development degree of digital economy and green high-quality development of industries in the Yangtze River Economic Belt.
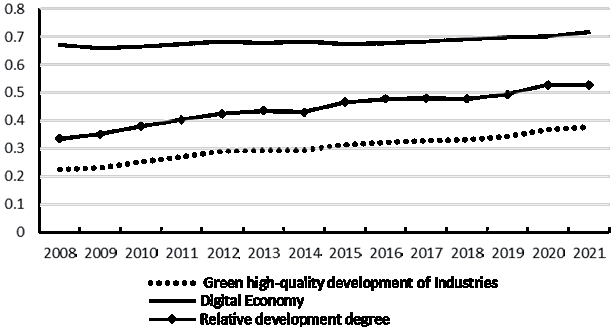
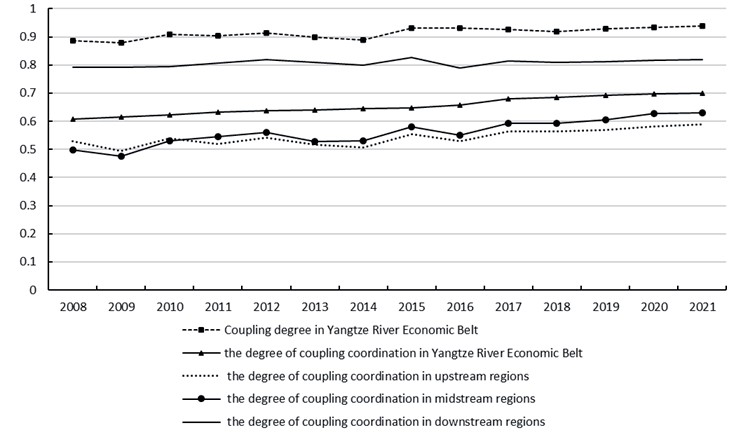
Table 3.
Results of Global Moran’s I.
The Spatial Correlation of the Coupling Coordination
Global Spatial Autocorrelation
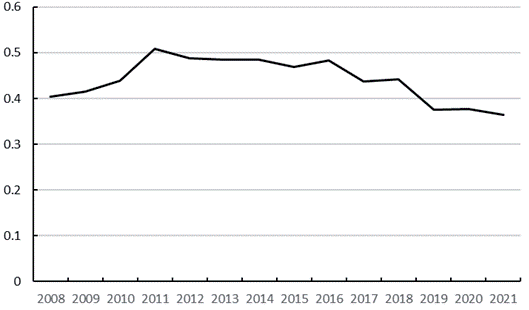
This article utilizes the StataMP16 software for spatial autocorrelation analysis. The Global Moran’s I of the coupling coordination degree from 2008 to 2021 can be observed from Table 3. The Global Moran’s I exceeded 0, with a P-value less than 0.01 and a Z-value higher than2.3, the 1% significance test was passed. It indicated a significant positive spatial autocorrelation of the coupling coordination degree. However, the Global Moran’s I value demonstrated an upward-downward trend over time from Fig. 3. During the period from 2008 to 2011, the spatial concentration of coupling coordination was low, as the economic growth of each province became increasingly fragmented and the ecological environment suffered severe damage. Since the 18th National Congress of the Communist Party of China, the Yangtze River Economic Belt has once again been prioritized as a critical national development strategy, signaling a renewed commitment to promoting regional integration and sustainable development. While provinces prioritize the advancement of the digital economy, they emphasize ecological priority and green ecological development. The spatial agglomeration degree of coupling coordination showed an upward trend. However, since 2011, the Global Moran’s I index has been indicating a downward trend, reflecting a gradual weakening in the spatial correlation and the spatial agglomeration degree of provinces. This trend may be attributed to a siphoning effect driven by the strengthened economic power of provinces such as Sichuan, Hubei, and Chongqing, which have been attracting funds, human resources, and other resources from neighboring regions, leading to greater gap between provinces within the region [60]. Meanwhile, all provinces and cities have recognized the importance of digital infrastructure and the profound connection between the digital economy and the green development of industries. Consequently, the general coupling coordination has improved, while the spatial agglomeration has weakened.
Local Spatial Autocorrelation
Local spatial autocorrelation serves as an indicator of the regional spatial agglomeration and evolutionary characteristics of coupling coordination. Utilizing this approach, the clustering arrangement can be classified into four quadrants. These include the high-high clustering area (H-H) in the first quadrant, the low-high clustering area (L-H) in the second quadrant, the low-low clustering area (L-L) in the third quadrant, and the high-low clustering area (H-L) in the fourth quadrant. Table 4 provides a visual representation of the results.
The H-H clustering area denotes those provinces with high levels of coupling coordination that are situated in close proximity to other similarly high-performing provinces, creating a mutually supportive effect. Based on our three-stage investigation, Shanghai, Zhejiang, and Jiangsu provinces have consistently led the way in terms of improving their coupling coordination, thanks to their robust adoption of digital technology and their environmentally conscious approach to industrial development. However, the remaining provinces have yet to catch up to this agglomeration area, thereby limiting the radiation effect that downstream regions might otherwise have enjoyed.
The L-H cluster area is characterized by provinces with relatively low levels of coupling coordination, neighboring with other provinces and cities that enjoy relatively higher coupling coordination levels, resulting in a negative local spatial correlation. Anhui province and Jiangxi province have been consistently located in this cluster area, as indicated in Fig. 3. This phenomenon may be attributed to the fact that these two provinces are adjacent to Shanghai city, Zhejiang and Jiangsu provinces, which are more advanced. As a result, they tend to attract talents, funds, and technology away from Anhui and Jiangxi provinces, which set off a chain reaction of resource losses that negatively impact the overall improvement of local coupling coordination, leading to the formation of a valley region in terms of their overall development trajectory.
Table 4.
Spatial Agglomeration of the Coupling Coordination.
The L-L cluster area is characterized by provinces with low levels of coupling coordination with surrounding provinces. Chongqing City, Hubei, Hunan, Guizhou, and Yunnan provinces were located in this region in both 2008 and 2014. In 2021, Chongqing City, Hunan, Guizhou, and Yunnan Provinces still belong to this cluster. The Chengdu-Chongqing region is acknowledged as a development core of the digital economy and a catalyst for the green development of industries in China, thanks to its strong foundation in the digital economy and its continued growth momentum. However, Chongqing’s heavy reliance on traditional industries due to its heavy industrial structure has limited the potential for coupling coordination between industrial green development and digital economy. On the other hand, Hunan Province has shown some improvement in green industrial development, thanks to its relatively rich pool of universities and robust transportation resources. However, its development mode remains overly reliant on traditional industries, and its innovation ability still needs to be enhanced. Finally, the insufficient policy support and significant economic disparities between Guizhou ,Yunnan provinces and downstream regions are the primary reasons for resulting in low coupling coordination. For instance, insufficient support for enterprise innovation capabilities, inadequate financing for green industrial development, and other such factors continue to hamper their progress.
The H-L cluster area is characterized by provinces with elevated levels of coupling coordination, while surrounding provinces exhibit relatively lower levels in this regard. During the inspection period, Sichuan Province has consistently been located in this agglomeration area, while Hubei Province transitioned to this area in 2021 from the L-L cluster area. Sichuan Province, endowed with copious water resources, is a significant clean energy province in China. Sichuan has actively and effectively promoted the growth of the digital economy over the years, strengthened the green foundation of this sector, and continually unleashed the potential of data elements, becoming the center of the “East Counting and West Counting” project in China. It has attracted numerous factor resources from the neighboring low-coupling regions, enabled the digital transformation of conventional industries, and fostered the green development of industries. On the other hand, Hubei Province has a rich pool of science and education resources, along with a robust industrial foundation. It has led the green high-quality development of industries through the digital economy, initially established a green manufacturing system, and continuously improved the green development mechanism. As a result, the coupling coordination degree has markedly advanced.
Examination of Influencing Factors on Coupling Coordination
The coupling coordination between the digital economy and green high-quality development of industries is a complex, dynamic, and systematic process, which is a comprehensive result of the mutual influence of many factors. The evaluation indicators established earlier in this article primarily encompass endogenous factors, serving primarily for the construction and measurement of the coupling coordination system. Conversely, the influencing factors mainly consist of exogenous variables, designed primarily for empirical testing of coupling coordination. Referring to the relevant research results on the influencing factors of digital economy and green development, the following influencing factors are selected for empirical research.
Economic development. Economic development can be quantified using the natural logarithm of per capita gross domestic product (LN(PGDP)). Economic development allows the government to invest more labor force, finance, and resources in technological innovation, infrastructure construction, and other aspects, enhancing residents’ demand for the environment and quality of life, leading to green development of industries and improving the level of coupling coordination [61].
Finance(Fin). Finance represents the cornerstone of a country’s high-quality development [62], quantified by the proportion of total institutional deposits and loans to regional GDP at the end of the year. The direction of financial development effectively guides the agglomeration of production factors in green and circular industries, accelerating the effective allocation of social resources.
Opening up to the outside world(Open) is a fundamental national policy of China, quantified by the proportion of total import and export to GDP. A high level of openness to the outside world fosters collaborative innovation, and attracts advanced factors of production from abroad. This effectively bolsters the core competitiveness of industries, paving the way for industrial transformation and upgrading.
Fiscal Support (FS) is measured by the proportion of year-end budget fiscal expenditure to regional GDP. The digital economy and green development of industries cannot do without strong support from fiscal funds. Government subsidies and special funds play an indispensable role in facilitating infrastructure construction, fostering key technological breakthroughs, and improving the ecological environment. With adequate financial support, these initiatives are driven forward, ultimately enhancing the coupling coordination between the digital economy and the development of green industries [63, 64].
Urbanization level (Urban) is quantified by the proportion of urban population to the total population. Urbanization is an ongoing process in which a large number of rural populations gradually migrate to urban areas. This migration contributes to the concentration of population, thereby granting ample market room for the coupling coordination of digital economy and industrial green development. However, it also exacerbates the degradation of the ecological environment [65]. Careful management and sustainable practices are crucial to mitigate these environmental impacts while ensuring the successful coupling coordination of the digital economy and the green development of industries.
We employed a random effects Tobit model to scrutinize the impact of economic development, financial level, opening up to the outside world, fiscal support, urbanization level on the coupling coordination of the entire sample of the Yangtze River Economic Belt, along with the upper, middle, and lower regional subsets. The estimated results presented in Table 5 show a significant LR test outcome for both the entire sample as well as the upstream and midstream regional regression models. However, the LR test result for the downstream regression model was nonsignificant. Therefore, to account for this finding, we utilized a panel Tobit mixed regression model instead, which provided statistically significant results after testing.
Our regression results revealed several key findings. First, the coefficient of economic development has a positive impact, with the highest influence observed in the downstream regions and the least influence in the upstream regions.This indicates that a strong level of economic development not only acts as a primary driving force for enhancing the overall coupling coordination between the digital economy and the green high-quality development of industries in the Yangtze River Economic Belt across the upstream, middle, and downstream regions but also effectively promotes the regulation and allocation of various elements within this coordination. Additionally, economic development fosters greater environmental awareness among residents and provides support in terms of funding, talent, technology, and management for the development of the digital economy and green technological innovation. Notably, the downstream regions, including Shanghai, Zhejiang, and Jiangsu, exhibit higher levels of economic development, while the upstream regions, such as Yunnan, Guizhou, Chongqing, and Sichuan, demonstrate comparatively lower levels of economic development. Therefore, it is crucial to promote regional economic cooperation and bolster the driving role of the downstream regions on the upstream and midstream provinces and cities. These initiatives serve as imperative measures for fostering coupling coordination within the Yangtze River Economic Belt.
Second, the financial development significantly fosters the enhancement of coupling coordination between the upstream regions and the whole while exerting a certain restraining impact on the middle and downstream regions. Compared with the upstream regions, the middle and downstream regions have relatively abundant financial resources, they tend to inefficiently allocate these resources, potentially impeding the effectiveness of coupling coordination. Therefore, optimizing and effectively allocating financial resources across the entire Yangtze River Economic Belt is essential.
Table 5.
Tobit Regression Results.
Third, opening up to the outside world was found to significantly promote coupling coordination between the whole region, the middle and downstream regions. It has a negative impact on the upstream region, indicating that opening up to the outside world has suppressed the improvement of coupling coordination during the inspection year. This may be because the outflow of factors resulting from opening up to the outside world may have polarization effects on the upstream regions in the short term. Hence, enhancing the level of openness in the upstream regions and effectively leveraging their advantageous resources to establish growth poles are crucial for achieving coordinated development.
Fourth, our regression results also showed that the impact coefficient of local fiscal expenditure on the entire sample, upstream regions is significantly negative, while it is significantly positive for the midstream and downstream region. This indicates that fiscal expenditure can partially heighten the coupling coordination levels in the midstream and downstream region; however, it hinders progress in other regions. This may be due to the crowding out effect of private credit caused by local government financial support, which impedes the efficacious transfer of capital across regions and industries, and hinders the supply of essential elements.
Fifth, the urbanization level can promote coupling coordination in the entire and downstream regions, but it hinders development in the upstream and midstream regions. This is because current urbanization development is still highly energy-consuming and polluting, causing significant damage to green high-quality industrial development. It is difficult to address long-standing environmental damage through short-term local pollution control measures.
Conclusion
This article utilizes spatial data collected from 11 provinces and municipalities situated within the Yangtze River Economic Belt between 2008 and 2021. It takes theoretical and empirical methods to analyze the coupling coordination mechanism, spatiotemporal characteristics, spatial correlation, and influencing factors between the digital economy and green high-quality development of industries. The study yielded several key findings, which include:
Firstly, the findings reveal that the digital economy and green high-quality development of industries exhibit a high overall coupling degree within the Yangtze River Economic Belt. However, the green high-quality development of industries lags behind the digital economy. Moreover, there is a relatively high coupling coordination with a noticeable upward trend. The coupling coordination degree of the upperstream, midstream, and downstream demonstrates a distinct spatial pattern of “high in the east and low in the west”. To address these challenges, it is imperative to fully leverage the advantages of factor endowment and industrial chain agglomeration development and implement a reasonable layout and staggered development within the Yangtze River Economic Belt.
Secondly, with regards to spatial correlation, the study observed a mutual influence and interaction between the coupling. However, this spatial correlation has gradually weakened after 2011.The spatial clustering phenomenon is more obvious in regions with high coupling and coordinated development and regions with low coupling and coordinated development. To this end, it is necessary to accurately undertake industrial transfers and strengthen regional industrial chain synergistic cooperation. The upstream region has established a sound mechanism for long-term cooperation and synergistic development with the middle and lower reaches of the region through projects such as the West-to-East Gas Pipeline, the West-to-East Electricity Pipeline, and the East-to-West Digitalization and Calculation. Located in China’s hinterland, the midstream region is particularly in need of creating a green and intelligent logistics center for industries, accelerating the digital and green transformation of industries across the Yangtze River Economic Belt, and providing a key hub for industries in the downstream region to expand into a wider range of application scenarios and development space. The downstream region accelerates the deep integration of digital technologies into clean technologies, new energy development technologies, energy storage technologies, green manufacturing systems, etc., and promotes the green development of core industries towards the middle and high end through the role of technology diffusion and penetration.
Thirdly, with respect to the influencing factors, notable disparities exist in the improvement of coupling coordination levels among different regions, including economic development, financial level, opening up, fiscal expenditure of local government, and urbanization level. Economic development has a positive influence on the degree of coupling coordination, but their impact varies depending on the specific circumstance, which is consistent with Hu’s conclusion [48]. The impact of finance, opening up, and urbanization can be both positive and negative, and the degree of regional heterogeneity is significantly prominent. Therefore, there is a need to customize and precisely implement policies based on the development characteristics of each region. (1) A differentiated development strategy should be implemented to fully tap the impetus and potential for economic development in the upstream and midstream regions. (2) Expanding the degree of opening to the outside world, accelerating the construction of a smooth domestic and international double-circle market, expanding market green demand, and stimulating the economic vitality of the central region.(3) Increase financial support, and be wary of the crowding-out effect of government financial spending on private credit. (4) Strengthen the top-level design, guide the flow of capital from the downstream region to the upstream and midstream regions through policies, and improve the efficiency of financial resource allocation.

