

Introduction
Environmental regulation (ER) is a policy tool used by governments to safeguard the environment and foster sustainable development, and it affects the business operations and financial outcomes of enterprises. As a developing country with a high level of development, China is confronted with severe environmental problems and the need for economic transition [1]. In response to these challenges, the Chinese government enacted an environmental protection law in 2015, which sets higher environmental criteria and stricter regulatory actions for enterprises that cause severe environmental damage. These enterprises include the iron, steel, petrochemical, and power industries [2]. However, before enacting the environmental protection law, these enterprises often adopted a passive or evasive attitude towards environmental issues due to the lack of government supervision and environmental awareness, leading to the growing tension between environmental issues and economic growth. Therefore, it is worthwhile to study how the NEL affects the FP of enterprises that cause severe environmental damage and the underlying mechanism of this effect, which is crucial for evaluating the policy effectiveness of the NEL, advancing the reform of the ecological civilization system in China and other countries, and achieving high-quality development.
Previous research has explored the benefits of ER from the perspectives of ER and corporate decision-making, ER and corporate performance, and the policy outcomes of the NEL. However, there is a lack of research on how the NEL influences the financial outcomes of enterprises that cause severe environmental damage, and the existing research is not thorough enough.
Based on this, this paper investigates how the NEL influences the FP of enterprises that cause severe environmental damage from a micro perspective to evaluate the NEL’s policy outcomes. The contributions of this paper are: (1) In terms of research angle, this paper selects the enterprises that cause severe environmental damage listed on China’s A-share market from 2011 to 2020 as the treatment group and the enterprises that do not cause severe environmental damage as the control group. It applies the DID model to create a quasi-natural experiment of how the NEL influences the FP of enterprises that cause severe environmental damage. It offers a novel research idea for exploring how ER influences the financial outcomes of enterprises that cause severe environmental damage.
(2) In terms of research scope, this paper examines the dynamic effects of policy shocks and analyzes the mechanism from the aspects of financing constraints and R&D inputs, but also investigates the heterogeneity of the influence effects of different industry types and asset sizes of different firms.
This paper mainly addresses the following research questions: (1) How does the NEL influence the FP of enterprises that cause severe environmental damage?
(2) What are the two channels through which the NEL influences the FP of enterprises that cause severe environmental damage: financing constraints and R&D investment? (3) How do the effects of the NEL vary across enterprises that cause severe environmental damage with different industry types and asset sizes?
Discussion of Literature
The benefits of ER have been explored in the literature from the perspectives of ER and corporate decision-making, ER and corporate performance, and the policy outcomes of the NEL. Firstly, scholars argue that, as the promoter, supervisor, and policy and regulation maker of environmental governance, government intervention will influence the flow and distribution of resources globally, which will, in turn, hurt enterprise exports [3, 4]. In contrast, reasonable and effective regulation will encourage enterprises to make investments and boost enterprises to increase investment in research and development [5-8]. However, some scholars have proposed that, for inefficient enterprises, the increased intensity of ER will impede the enterprise’s R&D investment so that the profit-reducing effect of ER prevails [9]. Secondly, the impact of ER on corporate behavior will ultimately manifest itself in corporate performance. The “Porter hypothesis” emphasizes that government regulation will motivate firms to innovate, offsetting the environmental protection costs incurred by compliance and enhancing firm performance and competitiveness [10]. However, some scholars have challenged “Porter’s hypothesis”. It has been argued that by lowering externalities such as pollution, firms are necessarily restricting their options and decreasing their profits [11]. Some scholars concluded that ER does not foster sustainable development of enterprises based on manufacturing industries in 17 European countries and private enterprises in China [12, 13]. Lastly, for the policy outcomes of the NEL, the research mainly concentrates on environmental information disclosure, technological innovation, and environmental governance behavior [14-16]. The findings of some scholars confirm that the NEL can bring more benefits to enterprises; for example, some scholars found from the perspective of the administrative level of the actual controller and the relationship between the government and the enterprise that the NEL significantly improves the quality of environmental disclosure of the enterprises in the areas with high regulatory intensity and high degree of marketization [17]. Similarly, some scholars examined the “Porter effect” of the NEL and found that executive tenure significantly moderated the positive correlation between technological innovation and environmental performance after enacting the NEL [18]. However, some scholars believe that enacting the NEL has a limited effect, cannot significantly increase investment in technological innovation, improve the environmental protection investment of enterprises, and fails to bring significant business income and profits, and analyze the possible reasons [19, 20].
However, as a typical example of ER, the connection between the NEL and enterprises is not a simple “pressure-response” connection. Previous research papers on the connection between ER and enterprise performance may have some limitations due to different research angles, research scopes, and research methods:
(1) the research angle is skewed, and the past research is less attentive to enterprises in the heavy pollution industry; (2) the research scope is not thorough, and the past research evaluates the overall influence of the NEL on the FP, whereas the dynamic and heterogeneous influences of the policy evaluation may exist, but are not examined. Influence and heterogeneity influence are not examined. Based on this, this paper re-evaluates the influence of the NEL on the FP of heavily polluting enterprises.
Policy Background and Research Assumptions
Policy Background
As China’s economy and society advance, environmental problems have gradually surfaced; the emission of pollutants has been rising, the quality of the environment has been deteriorating, and people’s demand for environmental protection has also been growing. To cope with this challenge, China started implementing a NEL in 2015, which is not only the first revision of China’s environmental protection law since it was issued in 1989, but also a crucial regulation hailed as the “most rigorous environmental protection law in history.” The NEL is based on the old environmental protection law and has been improved and innovated in-depth, mainly in these aspects: (1) strengthening the social supervision system, clearly stipulating that the key pollution sources must disclose their emission information to enable all parties in society to supervise and evaluate them, giving the news media the power and obligation to supervise public opinion, and requiring the news media not only to disseminate knowledge of environmental protection law but also to expose and criticize environmental illegal behavior. (2) Raising the cost of violating the law. The relevant authorities have adopted daily penalties, blockades, seizures, and administrative detention for illegal companies that refuse to correct their behavior. They have also included them in the record of environmental protection and illegal integrity, which will affect their credibility, evaluation, and market competitiveness. In addition, those directly responsible leaders and other relevant responsible persons will also be detained and held criminally liable, which will undoubtedly directly raise the cost of illegality and compliance for the company. (3) It fosters innovation in environmental protection technology, requiring the government to prioritize the procurement of environmental protection products, support the development and application of environmental protection technology, and give financial, tax, and price incentives and support to enterprises and institutions that comply with pollutant emission standards. These measures aim to stimulate the motivation and willingness of enterprises to innovate on their own and to promote the transition and upgrading of enterprises to achieve green development. (4) Establishing the responsibilities of governments at all levels, emphasizing that government departments must prepare and implement plans for environmental protection to finish the corresponding environmental management work within a specified time frame, and at the same time, making performance in meeting environmental protection objectives a critical point in evaluating political performance and subjecting it to public scrutiny. Administrative or criminal liability will be pursued by the law for misconduct, abuse of power, negligence, and other acts detrimental to the interests of the environment. These measures are mainly targeted at heavily polluting industries and have relatively little influence on other industries.
Research Hypotheses
Primary Impact Relationships
The enactment of the NEL has profoundly influenced the operation and development of heavily polluting companies. The NEL strengthens companies’ environmental compliance guidelines and standards and creates impetus and opportunities for technological innovation and management improvement. Therefore, the influence of the NEL on the FP of heavily polluting firms is likely to be both negative and positive.
On the negative side, the NEL raises the costs and risks of heavy polluters. According to the NEL, the scope of enterprises’ environmental information disclosure is broader [21]. The cost of pollutant emissions is also higher [22], and the intensity of punishment for illegal activities that harm the environment is also rising [23]. This means that heavily polluting companies must invest more money and workforce to buy and maintain environmental protection equipment, treat pollutants, train employees, set up monitoring systems, and improve internal management. These direct or indirect costs will undoubtedly reduce enterprises’ profitability and surplus level [24].
On the other hand, the NEL also increases the risk exposure of heavily polluting enterprises. Suppose enterprises fail to correct environmental violations promptly. In that case, they will face serious consequences such as consecutive daily penalties, detention of responsible personnel, lower credit ratings, and damage to market reputation [25]. These risky events may lead to negative impacts such as decreased revenues, increased costs, depreciation of assets, and fluctuations in the share prices of enterprises [26]. Therefore, from the negative side, the NEL negatively influences the FP of heavy polluters.
On the positive side, the NEL encourages innovation and improvement in heavy-polluting enterprises. On the one hand, the NEL demands that heavy polluters comply with higher emission standards and information disclosure requirements [17], urging them to transform their business concepts, enhance their production processes, and create new environmental protection technologies to lower pollution emissions [27]. These technological innovations not only help conserve resources and boost efficiency but also help improve product quality and add value [28]. These technological advances can increase the competitiveness and profitability of enterprises on the market [29]. On the other hand, the NEL also requires heavily polluting enterprises to reinforce their environmental management and refine their internal governance structure [30, 31]. These management innovations can increase enterprises’ organizational efficiency and coordination ability and reduce the cost of internal friction and conflict [32]. These management improvements can enhance the reputation and image of enterprises in society. Therefore, from the positive side, the NEL has a beneficial influence on the FP of heavy pollution enterprises. Summarizing the above analysis, this paper concludes that the NEL influences heavy polluting enterprises through both negative and positive effects and proposes the following two contrasting research hypotheses:
H1: The NEL can significantly enhance the FP of heavy pollution enterprises;
H2: The NEL cannot significantly improve or even hinder the FP of heavy pollution enterprises.
Channel Analysis of Financing Constraints
The enactment of the NEL has significantly influenced the financing environment of heavy pollution enterprises. The NEL increases the environmental compliance cost of heavy polluters as well as the social responsibility of heavy polluters. The NEL has a dual impact on heavy polluters’ financing constraints and FP. On the one hand, the NEL reduces the financing ability of heavy polluters. Heavy-polluting enterprises need to invest more money and resources to comply with the NEL to enhance production processes and reduce pollution [33]. These inputs include direct environmental protection equipment purchase and maintenance costs, indirect risk reserves, and violation penalty costs. These inputs will undoubtedly consume the enterprise’s funds and free cash flow, increasing the enterprise’s financial leverage and debt pressure. At the same time, the NEL has raised the intensity of ER and punishment, which also exposes enterprises to higher environmental risks [34]. These risks include direct losses such as fines, compensation, and production stoppages and indirect losses such as declining credit ratings and damaged market reputation. These losses will undoubtedly affect the enterprise’s credibility and financing costs. Therefore, enacting the NEL may lead to more severe financing constraints that heavily polluting enterprises face.
On the other hand, the NEL also boosts the financing opportunities for heavy polluters. Heavy polluters need to reinforce environmental information disclosure and enhance operational transparency to adapt to the NEL. These disclosures include basic information on emissions, methods, and concentrations and supplementary information on emergency plans, handling of emergencies, and social responsibility reports. These information disclosures can lower the cost of information asymmetry and increase investors’ and creditors’ understanding of and trust in the operation and risk status of the enterprise [17]. In addition, active fulfillment of environmental social responsibility will improve the social image and reputation of heavily polluting enterprises [25]. These favor heavily polluting enterprises to win the recognition of investors and the community and increase enterprises’ financing channels and financing opportunities [35]. Therefore, the NEL also has a potential easing effect on the financing constraints of heavy-polluting enterprises. Based on the above analysis, this paper proposes the following two research hypotheses that are in contrast to each other:
H3: The NEL will aggravate the financing constraints of heavy polluters and weaken their FP.
H4: The NEL will enhance the financing opportunities of heavy polluters and improve their FP.
Channel Analysis of R&D Investment
The enactment of the NEL brings a significant challenge to the survival and development of heavy-polluting enterprises. The NEL not only enhances the environmental protection standards and supervision of heavy-polluting enterprises, but also creates impetus and opportunities for technological innovation in heavy-polluting enterprises. The NEL has a dual impact on heavy-polluting enterprises’ R&D investment and FP. On the one hand, the NEL raises the environmental compliance costs of heavily polluting enterprises. To comply with the emission standards and information disclosure requirements stipulated in the environmental protection law, heavy polluting enterprises need to improve and upgrade their production processes, invest more in environmental protection equipment, and increase the reserve for non-compliance penalties, all of which will consume the funds and resources that can be used for technological research and development [36]. At the same time, measures such as continuous daily penalties and criminal liability for legal persons under the environmental protection law have significantly increased the environmental risks of heavily polluting enterprises [34]. Under such pressure, heavy polluters may reduce their R&D investment and lower technological innovation, affecting productivity and FP.
On the other hand, the NEL also stimulates the technological innovation motivation of heavy-polluting enterprises. To adapt to the requirements of the NEL, heavy-polluting enterprises need to create greener, more efficient, and less costly production processes and emission reduction technologies [33]. This urges heavy-polluting enterprises to boost R&D investment and enhance technological innovation [37]. Through technological progress, heavy-polluting enterprises can improve resource utilization efficiency, lower production costs, and reduce environmental risks, thus improving FP. Based on the previous analysis, this paper proposes the following two research hypotheses that are in contrast to each other:
H5: The NEL will reduce the R&D investment of heavy polluters and weaken their FP by raising compliance costs.
H6: The NEL will boost the R&D investment of heavy polluters and improve their FP by encouraging technological innovation.
Research Design
Model Setting
The NEL came into effect on January 1, 2015, and the sample period in this article spans from 2011 to 2020. To evaluate the influence of the NEL on the FP of heavy polluters, the following DID model is established based on the hypotheses previously proposed:
As shown in Equation (1), ROA stands for Return on Assets, which is a key indicator of a firm’s FP. Post indicates whether the NEL has been enacted or not, and Treat signifies whether the firm is a serious polluter or not. DID is the main explanatory variable in this paper, which is also the interaction term for Treat and Post. Control is the set of control variables, including Size, Shc, Lev, Cash, Itr, and Artr. year, Industry and Company represent individual dummy effects for year, industry, and firm, respectively. ε is a random perturbation term. Moreover, this paper also uses return on equity (ROE) as a substitute for return on assets (ROA) to enhance the reliability of the results.
To further explore the dynamic effects of the NEL policy and conduct parallel trend tests, this paper constructs the following dynamic DID model, drawing on related scholars [38]:
(2)
Where Ti = 1 signifies that enterprise i is a heavy polluter, and Ti = 0 signifies that enterprise i is a non-heavy polluter; I(*) is the indicative function, and TD is the current period of the policy shock of the NEL, with the gap from the time of the enactment of the NEL as the reference point (t – Pcurrent), in which s = – 1 is the base period, and the rest of the variables have the same meanings as in equation (1).
Definition of Variables
Dependent Variables
FP is a comprehensive representation of its financial position, which is usually measured by the return on assets (ROA), the proportion of net profit to the balance of total assets, which reflects the profitability of the company’s assets [39]. Moreover, to guarantee the stability of the model, the return on equity (ROE) is selected as an alternative indicator of the company’s financial performance, which is calculated as the proportion of net profit to the balance of shareholders’ equity.
Explanatory Variables
DID is the key explanatory variable in this paper, the product of Treat and Post. Post is determined by the enactment date of the NEL, and the sample data before 2015 is assigned 0, while Post is marked as 1 in 2015 and subsequent years. Treat is the category of corporate pollution, and based on the study of related scholars [40], the screening criteria for the heavy pollution industry are established. If the enterprise’s industry is heavy pollution, then Treat = 1; otherwise, Treat = 0.
Control Variables and Mechanism Variables
This paper follows the research of related scholars [41-43], controlling the enterprise size (Size), which is the logarithm of the total assets; shareholding concentration (Shc), which is the proportion of the top ten shareholders’ shareholding in the company; gearing ratios (Lev), which is the proportion of liabilities to the total amount of assets; cash flow (Cash), which is the proportion of the balance of cash and cash equivalents at the end of the period to the total assets; inventory turnover ratio (Itr), which is the proportion of operating costs to the ending balance of inventory; and accounts receivable turnover (Artr), which is the proportion of operating income to the ending balance of accounts receivable. Moreover, the paper controls for firm, industry, and year-fixed effects. The degree of financing constraints (KZ) is a mechanism variable for channel analysis, measured by the KZ index [35]. The higher the KZ, the more serious the financing constraints faced by the firm. The degree of R&D investment (RD) is also a mechanism variable for channel analysis, which is the proportion of the amount of R&D investment to the total assets [44].
Choice of Samples and Availability of Data
This study uses A-share companies listed in China from 2011 to 2020 as the research object. It applies the double-difference method to examine the influence of the environmental protection law on the FP of heavily polluting enterprises. The detailed sample-processing steps are as follows:
(1) Firms in the financial industry and those replaced by ST, ST*, and PT are excluded (ST: The company operates at a loss for two consecutive years, special treatment; *ST: Three consecutive years of operating losses, delisting warning; PT is the abbreviation of English Particular Transfer). According to the Company Law and the Securities Law, a listed company’s stock will be suspended if, among other things, it has suffered losses for three consecutive years.
(2) Firms with gearing ratios above 1 were excluded.
(3) After excluding the samples with severe data deficiencies, the observations of 15,334 samples were obtained. To reduce the interference of extreme values, the continuous variables are shrink-tailed through Stata, while the rest of the data are acquired from the CSMAR database.
Table 1.
Statistics describing the primary variables.
Examination of Empirical Results
Descriptive Statistics
Table 1 shows the descriptive statistics of the main variables chosen in this paper. Based on the data in the table, the minimum and maximum values of ROA and ROE are -0.1922 and 0.1917, -0.4933 and 0.2904, respectively, indicating that there are clear individual differences in the profitability of the assets of the sample firms. The mean value of Treat is 0.2401, which implies that the experimental group (heavy polluting firms) made up 24.01% of the total sample; the mean value of Post is 0.7310, implying that the sample after the policy enactment (2015 and later) made up 73.10% of the total sample. The variance of the KZ variable is above the mean, implying a high coefficient of dispersion, indicating that the sample firms are significantly different in terms of financing constraints. The variances of all other variables are below the mean, implying relatively small coefficients of dispersion, indicating the high stability of the sample.
Correlation Analysis
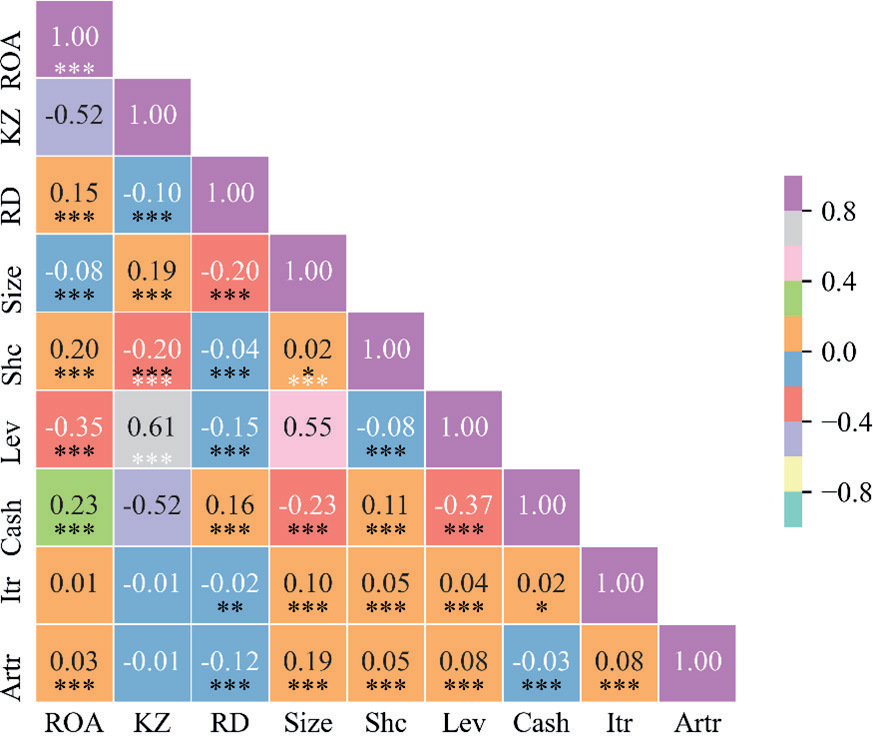
Fig. 1 shows the results of the correlation analysis for each variable. Based on the figure, the correlation coefficients of all the variables are around 0.6, implying no severe issue of multicollinearity, which ensures the stability of the subsequent analysis. Since the DID variable is categorical, it is not included in the correlation analysis. The figure shows that financing constraints (KZ) have a non-significant negative correlation with financial performance; on the other hand, research and development investment (RD) have a significant positive correlation with financial performance. This establishes the direction for the subsequent analysis, that is, to examine the influence of the NEL policy on the FP of heavy-polluting enterprises from the perspectives of financing constraints and R&D investment.
Parallel Trend Test
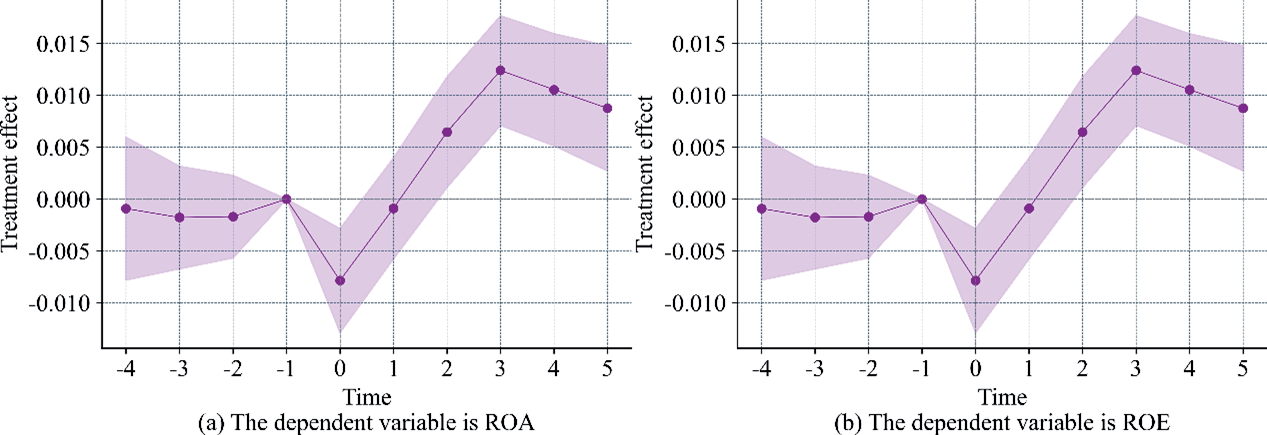
The parallel trend assumption is the essential premise of the double difference model, which demands no significant difference between the experimental group (heavy polluting firms) and the control group (non-heavy polluting firms) before the policy intervention to use the double difference model effectively. In this paper, the study examined the influence of the NEL on ROA and ROE by estimating the dynamic effect through model (2), and the results are displayed in Fig. 2. Based on the figure, before the enactment of the NEL, ROA and ROE were not significantly different in the two groups (the confidence interval of the regression coefficient includes 0), which conforms to the parallel trend assumption; in the short term, the treatment effect of the NEL on the FP of heavy polluters is negative. In the period of the enactment of the NEL, the experimental group was affected by the policy, and compared with the control group, it was significantly reduced (regression coefficient confidence interval excludes 0). There is no significant difference between the experimental and control groups in the 1 period after the enactment of the policy. In the long run, the treatment effect of the NEL on the FP of heavy polluters is positive. In the following 2-5 periods, ROA and ROE are significantly different between the two groups, and it can be observed in the figure that the experimental group, after its adjustment, has significantly increased compared with the control group, indicating that the FP of heavy polluters is significantly improved compared with that of non-heavy polluters. These results confirm the “parallel trend hypothesis” and provide initial evidence that “the NEL has a lasting effect on the FP of heavily polluting enterprises.
Benchmark Regression
This paper further explores the specific impact of the NEL on firms’ FP. Based on model (1), Table 2 shows the regression results of DID on ROA and ROE. All regression analyses control for year, industry, and firm fixed effects using robust standard errors. Table 2 displays the effect of the NEL on the profitability of the assets of heavy polluters in columns (1) and (2), and the regression coefficients of DID are both positive and significant, indicating that the NEL is efficacious in improving the return on assets of heavy polluters. After controlling for other variables, the regression coefficient of DID is 0.0064 with a significance level of 1%, implying that the NEL increases firms’ return on assets by 0.064% on average. Columns (3) and (4) of Table 2 report the effects of the NEL on the profitability of net assets of heavy polluting firms, and the regression coefficient of DID is also positive and significant, indicating that the NEL can effectively improve the return on net assets of heavy polluting firms. These results confirm the previous research hypothesis 1 that the NEL positively affects the FP of heavy-polluting enterprises. In addition, the study reveals the effects of control variables on firms’ FP: firm size, equity concentration, cash flow, and accounts receivable turnover have significant positive effects on FP, while gearing ratio has significant adverse effects on FP, and there is no significant link between inventory turnover and FP.
So, how did the FP of heavy polluters improve instead of decreasing after the enactment of the NEL? The NEL stimulated the heavy polluters to make technological innovations and management improvements. By utilizing technological innovation, heavily polluting companies can create more energy-efficient, environmentally friendly, and efficient production modes, which improve resource use efficiency, increase the added value of products, and reduce the cost of emissions. Through management improvement, heavily polluting companies can optimize their organizational structure, upgrade the quality of their staff, and strengthen internal supervision, thereby increasing operational efficiency and reducing management costs, which make heavily polluting companies more competitive and sustainable in the marketplace.
Robustness Analysis
Placebo Test
To verify that the effect of the NEL on the FP of heavy polluters is not caused by other random factors, this paper uses the placebo test to detect the contingency of the treatment effect of the NEL. Following the research of relevant scholars [45], based on the distribution of DID variables in the baseline regression, 500 random samples are generated to create “pseudo-policy dummy variables”, and model (1) is regressed again to estimate and test the distribution of coefficients and P-values, and the results are displayed in Fig. 3. The effect of ROA and ROE on the ROA and ROE regression coefficients of “pseudo-policy dummy variables” is nearly zero on average and much smaller than the benchmark regression coefficients. The distribution of the estimated coefficients is close to normal, and the P-value is mostly larger than 0.10, which is not significant at the level of 10 percent. This implies that the influence of the NEL on the FP of heavy polluters is not due to other random factors and that the conclusions drawn above are robust.
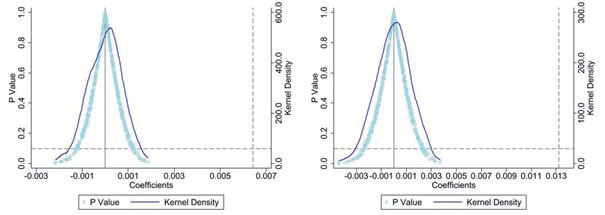
Table 2.
Empirical results of primary impact relationships.
Table 3.
PSM-DID test results.
PSM-DID Method
Considering that the model above may have a sample selection problem, the PSM-DID method is used to mitigate the endogeneity problem of the model further. After removing the few samples that were not matched, the test was re-run using model (1), and the regression results are shown in Table 3. Columns (1) and (3) of the table show that the coefficient of DID is significantly positive, indicating that the new environmental protection law has a positive impact on the financial performance of heavily polluting firms; columns (2) and (4) show that the results are still robust after the addition of the control variables. The regression coefficients of DID are 0.0051 and 0.0093, respectively, which indicate that the implementation of the NEL has a driving role in the FP of heavy-polluting firms, and the original model does not have any systematic differences. Promotion and the original model do not have serious sample selection bias problems. Therefore, the conclusions of the previous paper are more reliable.
Further Expanded Research
Analysis of Influence Channels
Based on the theoretical analysis and the benchmark test, the study finds that the NEL benefits the FP of heavy polluters. In this part, the study explores the possible mechanisms of this effect from the perspectives of financing constraints and R&D investment. Table 4 shows the regression results of the mechanism tests for financing constraints. From column (1), the study sees that the DID coefficient is significantly negative, implying that the NEL enhances the financing opportunities of heavy-polluting firms. Columns
(2) and (3) further confirm the negative impact of financing constraints on the FP of heavy-polluting firms. High financing constraints reduce the profitability of enterprise assets, limit enterprises’ investment opportunities, lower enterprises’ productivity and market competitiveness, and increase enterprises’ financing costs and risks. Therefore, the study concludes that the NEL improves the financing opportunities of heavily polluting firms and boosts their FP, confirming research hypothesis 4. Table 4 also presents the regression results of the mechanism tests for R&D investment.
From column (4), the study observes that the DID coefficient is significantly negative, possibly because the NEL squeezes out the R&D investment of heavily polluting firms by increasing the compliance cost. Columns (5) and (6) further demonstrate the positive impact of R&D investment on the FP of heavy-polluting firms. R&D investment increases the profitability of enterprise assets by improving the technological innovation ability of enterprises, optimizing their production processes and procedures, and enhancing their core competitiveness and brand image. Therefore, the study confirms research hypothesis 5 that, under excessive environmental regulatory pressure, the NEL reduces the R&D investment of heavy polluters, which is detrimental to their FP.
Heterogeneity Analysis
The study has analyzed and verified that the NEL can improve the FP of enterprises through the financing constraint channel. However, enterprises have different property rights characteristics and asset sizes, which may affect their policy responses to the NEL. In the following section, the study will examine the differences in the effects of the NEL on firms’ FP from the perspectives of firms’ property rights characteristics and asset sizes. In this paper, the study divides enterprises into two types based on their property rights characteristics: state-owned enterprises and non-state-owned enterprises. Table 5 displays the regression results, from which the study can see that for both state-owned and non-state-owned enterprises, the NEL has a significant positive effect on their return on assets and return on net assets, with positive and significant DID regression coefficients at the 1% level. This indicates that the NEL fosters the green transformation of heavy-polluting enterprises and enhances their economic growth. There is a difference in the magnitude of financial performance improvement between state-owned and non-state-owned enterprises after implementing the NEL. The study argues that the positive impact of the NEL on the FP of enterprises may originate from the following aspects: the NEL strengthens the environmental and social responsibility of enterprises, encourages enterprises to conduct technological innovation and management innovation, and increases the productivity and market competitiveness of enterprises; the new environmental protection law intensifies the punishment of illegal emission enterprises, raises the compliance cost of enterprises, and induces enterprises to adopt measures such as energy saving, emission reduction, resource recycling, and lowers the operating costs and risks of enterprises; the NEL enhances the environmental information disclosure system, improves the transparency and credibility of enterprises, attracts more investors and partners, and expands the financing channels and market share of enterprises.
Table 4.
Influence channel analysis.
To examine the impact of the NEL on the FP of enterprises of different sizes, the study split the sample into two groups, large and small, based on the mean value of enterprise size. Table 6 reports the results of the regression analysis. From the table, the study can observe that in the large-scale enterprise group, the effect of the NEL on return on assets is significantly positive. In contrast, in the small-scale enterprise group, this effect is insignificant. The results for return on net assets are consistent with return on assets for both firms. This implies that the NEL has heterogeneous effects on the FP of firms of different sizes. The study proposes several possible reasons for this: first, large-scale enterprises tend to have more robust technological innovation capabilities and market competitiveness and can lower environmental costs and enhance product quality and differentiation through green innovation, thus increasing revenues and profits; second, large-scale enterprises are also more likely to receive the support and trust of the government and the society, and to benefit from more policy incentives and subsidies, as well as better financing conditions and credit ratings; third, small-scale enterprises face higher environmental compliance pressures and cost burdens, and struggle to afford the inputs and risks needed for green innovation, as well as lack effective incentives and institutional safeguards.
Table 5.
Heterogeneity analysis based on the nature of firms’ property rights.
Table 6.
Heterogeneity analysis based on asset size.
Conclusion and Outlook
Conclusion
As environmental problems become more severe, the Chinese government has enacted a NEL to enhance environmental protection and foster green development. The NEL sets higher environmental standards and stricter regulatory measures for heavy polluters, which significantly impacts their FP. Based on the exogenous shock of implementing the NEL policy, this paper uses the difference-in-differences method to construct a quasi-natural experiment of the NEL and the FP of heavy-polluting enterprises. It empirically investigates the specific effects and mechanisms of the NEL on the FP of heavy-polluting enterprises. The study reaches the following conclusions:
(1) After implementing the NEL, the FP of heavily polluting enterprises exhibits the dynamic effects of short-term negative and long-term positive, and the results are still valid after the parallel trend test. This demonstrates that the NEL has a lasting positive effect on the FP of heavy-polluting enterprises.
(2) The NEL has a significant positive effect on the FP of heavy-polluting enterprises, and this conclusion is robust after various robustness tests. Further research reveals that the NEL will enhance the financing opportunities of heavy polluting firms and thus improve their FP; at the same time, the NEL will also raise the compliance cost and crowd out the R&D investment of heavy polluting firms, which is unfavorable for their FP. Moreover, the nature of enterprise property rights and asset size will also influence the economic effects of implementing the NEL. Small-scale enterprises, mainly due to higher environmental compliance pressure and cost burdens, find it hard to conduct green innovation and need more effective incentives and institutional safeguards.
Outlook
Considering the above research findings, as well as the environmental challenges and the economic transformation needs that China is currently facing, this paper proposes the following targeted policy recommendations:
(1) Increase environmental compensation and incentives for heavy-polluting enterprises to guide them in changing their production methods, improving resource efficiency, and reducing pollutant emissions. Specifically, the government can support heavily polluting enterprises to conduct green technological transformation and innovation through tax incentives, financial subsidies, and low-carbon development funds. At the same time, it can also internalize the environmental costs of heavily polluting enterprises through environmental taxes, sewage charges, carbon trading, and other forms. This will stimulate enterprises’ environmental protection motivation and enhance corporate social responsibility.
(2) Strengthen environmental education and training for small-scale enterprises to improve their environmental awareness and capabilities and assist them in achieving green transformation. Specifically, the government can popularize environmental protection knowledge and skills among small-scale enterprises by carrying out environmental protection publicity activities, providing environmental protection consulting services, and organizing environmental protection training courses to improve their understanding of and compliance with the new environmental protection law. It can also provide technical support and resource sharing for small-scale enterprises by introducing third-party institutions and social organizations. This will improve the environmental adaptability of small-scale enterprises and alleviate their environmental compliance pressure.
(3) Accelerate the establishment of a sound green financial system to facilitate green financing and investment by heavily polluting enterprises. Specifically, the government can provide more green financing channels and opportunities for heavy-polluting enterprises by improving green credit policies, promoting green bond issuance, and setting up green funds. The government can also enhance heavy-polluting enterprises’ green financing costs and risk management by strengthening green credit ratings, establishing a green information disclosure platform, and improving the green regulatory system. This will enlarge the financing space for heavy-polluting enterprises and optimize their investment structure.
(4) Deepen cooperation and exchanges with the international community and learn from advanced environmental protection experiences and cases abroad to offer more opportunities for heavy polluters to learn and emulate. Specifically, the government can share environmental protection concepts and technologies with foreign countries by participating in international environmental agreements, joining international environmental protection organizations, and carrying out international environmental protection projects. It can also build more international cooperation and exchange platforms for heavy-polluting enterprises by holding international environmental protection forums, exhibitions, and study tours. This will broaden the international vision of heavy-polluting enterprises and boost their international competitiveness.

