


Introduction
Kiwifruit (Actinidia spp.) is native to the mainland of China (Southeast Asia), where it is produced in larger quantities [1, 2]. Later, in the early 1920s, commercial cultivation began in temperate regions of the world [3]. Kiwifruit belongs to the Actinidiaceae family and has a large number of species, including Fuzzy kiwi (Actinidia deliciosa), Golden kiwi (Actinidia chinensis), Hardy kiwi (Actinidia arguta and Actinidia kolomikta), Chinese gooseberry (Actinidia coriacaea), Red kiwi (Actinidia melandra), Silver vine (Actinidia polygama), and Purple kiwi (Actinidia purpurea) [4-8]. Actinidia deliciosa variety Hayward is the most commonly grown species, but Actinidia chinensis is also produced commercially in some areas [9-11]. Due to increased market demand, commercial production of kiwifruit is increasing all over the world [12, 13]. World total production of kiwifruit has increased by over 50% during the last decade, however, kiwifruit remains a niche fruit, taking up an estimated 0.22% of the global fruit bowl, which is dominated by apples, oranges, and bananas [14].
Kiwi is a deciduous, warm temperate perennial vine with a woody, climbing, brittle stem with alternate leaves. Bud break is a major factor in kiwifruit production [15-18]. The nutritional value and health benefits of kiwi make it the most popular fruit. It is abundant in vitamins, dietary fiber, functional ingredients (e.g., starch and protease), bioactive phytochemicals, polyphenols, and flavonoids. It promotes gut health as it has antiproliferative, antioxidative, anti-inflammatory, antihypercholesterolemic, antimicrobial, antihypertensive, neuroprotective, and antiobese properties [19-25]. The physicochemical and nutritional properties of three starchy kiwifruit flours were studied by Lan et al. [26], and they reported that this flour has higher nutritional benefits, which will have good development potential in the food industry.
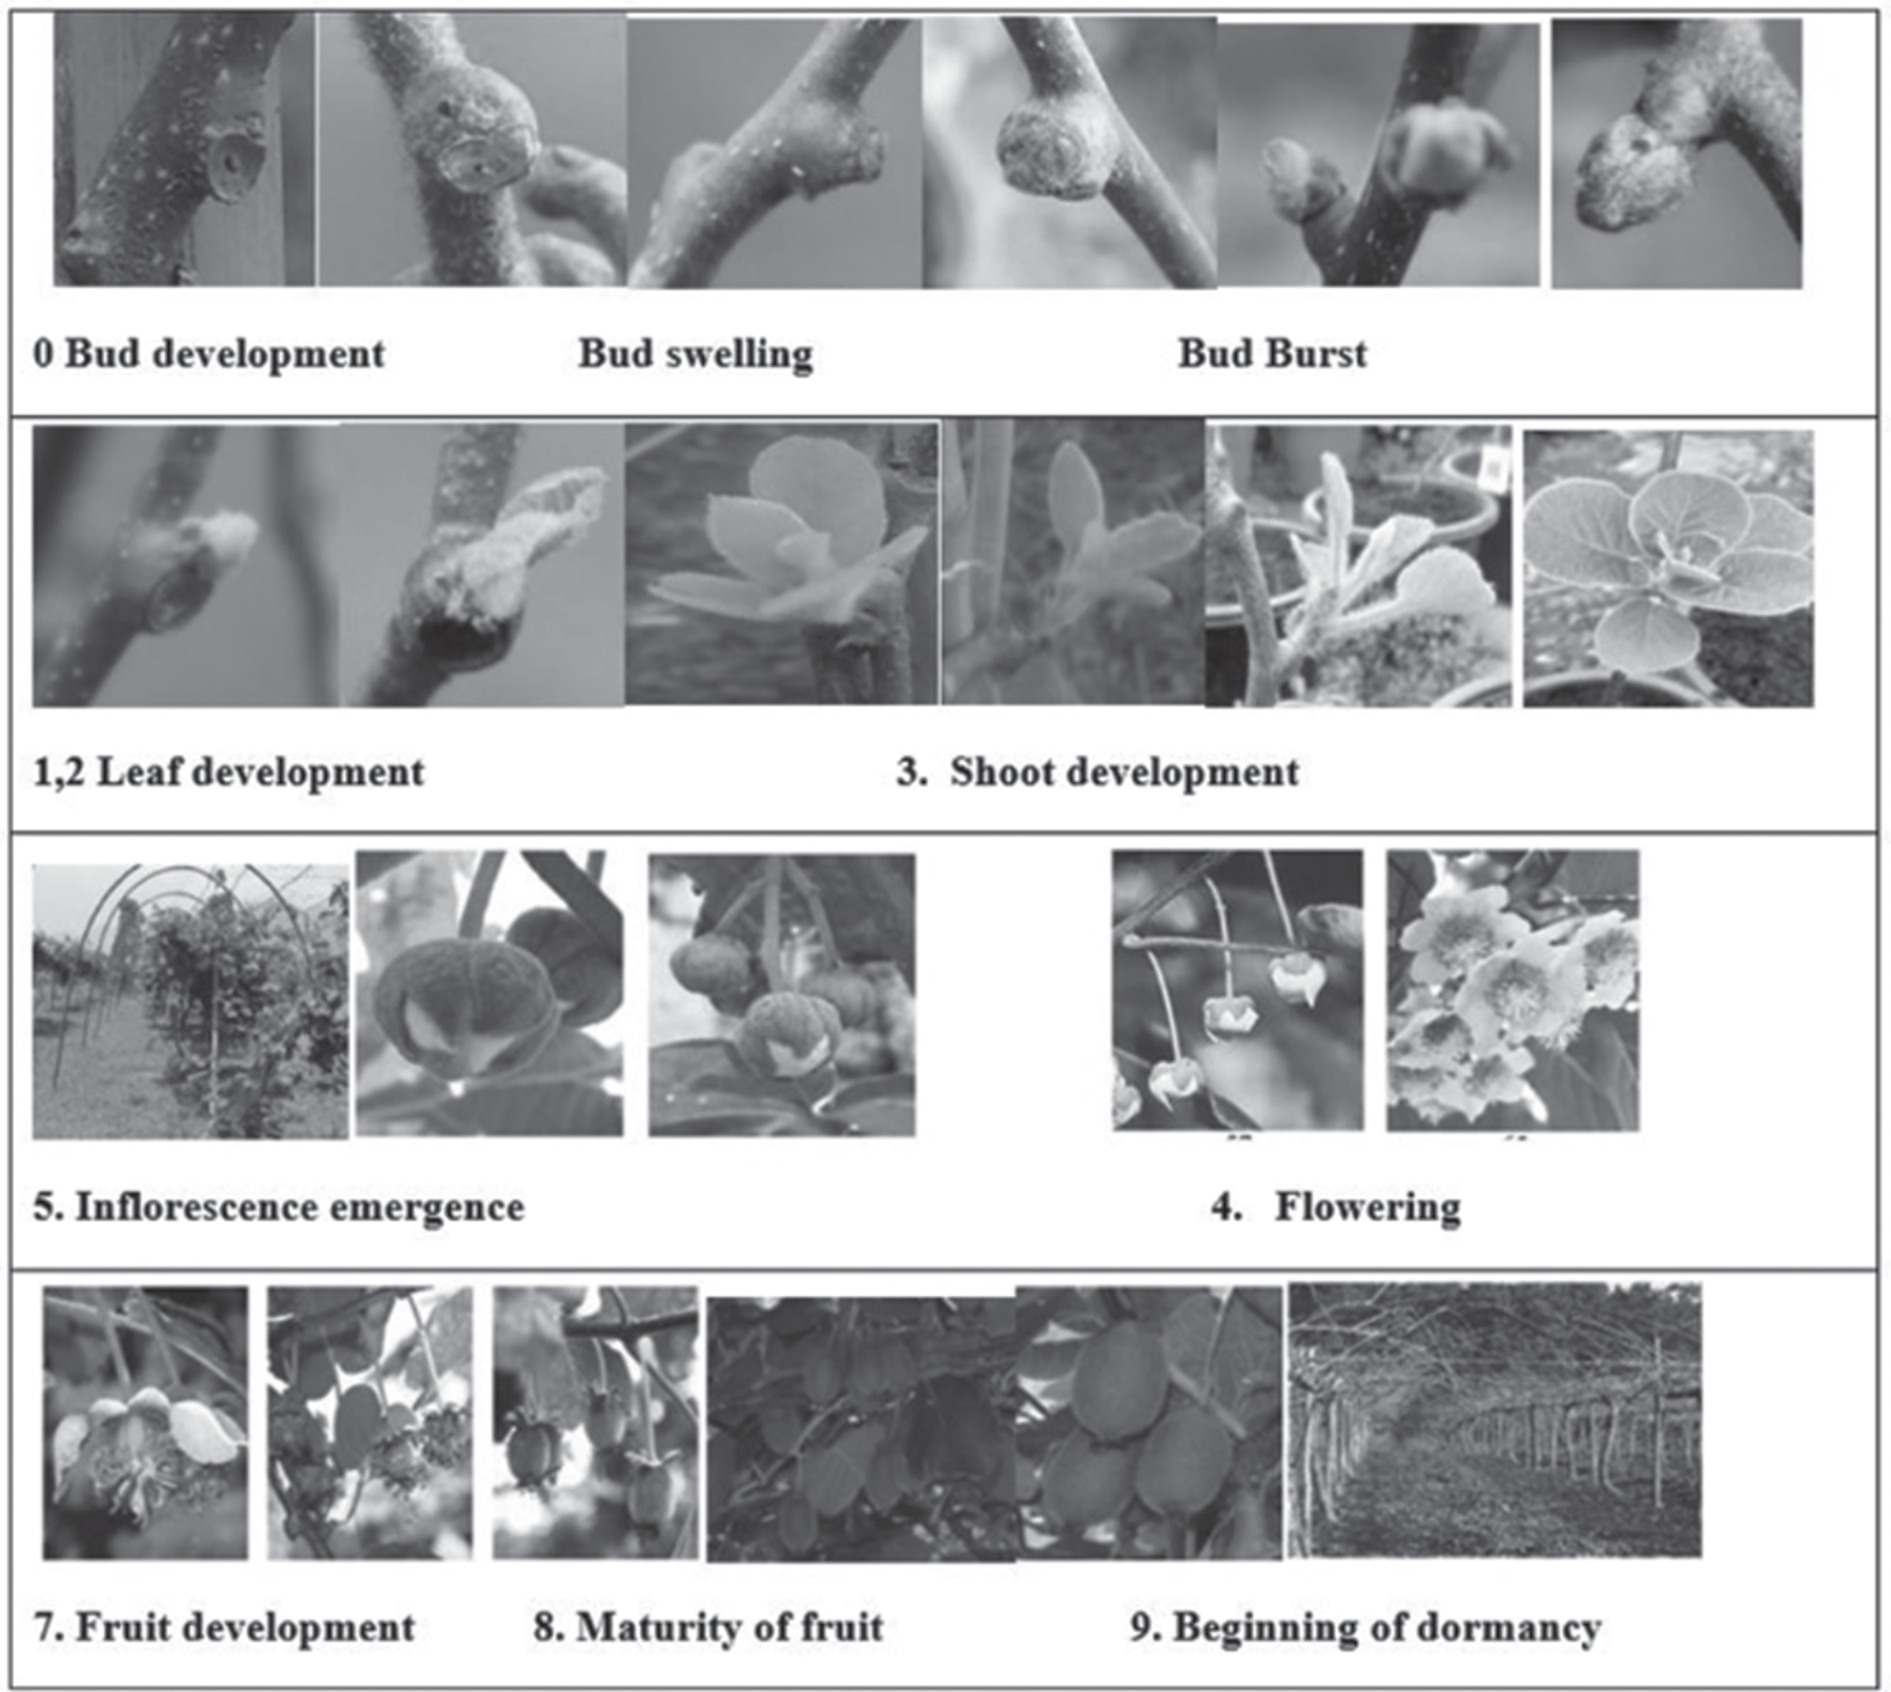
Phenology is the study of changes in the timing of seasonal events like bud burst, flowering, and dormancy. The majority of the phenological events are triggered by temperature, while others are influenced by day length [27-30]. Understanding the plant phenology is essential to determining its suitability for a particular region [31-39]. Identification of key growth stages in kiwifruit in response to climatic variables can enhance horticultural practices and operations (pruning, pollination, fertilization, irrigation, pest management, and propagation) for orchard management [40-45]. The duration of the active growth phase, reproduction, and seasonality are all indicated by phenology, which is the primary determinant of plant growth and survival [46- 48]. The phenology of the kiwifruit vine is extremely fascinating to nature lovers and acts as an accurate bioclimatic indicator of seasonality and climate change. The study of growth stages is essential for achieving good fruit weight and quality, as well as maintaining management practices [49-54]. Different varieties of kiwifruit have marked differences in the onset of their phenological growth stage, and these variations are essential for selecting varieties with high yield and suitability in a specific region and climate [40]. The key phenological stages of kiwifruit according to the Biologische Bundesanstalt Bundessortenamt und Chemische Industrie (BBCH) scale are bud burst, leaf development stage, shoot development stage, inflorescence emergence stage, flowering stage, fruit development stage, ripening stage, and senescence or dormancy stage, and identification of these development stages is essential for enhancing the production of this high-value crop [45, 46] (Fig. 1). The timing of bud development, swelling, and termination varies depending on the variety; it begins in March and ends in December to January [48]. There are numerous Actinidia deliciosa varieties, including Hayward, Bruno, Goldflesh, Greenflesh, and Redflesh [5]. Hayward, which was named after Hayward Wright, is the most widely cultivated standard cultivar worldwide [49]. The required amount of chilling time varies between cultivars, which is used to predict when flowers will open. Chilling is necessary for most commercially grown kiwifruit cultivars, which are natural selections of Actinidia chinensis and Actinidia deliciosa from China [50]. Actinidia chinensis was found to have a low chill trait (400-600 h), and A. deliciosa cultivars had the highest chilling requirements (600-800 h) [51]. In addition, various cultivars of the Actinidia genus had notably different chilling requirements. For instance, Hayward necessitates 950 hours of chilling for vegetative growth and 1150 hours for floral bud burst, whereas Bruno necessitates only 700 hours [52]. The ability to predict the effects of seasonal variations on plant growth and development has a high economic value for increasing productivity [53]. These developmental stages provide valuable information for managing vineyard operations on time, including pruning, fertilization, irrigation, disease management, netting, and harvest planning. The stage of bud burst in the kiwifruit phenological cycle is a good bioclimatic indicator for the onset of spring and the beginning of active growth in deciduous plants following the end of their winter dormancy [55].
Fig. 1.
Phenological growth stages of kiwifruit according to the BBCH Scale [92-95, 100-112, 114, 116-123, 125-127].
Early bud burst and flowering cause frost damage in cold regions, whereas early flowering and ripening cause a shorter growing season, smaller fruit size, and lower yield in warm regions [54, 56]. Furthermore, the morphological characteristics of kiwifruit should also be evaluated under different hormones, as studied by Guney et al. [57], who reported indole-3-butyric acid as most effective for improving the morphological traits.
Climate change in the form of a rise in temperature, elevated CO2, variability in rainfall, and drought has shown a significant impact on agricultural crop production [32, 58-61]. Hence, it is essential to take measures that can help mitigate the ill effects of climate change. These include the economical use of natural resources, the preference of genotypes with lower water needs in agriculture and forestry, the use of organic manures, the inclusion of foresight regarding the process in forestry studies in the management plans, the reduction of hard ground in urban areas, and the increase of plant use, the widespread use of roof and terrace gardens, the application of vermicompost leachate against salinity, and the use of genomic and epigenetic footprint analysis [62-65]. Furthermore, climate change should be considered in relation to healthy forest management plans and sustainability in forestry areas [63]. The adaptability of new plant species to new environments is a function of climatic (such as temperature and precipitation) and topographic (such as altitude, slope, and exposure) parameters [66, 67]. Climate is one of the most important factors influencing the annual cycle of kiwifruit, from its development, growth, and breaking of bud burst to its flowering and fruiting [68]. Air pollution could cause heavy metal contamination in plants [69-71], and it could also have damaging effects on plant growth [34, 58, 72-77]. Deciduous temperate fruit trees, such as kiwifruit, cease growth during the winter months to survive harsh climatic conditions [78]. However, to break this arrest period (dormancy), deciduous fruit trees require a period of low temperature, known as the chilling requirement [79]. The winter chilling requirement of a plant is directly related to the timing of bud break, the increase in bud break, and flowering [52]. Winter chilling hours of the growing season, growing degree days, and annual precipitation are critical climatic requirements for the adaptability of kiwifruit to a new region [68]. The optimal winter chilling requirement of kiwifruit is 11ºC or less, whereas it requires heat accumulation of 1100 degree-days above 10ºC with annual rainfall of 1250 mm or more [80]. Beutel et al. [81] reported that kiwifruit can thrive in regions where summer temperatures reach up to 45ºC, provided they can be irrigated daily with 36369-45461 liters (8,000 to 10,000 gallons) of water per acre. Kiwifruit thrives in sub-temperate to sub-tropical climates. Ozturk et al. [82] estimated the water footprint of kiwifruit in the areas transferred from hazelnut to kiwi and concluded that kiwi cultivation might be advantageous economically, but this economic benefit might be an ecological disadvantage as kiwi production is highly dependent on limited blue water resources. The cultivation of kiwifruit is increasing in India, Nepal, and Portugal [10, 83-85]. Pothowar Plateau in Pakistan (32.10º to 34.9ºN latitude and 71.10º to 73.55º E longitude) has an area of 1.82 million hectares and is a significant rainfed region with enormous agricultural, economic, and cultural significance [86-89]. It has distinct climatic conditions, such as fluctuating air temperatures from below 0ºC in the winter to above 40ºC in the summer, as well as variable rainfall patterns [28, 89-93]. The climate of Pakistan is so diverse that it permits the cultivation of nearly all temperate tropical and subtropical fruits [94]. Pakistan is among the countries most exposed to and vulnerable to climate change. The country has experienced many severe floods, droughts, and storms over the last decades. Different adaptation measures that include changes in crop variety, crop types, planting dates, and input mix, depending on the nature of the climate-related risks, could be opted for to minimize the impact of climate change in Pakistan [34, 36, 95-100]. In the Pothowar region, Chakwal district has an average annual temperature of 22.3ºC and an average annual precipitation of 565 millimeters, whereas Rawalpindi district has an average annual temperature of 21.3ºC and an average annual precipitation of 980 millimeters (http://climate-data.org), with wide inter-annual seasonal temperature variation. In this region, climate models predict a temperature increase of 2-4ºC by the end of the century [59, 101, 102]. These environmental trends may alter the horticultural production and cultivars currently cultivated in the Pothowar region. Phenological monitoring of kiwifruit varieties in the Pothowar region in response to changing environmental conditions is critical for long-term sustainability. Thus, this work was designed to study the phenological, physiological, and morphological adaptability of Kiwifruit varieties under new climatic conditions to improve the biodiversity of the region and increase the income of the community by providing them with new cash crops. The effect of growing season temperature on the development and physiology of five kiwifruit varieties (Hayward, Bruno, Goldflesh, Green Flesh 1, and Green Flesh 2) was studied for kiwifruit production in this region..
Experimental
Agroclimatic Characterization of the Test Sites
The site for evaluating the adaptability of kiwifruit production in the Pothowar region was chosen after a comprehensive field survey (soil and water availability) and analysis of long-term climate data. The Pothowar (or Pothohar) plateau (350-580 m a.s.l.) encompasses approximately 1.82 million hectares, of which a third is cultivable land. It stretches from 32°10-34°9’N to 71°10-73°10’E in northern Punjab. Pothowar has a subtropical thermal climate with a predominance of summer precipitation. Rainfall varies from semi-arid (about 250 mm average annual rainfall) in the south and west of the plateau to sub-humid (>1000 mm average annual rainfall) in the northeastern regions around the capital Islamabad [88]. Due to the wide variation in climatic conditions, Rawalpindi and Chakwal were chosen as the study locations. Rawalpindi district is located in the northernmost portion of Punjab and has a maximum elevation of 9160 feet and a minimum elevation of 1100 feet above sea level, whereas Chakwal district has an altitude of 1,634 feet. Both locations exhibit substantial seasonal variation between years. Rawalpindi has sub-humid climatic conditions with an average annual temperature of 21.3ºC and annual precipitation of 1249 mm, whereas Chakwal has semi-arid climatic conditions with an average annual temperature of 22.3ºC and annual precipitation of 519 mm (http://climate-data.org). At all sites, the annual potential evapotranspiration (FAO Penman-Monteith) is approximately 1600 mm.
Before planting, all undesirable grasses and weeds were eliminated. The soil was sampled from 0-15, 15-30, and 30-45 cm depths to determine soil physiochemical properties and the optimal fertilizer application rate for the Kiwifruit (Table 1). Textural analysis revealed that the soil of Rawalpindi is sandy loam with a pH of 7.8 at different depths, while the soil of URF Koont Chakwal is sandy clay loam with a pH of 8.0. Since kiwifruit have a large, vigorous root system that can reach depths of 1-2 feet, the soil was prepared accordingly. Furthermore, kiwifruit plants cannot tolerate waterlogged soil; the soil was properly leveled to ensure adequate drainage.
Plant Material
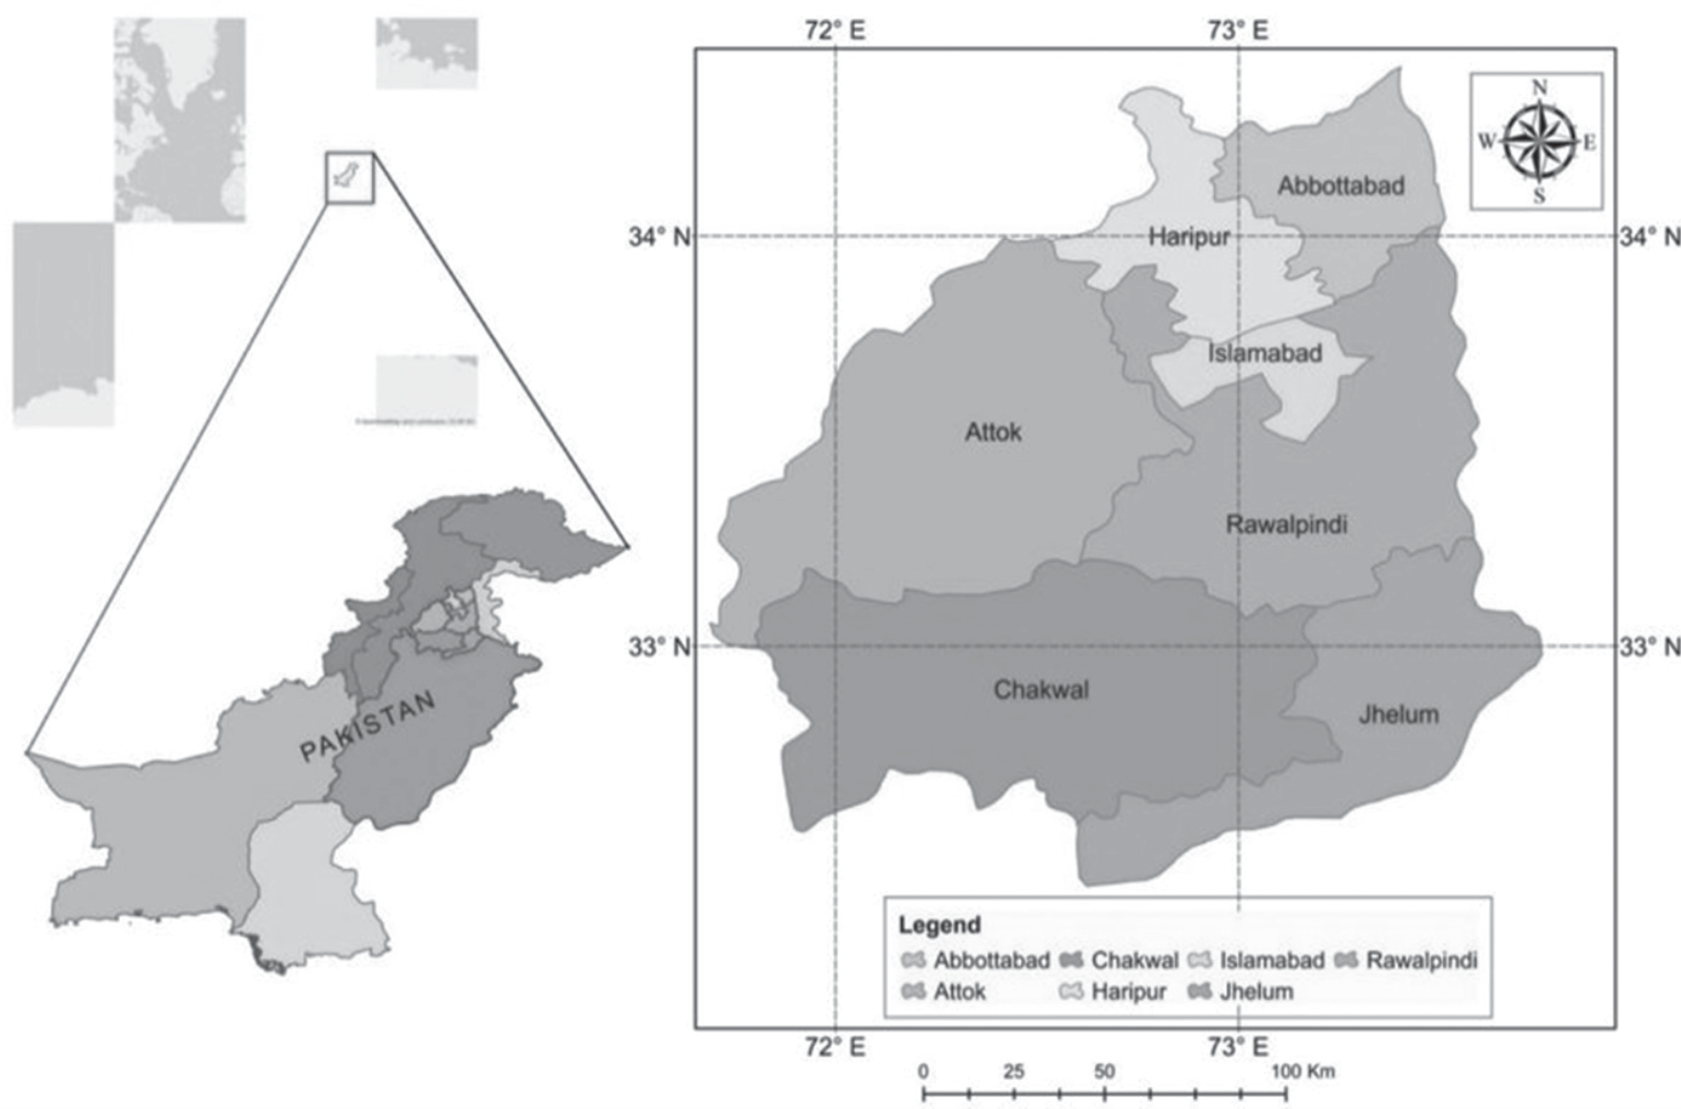
Five one-year-old exotic kiwifruit varieties (Hayward, Bruno, Goldflesh, Greenflesh 1, and Greenflesh 2) were obtained from various local nurseries. Plants were grown in pots (14”D x 14”W x 13”H) filled with 8 kg of soil and transplanted to fields at Pir Mehr Ali Shah Arid Agriculture University Rawalpindi (PMAS-AAUR) (33.5651°N, 73.0169°E) and University Research Farm Koont (URFK) Chakwal (32°55’N; 72°51’E) during 2020-2021 (Fig. 2). During the study period (2020-2021), climate data, including daily observations of average temperature, relative humidity, and rainfall, were collected from a local meteorological observatory.
Table 1.
Physiochemical properties of study sites (average data for three layers).
Since kiwifruit is a vine crop that cannot support its weight, a trellis system is required to train the vines. In this experiment, a T-bar trellis system was installed using I-shaped cement pillars, pipes, and wires. This system has been used in various countries to grow kiwifruit. The distance between pillars and plants was approximately 6 meters and 3 meters, respectively. About 3 feet wide and 3 feet deep, pits were made for kiwifruit plants. The pits were filled with a 1:1:1 ratio of sand silt and well-composted farmyard manure.
Methodology of Sampling
Phenological data for bud swelling, bud burst, and shoot emergence were observed twice per week and occasionally on consecutive days to minimize experimental bias. During the experimental period of 2019-2020, the timing of these phenological stages was determined using the Julian calendar, or day of year (DOY). Based on phenological observations, the number of days from 1st February to bud swelling (BS) and bud burst (BB) was calculated. Based on visual observations for each variety at URFK Chakwal in the years 2020- 2021, healthy vines with uniform vigor, height, and productivity potential were trained on trellis systems. Using the lottery method, nine vines of each cultivar were chosen at random from three blocks containing three vines each. To prevent any losses to the selected plants, the orchard was managed using standard management practices, such as pruning, irrigation, fertilizer, fungicide, and insecticide treatment. Morphological data were collected twice a month for shoot number, leaf number, plant height (cm), internodal length, trunk diameter (cm), disease incidence (%), and heat damage (%). Physiological data were recorded monthly with an Infrared Gas Analyzer (IRGA).
Canes were selected from mature, healthy vines of each variety at the PMAS-AAUR and URFK locations in Chakwal. At each study location, three healthy canes were chosen. Canes were pruned to a size of 1.5 m with a diameter of 15-18 m. During the study period, crop phenological data, such as bud swelling and bud burst, were collected weekly from each planted variety.
Weather Data of Selected Location
Historical weather data (1961-2022) for selected sites in the Pothowar region, namely Rawalpindi and Chakwal, were collected from the Pakistan Meteorology Department (PMD), as shown in Fig. 3. The Soil and Water Conservation Research Institute (SAWCRI) weather station at Chakwal and onsite data loggers for temperature measurements were used to collect growing season weather data (temperature and precipitation, January-July) for experimental years. The active growing season temperature was measured from February to March because it was anticipated that a bud burst could occur in this region from the end of February to March.
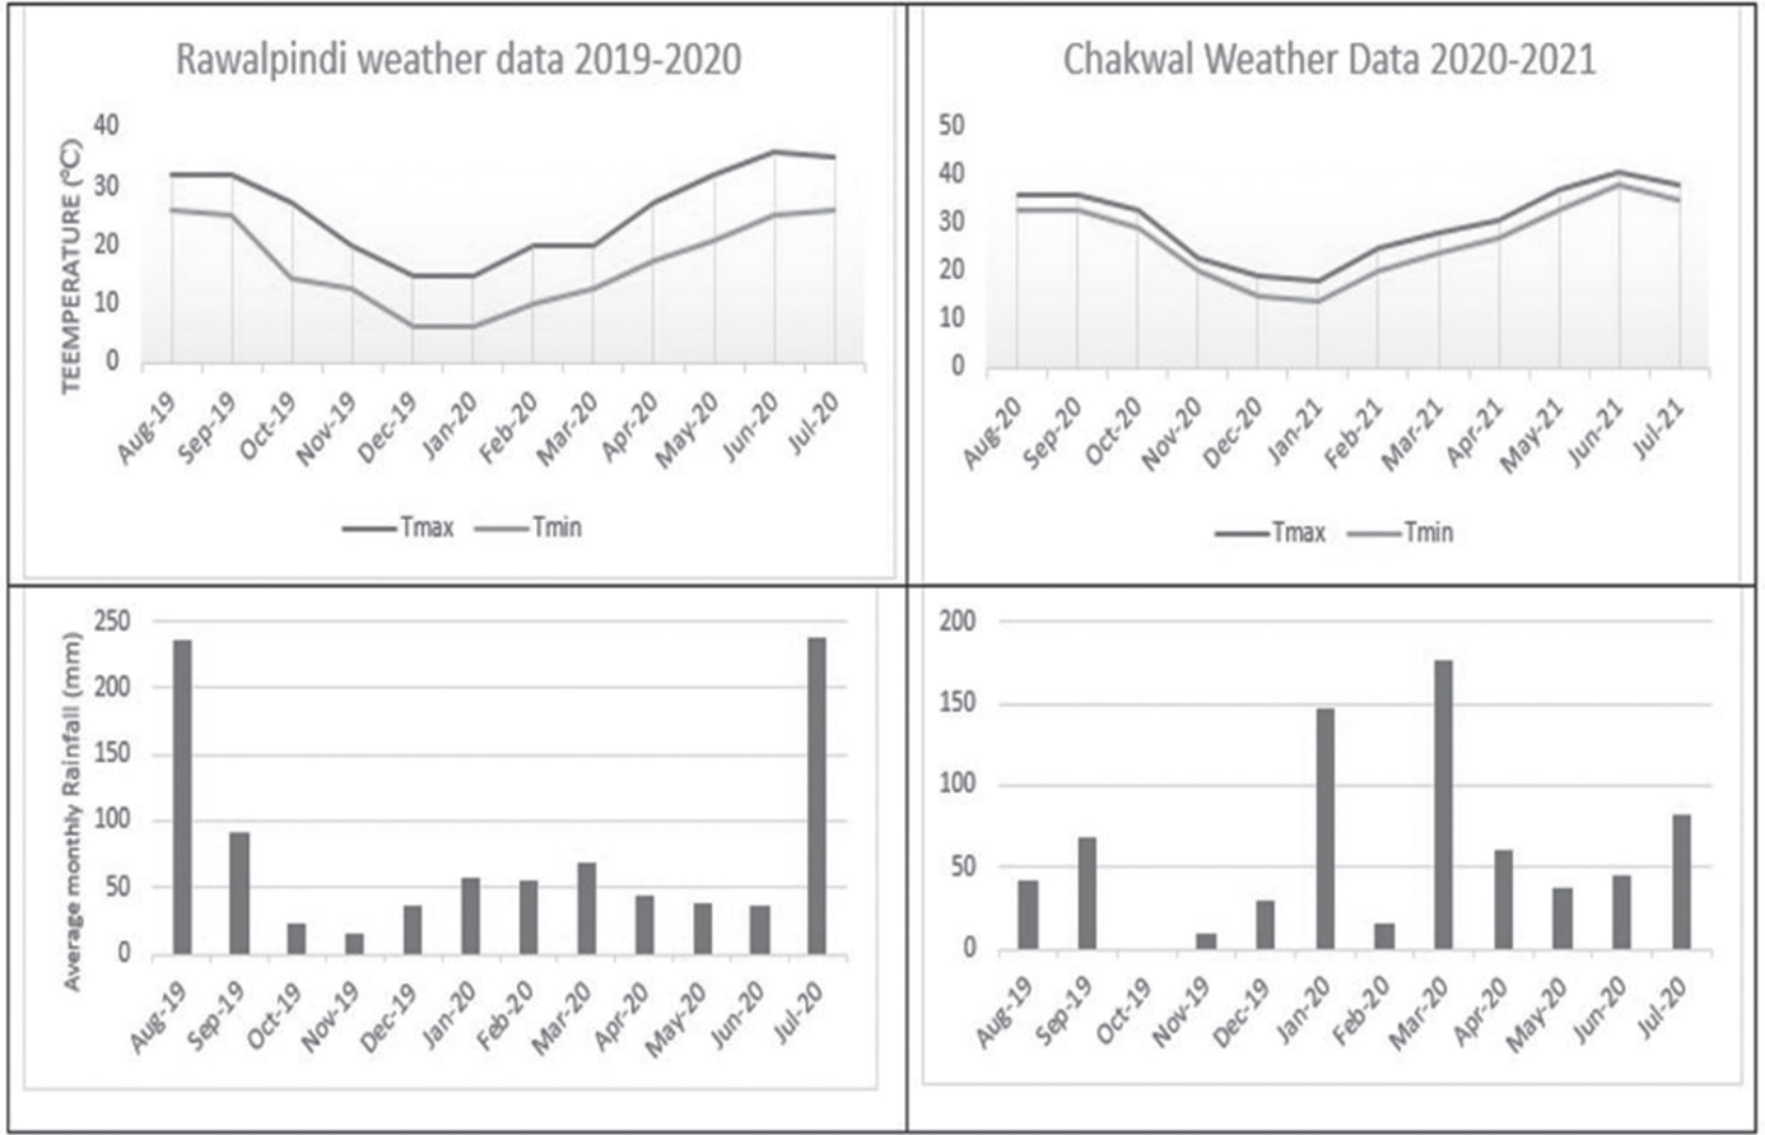
Contrasting environmental patterns were observed at both locations during 2019-2021 with Rawalpindi experiencing a 5ºC cooler climate and 200-250 mm more precipitation than Chakwal (Fig. 5). At Chakwal, warmer summers and winters, as well as a warmer early spring (January-March) were observed between 2019 and 2021 (Fig. 4). The temperature at Rawalpindi remained approximately 3ºC lower than Chakwal during the study period of 2019-2020, whereas the Chakwal temperature remained significantly higher than Rawalpindi. During the study period (2019-2021), a greater temperature difference was observed between two locations, particularly 5ºC and 8ºC, during February and March as compared to the entire year. Weather data also indicated that spring arrived earlier in Rawalpindi during the 2019-2020 study period than in Chakwal during the 2020-2021 study period. In contrast, the temperature during the active growing season immediately following the end of dormancy (February and March) in 2019-2020 was 2-3ºC lower at Rawalpindi than at Chakwal for both the maximum and minimum temperatures.
Growing Degree Days (GDD) Calculations in Kiwifruit Varieties
For GDD calculations, Rawalpindi and Chakwal orchard temperature readings were utilized. The daily mean temperature (Ti) was computed by averaging the maximum temperature (Tmax) and the minimum temperature (Tmin) according to Equation (1).
Growing degree days (GDD) to key phenological stages were calculated as accumulated heat units above a base temperature (Tb) of 10ºC beginning on February 1st of each year, as described by Fraga et al. (2015), using Equation (2). The following assumptions were also used when calculating GDD:
Fig. 3.
Historical mean monthly temperature (1961-2022) at (a) Rawalpindi and (b) Chakwal rainfed Pothowar region of Pakistan.
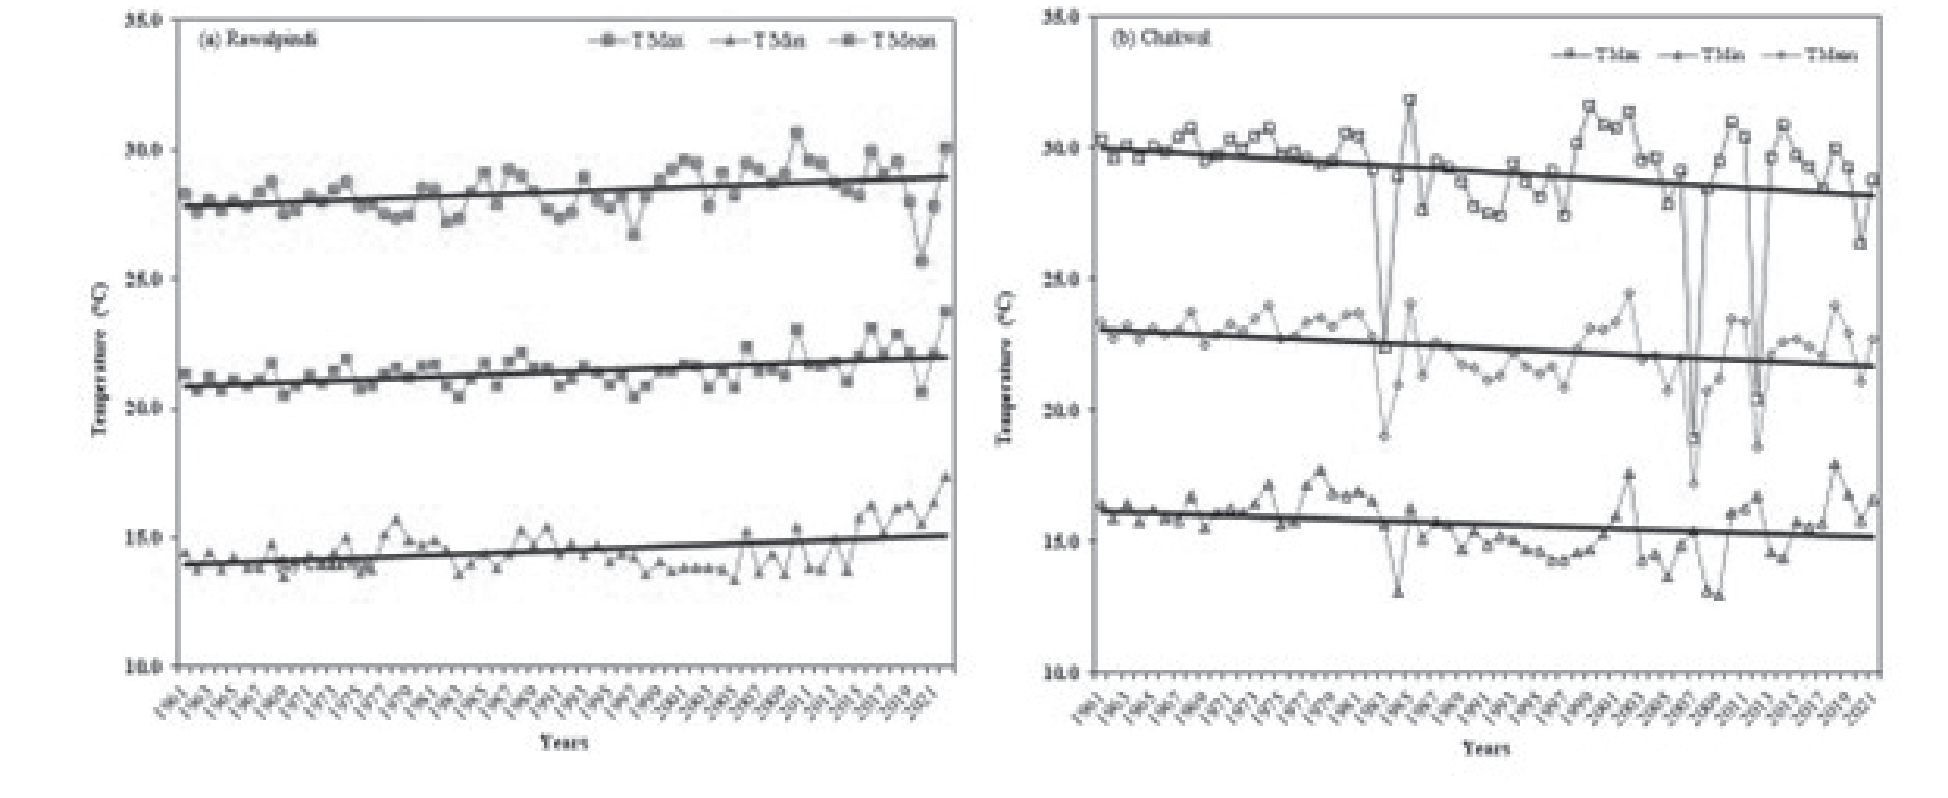
Fig. 4.
Monthly temperature (Tmax, Tmin) and rainfall at Rawalpindi for the study period 2019-2020 and Chakwal for the study period 2020-2021.
It was assumed that if T mean<Tbase, then Tmean = Tbase and there was no GDD accumulation. The upper temperature (Tceiling) limit for this region’s hot summer climate was set at 37ºC, as higher temperatures inhibit growth and development. Phenological data were recorded on the Eichhorn and Lorenz phenological (ELP) scale and arranged according to the Julian calendar (DOY), with means and standard error calculated for comparison purposes. For the representation of phenological and climatic data, the graphical software SigmaPlot.v12.2, Systat Software, Inc., San Jose, California, USA (https://systat.com), and the graphical toolbox in Microsoft Excel were used.
Statistical Analysis
Bud was considered to have broken dormancy when the bud scaled up on top of the green bud. When 50% or more of the buds had broken on two consecutive sampling dates, the dates were recorded. The first of these sampling dates was used to estimate the bud break rate. R Studio and SigmaPlot.v12.2, Systat Software, Inc., San Jose, California, USA (https://systatsoftware. com), were used along with the Microsoft Excel graphical toolbox to calculate mean, standard error, and prepare graphs based on phenological, physiological, and morphological data collected.
Results
Bud Burst Variation among Kiwifruit Varieties
At both locations, kiwifruit vine bud burst began at different times for different varieties (Fig. 5 and Table 2). The total number of days between bud initiation, bud enlargement, and bud burst varied among the five varieties. Days of the year (DOY) to complete bud burst stages varied between varieties and locations (Fig. 5). Overall, more DOY for bud burst was observed in all varieties at Chakwal than at Rawalpindi. Among varieties at both locations, the bud burst stage was completed earlier in Hayward (H) than in Goldflesh. Goldflesh (GDF) took 140 days in Rawalpindi and 160 days in Chakwal to complete the bud burst, whereas Hayward (H) completed the bud burst in 112 days in Rawalpindi and 130 days in Chakwal. Bruno (B) and Greenflesh 2 (GF2) completed bud bursts in 126, 129, 120, and 129, respectively, in Rawalpindi and Chakwal. Greenflesh 2 (GF2) completed bud burst in 137 at Rawalpindi and 156 at Chakwal. The results indicated that bud burst occurred earlier in Rawalpindi than in Chakwal, although the order of completion of bud burst stages remained the same for all varieties at both locations.
Variable initiation of bud burst in kiwifruit varieties was observed, with the majority of vines reaching up to 50% of bud opening in March and continuing until the end of February (Table 3). A remarkable difference in bud initiation and full bud opening was observed at two different locations. The Hayward (H) variety experienced an earlier bud burst than the Goldflesh (GDF) variety. Bud burst order in terms of earlier and later in all kiwifruit varieties remained the same, i.e., Hayward Bruno Greenflesh 1, Greenflesh 2, and Goldflesh, except bud burst onset dates, which varied between the two locations. At Rawalpindi (2019-20), Hayward (H), Bruno (B), and Greenflesh 2 (GF2) began bud burst in February, with a greater number of bud bursts than Chakwal. Hayward, Bruno, and Greenflesh 2 (GF 2) required fewer days to reach the stage of bud sprouting and shoot development at both locations. The order remained Hayward Bruno Greenflesh 2; however, Goldflesh (GDF) and Greenflesh 1 (GF1) were late in the bud burst and required more days to reach the shoot development stage.
Fig. 5.
Bud burst of different kiwifruit varieties in the years 2019-2020 at Rawalpindi (above) and 2020-2021 at Chakwal (below).
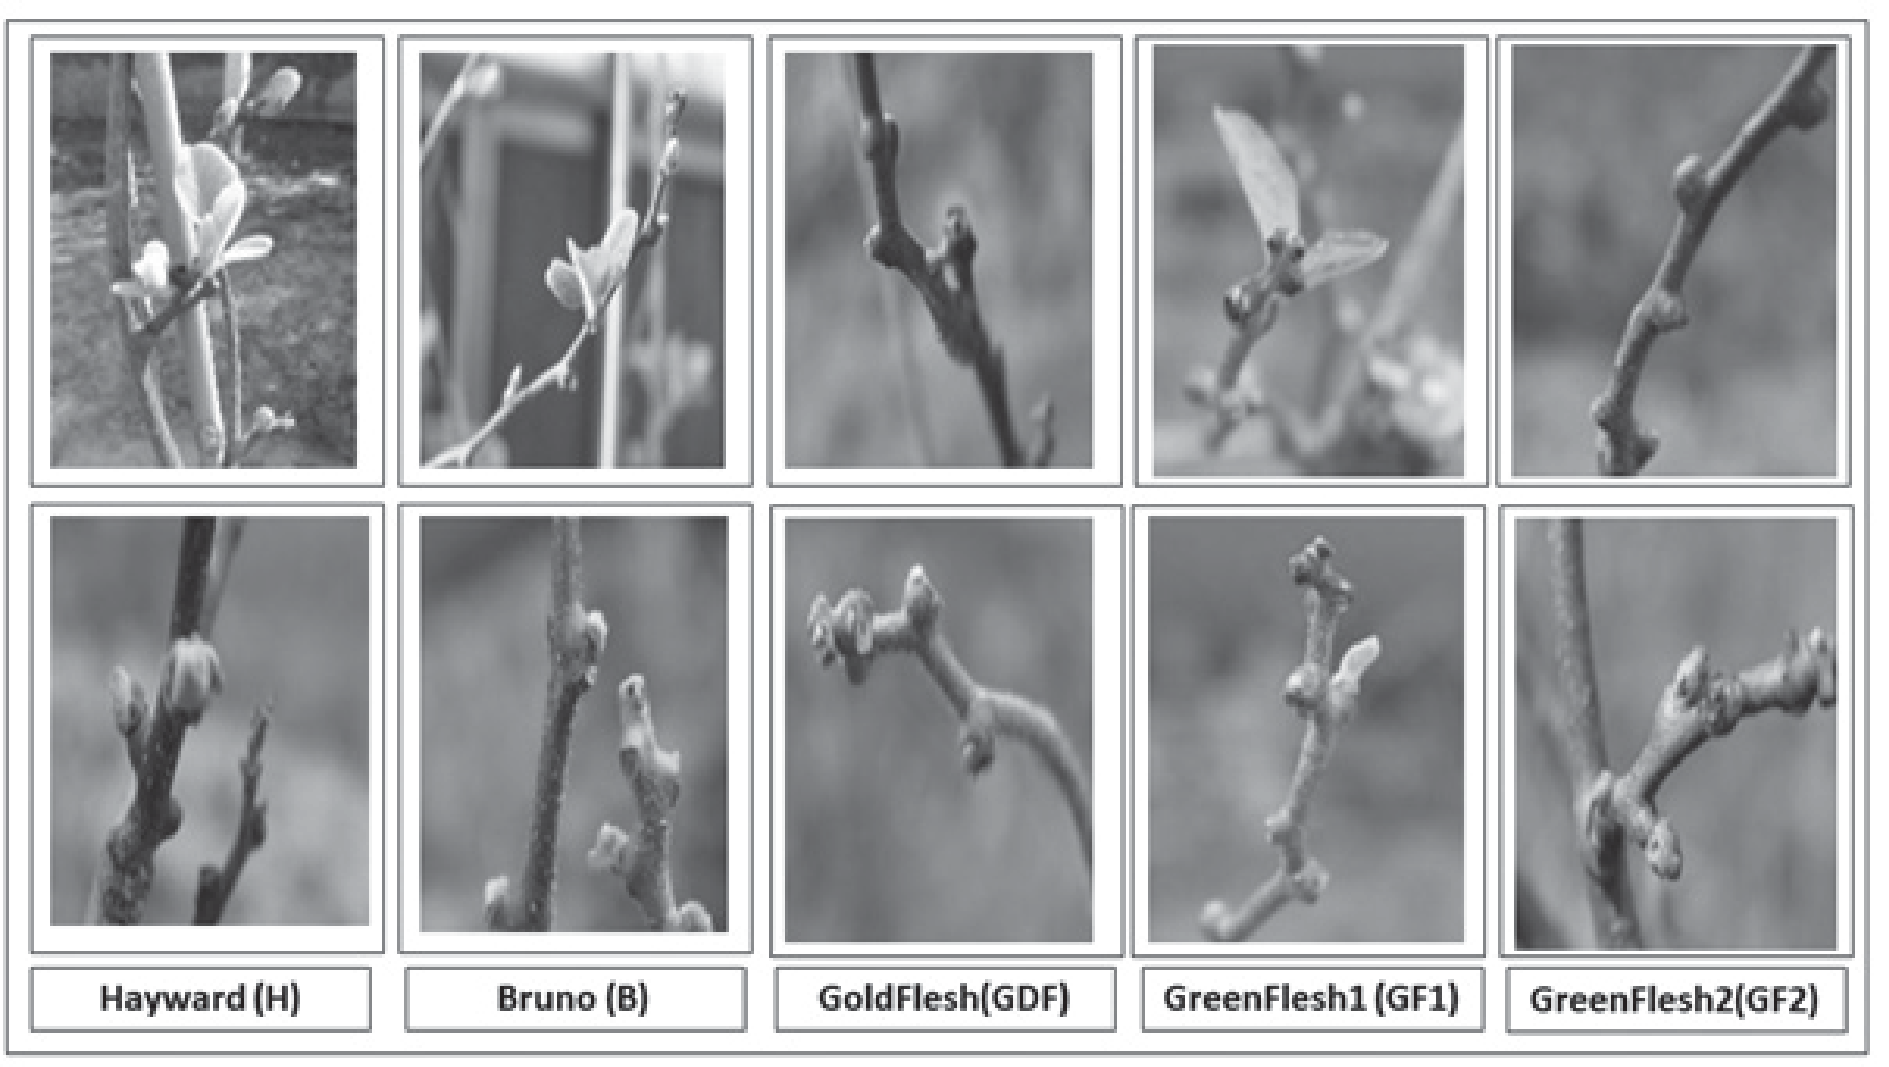
Table 2.
Average number of days (DOY) taken to complete bud burst stages in kiwifruit varieties in the years 2019-2020 at Rawalpindi and 2020-2021 at Chakwal.
| Varieties | 2019-20 (Rawalpindi) | 2020-21 (Chakwal) |
|---|---|---|
| Hayward | 112±9.8 | 130±14.5 |
| Bruno | 126±11.6 | 129±13.5 |
| Goldflesh | 140±16.6 | 160±21.7 |
| Greenflesh 1 | 137±15.2 | 156±19.5 |
| Greenflesh 2 | 120±12.8 | 129±12.3 |
Growing Degree Days (GDD)/ Heat Units to Key Phenological Stages in Kiwifruit Varieties
Growing degree day (GDD)/crop heat unit (CHU) requirements for key phenological stages, i.e., Bud initiation (BI), Bud Swelling (BS), Bud Burst (BB), Leaf Emergence (LE), and shoot Emergence (SE), varied among kiwifruit cultivars during 2019-21 (Table 4). Leaf emergence and shoot development values also varied in all cultivars at both locations, with LE at 27.0-30.0, 30.0-30.0, 30.0-34.0, 30.0-32.0, 28.0-31, and SE to the 3-leaf/10 cm shoot stage at 31.0-33.0, 35.0-34.0, 33.0-35.0, 35.0-32.0, and 30.0-32.0 at Rawalpindi and Chakwal, respectively. Heat units required for phenological change varied between the two locations, while Rawalpindi accumulated more GDD than Chakwal. Early phenological stages, such as the bud, exhibited fewer differences in heat units than later stages, such as leaf development and shoot emergence, although leaf development and shoot emergence are characterized by greater heat unit variations. However, these differences are significantly reduced when expressed as daily heat unit accumulation.
Table 3.
Average bud burst percentage of different kiwifruit varieties in the years 2019-2020 at Rawalpindi and 2020-2021 at Chakwal.
Physiological Traits of Kiwifruit Varieties
Monthly trends in the photosynthetic activity of the kiwifruit varieties have been shown in Table 5, while physiological trait responses have been given in Table 6. Before the onset of dormancy and during the leaf development stage (Table 5), photosynthetic activity was observed in all five cultivars for the 2019- 2020 season in Rawalpindi and the 2020-21 season in Chakwal. The collected data revealed that newly developed leaves had greater photosynthetic activity than older leaves. There was a significant difference between varieties, and it also varied between two consecutive years at two different locations. Among all kiwifruit varieties, Hayward (H) exhibited the highest photosynthetic activity, followed by Bruno (B) with a slight difference, and Greenflesh 2 (GF2), respectively. In contrast, Goldflesh (GDF) and Greenflesh 1 (GF1) maintained their lower values. Rawalpindi had a lower level of photosynthetic activity compared to Chakwal. The photosynthetic activity of all five species varied before and after dormancy, as well as in response to changes in temperature. The dormant period began in December and continued until the end of March, depending on the variety, as some had fewer dormant days. After dormancy, there was a slight change in photosynthetic activity. Chakwal maintained higher photosynthetic activity. All five varieties exhibited photosynthetic activity in the following order: B<H<GF2<GF1<GDF.
Results clearly showed that all five varieties vary in terms of physiological parameters under the two variable climates of Rawalpindi and Chakwal (Table 6). The photosynthetic rate was higher in Bruno, followed by Hayward and Greenflesh 2, whereas it exhibits lower values in Greenflesh 1 and Goldflesh. All varieties showed increased values at Chakwal as compared to Rawalpindi. Leaf r elative water contents (LRWC) of all five varieties were lower at Chakwal as compared to Rawalpindi, however, Greenflesh 2 showed higher values for LRWC among all varieties, whereas Bruno and Hayward gave closer values. Greenflesh 1 and Goldflesh LRWC were lower among all varieties and the decline was higher between the two locations. Relative saturation water deficit (RSWD) was higher in Goldflesh (1280±28.8) and Greenflesh 1 (1200±25.9), followed by the lowest values of 860±21.22 in Greenflesh 2, Bruno 980±21.6, and Hayward 1025±23.8. RSWD in all varieties increased at Chakwal as compared to Rawalpindi. The transpiration rate was higher in Goldflesh as compared to all other varieties. A lower transpiration rate was observed in Greenflesh 2 and Hayward. Transpiration rate, Stomatal conductance, and Chlorophyll contents were higher at Chakwal as compared to Rawalpindi.
Table 4.
Growing Degree Days (°C day-1) to key phenological stages in kiwifruit cultivars during 2019-21 calculated from 1st February.
Table 5.
Monthly trend in photosynthetic activity of the kiwifruit varieties at two locations.
Table 6.
Physiological parameters of kiwifruit varieties under two variable climates i.e. Rawalpindi and Chakwal.
Morphological Response of Kiwifruit Varieties
Heat damage, shoot length, trunk diameter, number of leaves, and disease incidence for each of the five kiwifruit varieties varied significantly among the two locations. Variation was highly significant for heat damage percentage at two locations; in Chakwal, all varieties exhibited a greater heat damage percentage than in Rawalpindi (Table 7). The order of heat damage for all five varieties in Rawalpindi remained GF1<GDF<B<H<GF2, whereas at Chakwal, the order was GF1<GDF<H<B<GF2.
Shoot length, trunk diameter, number of leaves, internodal distance, and disease incidence varied between both locations and all varieties. In the case of shoot length, Hayward (H) outperformed all other varieties, while Greenflesh (GF1) performed poorly (Table 8). Physiologically, varieties performed in the following order: H<B<GF2<GDF<GF2, and all varieties exhibited variable responses at both locations. It was discovered that physiology was more dependent on variety than temperature. At both locations, the shoot length was longer in Hayward (H), but it was shorter in Rawalpindi than in Chakwal. In terms of shoot length, Bruno (B) was second. The lowest performance was observed in GF2. At the Chakwal location, all varieties were at their highest, but the order is still H<B<GF1<GDF<GF2. Trunk diameter (cm) has shown greater variability at both locations, and the highest trunk diameter was observed for Bruno (B), followed by Hayward (H) and Greenflesh 2 (GF2). However, Greenflesh 2 (GF2) displayed the smallest trunk diameter. The trunk diameters at both locations were in the following order: B<H<GF2<GDF<GF1 (Table 9). Furthermore, the highest number of leaves was observed for Greenflesh 2 (GF2) at Rawalpindi and even higher for Bruno (B) at Chakwal (Table 10). At the Rawalpindi location, the order for the number of leaves was GF2<B<H<GDF<GF1, and at the Chakwal location, it was B<H<GF2<GDF<GF1.
Maximum disease incidence (%) was recorded for GF1 and GDF at both locations, whereas Hayward, Bruno, and Greenflesh 2 were less affected by disease at both locations (Table 11). The order of disease prevalence remains GF1<GDF<GF2<H<B at Rawalpindi and GF1<GDF<GF2<B<H at Chakwal. Overall, the results showed that GF1 and GDF were more affected than all other varieties in both locations. At both locations, disease incidence (%) was highest in GF1 and GDF, whereas it was least prevalent in Hayward Bruno and Greenflesh 2 (Table 10). The order of disease prevalence remains GF1<GDF<GF2<H<B in Rawalpindi and GF1<GDF<GF2<B<H in Chakwal. Overall findings revealed that GF1 and GDF were more affected than all other varieties at both locations.
Table 7.
Monthly average heat damage (%) of the kiwifruit varieties used.
Table 8.
Monthly average shoot length (cm) of kiwifruit varieties.
Table 9.
Monthly average trunk diameter (cm) of kiwifruit varieties.
Discussion
Growing Degree Days (GDD)/ Heat Unit and Bud Burst
Growing degree days (GDD)/ Heat units for different phenological stages of kiwifruit remained significantly different between the two locations from 2019 to 2021. This indicates that GDD information can be used to do adaptability evaluation and kiwifruit commercial production. GDD may be a more accurate and reliable predictor of phenology for orchard planning, as Zhou et al. [103] reported that monitoring fruit tree flowering can help manage orchards, which leads to increased yield and quality. In our studies, the study site Rawalpindi, which was colder than Chakwal, accumulated higher GDD than Chakwal. Similarly, rapid GDD accumulation was observed in 2019-2020, due to a higher growing season temperature (GST). This was consistent with the investigations of Ortega-Farias et al. [104] and Rafique et al. [28], who reported earlier accumulation of GDD under elevated temperatures, which resulted in the fast shift of t h e crop to the next phenological stage. Hence, GDD is a better indicator to quantify the impact of seasonal temperature variability on the phenology of Kiwifruit cultivars compared to other methods. Furthermore, Aslam et al. [35] concluded that a rise in temperature leads to the faster accumulation of GDD, thus resulting in earlier flowering and maturity. Similarly, McMaster and Wilhelm [105] suggested using the correct method to calculate GDD, as different methods estimate different GDD. Hence, researchers and practitioners should mention which method they have used in their calculations so that accurate estimations can be reproduced. Zavalloni et al. [106] developed a GDD accumulation model to predict crop phenology and suggested that improving the timing and efficiency of management decisions related to crop phenology, such as pest control, fertilization, and irrigation, is possible through simulation models. In our studies, Kiwifruit phenological sensitivity to climatic variations and its understanding using GDD can offer a brighter opportunity for future Kiwifruit orchard settings. Furthermore, it is essential for making strategic decisions regarding the selection of varieties and the breeding of new cultivars. The results also contribute to an understanding of kiwifruit phenology, which is essential for planning orchard operations in new regions with distinct climatic conditions. Inherent phenological variation among varieties may also help growers make more accurate predictions when choosing crops best suited to their region’s climate.
Table 10.
Monthly average number of leaves of the kiwifruit varieties used in the study.
Table 11.
Monthly average disease incidence (%) of the kiwifruit varieties used in the study.
Temperature and Variety Regulate the Onset of Bud Burst in Kiwifruit
The bud break of deciduous crops is affected by many factors, but temperature and variety have more significant impacts on it [78, 107-110]. Bud burst is a critical phenomenon in kiwifruit, and earlier bud burst refers to the varieties that received sufficient chilling hours and completed bud burst earlier, whereas varieties that did not receive the necessary chilling hours were late in the bud burst [111]. The phenology of bud burst is solely correlated with the chilling requirement of kiwifruit, and it varies among varieties, as reported in our study. A correlation between temperature and bud opening was observed in our work. Furthermore, the length of the growth cycle was longer at Chakwal than it was in Rawalpindi, as more days were needed to complete each stage of the bud. The difference in these stages at both of these study locations during the study period can be attributed to the lower temperatures at Rawalpindi and slightly higher temperatures at Chakwal, which prolonged the vegetative growth period [52]. Consequently, temperature variation can affect the duration (days of years) required for bud break [28, 91, 112]. In comparison to Chakwal, the results showed that bud burst occurred earlier and was completed in fewer days of years (DOY) at Rawalpindi. Early onset and variation in DOY to complete bud burst are correlated with the annual temperature difference between the two locations over two years [113]. At both locations, the average temperature at the onset of the bud burst and completion of the bud burst (February and March) were different. The average temperature in Rawalpindi during February and March was significantly higher than in Chakwal (Fig. 5). The variation in DOY to complete bud burst at each location was caused by temperature differences at each location. At Rawalpindi, varieties received sufficient chill hours during December and January and completed the bud burst stages earlier than those in Chakwal. Earlier reported variety-specific chilling requirements of kiwifruit ranged from 528 to 816 [52, 114]. Our study findings are in line with the work of Ramos and de Toda [115] and Morales-Castilla et al. [56], who found that an increase in temperature tends to shorten phenological phases, resulting in the early ripening of fruits. Similarly, Leolini et al. [116] and Biasi et al. [53] found that the transition in the phenological stages is dependent on temperature, which is a key climatic variable that regulates the genotype-environment relationship. Furthermore, Piao et al. [117] reported that plant phenology depends on temperature, and recent climate change has shown a significant impact on plant phenology, as we have seen earlier onset of bud burst in kiwifruit.
The variation in bud initiation and full bud opening is also dependent on the cultivar, and it was observed at both locations in 2019-2020 and 2020-2021 as cultivars initiated and completed bud breaks at different times during the respective months. The variation in bud burst among cultivars was due to their varying chilling requirements [118, 119]. The results of this study can be correlated with the findings of Wang et al. [120], who studied the effects of photoperiod, winter chilling, and spring forcing temperature on crop phenology and concluded that spring warming is likely to advance plant phenology and that reduced chilling and shorter photoperiod will offset the spring warming effect. Similarly, Ruiz et al. [121] indicated a negative correlation between chilling requirements for the breaking of dormancy and heat requirements for flowering, while there is a positive correlation between chilling requirements and the flowering date.
Temperature and Variety Affect Kiwifruit Morphology and Physiology
During the 2019-2020 and 2020-2021 study periods at two locations, the morphological, and physiological parameters of different kiwifruit varieties varied, but the differences were minor as compared to those differences that were observed for phenology. Similar results were reported by Li et al. [122], who concluded that high-temperature resistance varieties should be used in the future to have good morphological and physiological traits. Furthermore, Zhong et al. [123] explored the growth and physiological responses of four kiwifruit genotypes to salt stress and evaluated the tolerance using PCA. They suggested that tolerant germplasm should be considered for rootstock breeding of kiwifruit. Similarly, Abid et al. [124] suggested that the identification of tolerant germplasm resources using physiological parameters could be a good option for kiwifruit breeding against abiotic stresses. The physiological response of gold kiwifruit to reduced irrigation was evaluated by Mills et al. [125], and they suggested germplasm that has better stomatal control and other physiological traits under water stress should be considered for regions where water stress is common, which is similar to our findings. Furthermore, quantifying/predicting water use characteristics under changing environmental scenarios can help suggest future cultivars for new climates [126].
Conclusions
The results of the current study showed that GDD information can be used to do adaptability evaluation and kiwifruit commercial production. Since GDD can help predict crop phenology accurately, we can improve the timing and efficiency of management decisions related to crop phenology, such as pest control, fertilization, and irrigation. Studied varieties performed better in terms of morphology and physiology in regions where temperatures were lower compared to regions with higher temperatures. The phenological, morphological and physiological characteristics of various varieties of kiwifruit provide valuable information for the adaptability of this new crop. This will aid in the delineation of new growing areas for this crop. Moreover, it can help determine the optimal temperature for its growth. Similarly, the planning of efficient orchard setting and management practices for kiwifruit can be improved through this study. In addition, knowledge of kiwifruit phenology and morphology will aid in the comprehension of the impact of climatic variations by predicting the onset of key bud burst stages for nutrient, pest, and disease management. In addition, improved phenological awareness will help farmers adopt this new high-value crop and implement innovative precision technologies for profitable orchard management. Furthermore, we suggest that this study be further extended to multiple sites with the involvement of different stakeholders to generate more valuable information about the adaptability of this new crop in Pakistan.

