


Introduction
Electricity generation is a critical component of modern life, powering industries, homes, and infrastructure across the globe. However, the generation of electricity often comes at a cost – environmental emissions, particularly carbon dioxide (CO2), which contribute to climate change and environmental degradation. To address this issue, many countries are striving to reduce their carbon emissions by transitioning to cleaner energy sources and adopting carbon capture and utilization (CCU) technologies [1]. Kazakhstan, a Central Asian nation with a rapidly developing economy, is no exception to these global concerns.
Kazakhstan, the world’s largest landlocked country, is known for its abundant natural resources, particularly in the energy sector [2]. It boasts substantial reserves of coal, oil, and natural gas, which have historically been the primary sources of energy generation in the country [3]. The energy sector plays a vital role in Kazakhstan’s economy, contributing significantly to its GDP and export revenues [4]. As a result, the energy sector is pivotal in shaping the nation’s development and its impact on the environment. Kazakhstan’s energy mix predominantly consists of fossil fuels, and this reliance on hydrocarbons has made the country a significant carbon emitter. With an increasing global focus on climate change and environmental sustainability, Kazakhstan has initiated efforts to transition its energy sector towards cleaner and more sustainable sources. This transition is not only an economic necessity but also an environmental imperative to mitigate the impact of climate change [5].
Grid emission factors are key metrics used to quantify the carbon emissions associated with electricity generation [6]. These factors provide insight into the carbon intensity of the electricity consumed by a region or country. In the context of Kazakhstan, understanding grid emission factors is essential for assessing the environmental impact of its electricity generation and evaluating progress in reducing carbon emissions. Grid emission factors are influenced by the energy mix, energy efficiency, and emission control measures in place within a country [7]. By analyzing these factors, it becomes possible to identify areas where improvements can be made, such as shifting to cleaner energy sources or adopting CCU technologies. This information is invaluable for policymakers, energy producers, and environmentalists who seek to strike a balance between energy security, economic growth, and environmental sustainability [8].
Carbon dioxide utilization is an emerging approach in the battle against climate change. It involves capturing carbon dioxide emissions and converting them into valuable products, such as chemicals, fuels, and building materials [9]. This concept not only reduces carbon emissions but also offers economic opportunities by creating new industries and reducing waste. CCU is seen as a promising avenue for addressing the challenge of carbon reduction while promoting sustainable economic growth. The idea of CCU has been gaining momentum globally as nations seek innovative ways to address carbon emissions and meet climate targets. In Kazakhstan, exploring the feasibility and public perception of CCU is an important step toward sustainable development [10]. This study delves into the attitudes and perspectives of the Kazakh population regarding the utilization of carbon dioxide, shedding light on the social, cultural, and economic aspects that may influence its adoption. This study is distinctive for its exploration of community-centered carbon reduction efforts and their effect on grid emission factors, specifically within the distinctive setting of Kazakhstan. Such an approach is relatively scarce in the existing literature, making this research a noteworthy contribution to the field.
In this study, we aim to provide a comprehensive analysis of grid emission factors associated with electricity generation in Kazakhstan and an evaluation of public attitudes towards carbon dioxide utilization. By investigating these two critical aspects, we hope to contribute to a broader understanding of the challenges and opportunities that Kazakhstan faces in its pursuit of sustainable energy and environmental policies. This research is timely, given the global emphasis on mitigating climate change and achieving a more sustainable and carbon-neutral future.
Materials and Methods
Case Study Description
Kazakhstan’s electricity system comprises three distinct energy zones shaped by power generation, grid infrastructure, and consumption dynamics. The North zone, serving 41% of the population, boasts a 13.6 GW generation capacity with a 14.8 billion kWh surplus and a peak load capacity of 9.6 GW. In contrast, the South Zone has a 2.8 GW generation capacity, an 11.1 billion kWh deficit, and a 3.6 GW peak load capacity. These zones are connected via essential transmission lines. The North-South energy zone, supported by transmission lines, balances power supply between regions. The West Zone relies on the Russian Urals Integrated Energy System. Energy sources vary regionally, with gas-fired generation predominant in the West and coal-fired generation in the North and East due to resource availability and costs. Kazakhstan’s power system includes 150+ plants, categorized as national, industrial, and regional. Large thermal plants supply the wholesale market, CHP facilities serve industries and communities, and regional plants handle local distribution. Kazakhstan currently lacks nuclear power but plans a 1,500 MW station near Lake Balkash.
Estimation of Grid Emission Factors
Determination of Combined Margin Emission Factor and Calculation of Operating Margin (OM)
The emission factors for the study were calculated using the combined margin emission factor (EFCM), which incorporates the Operating margin emission factor (EFOM) and the Build margin emission factor (EFBM) as components. It is important to mention that the CDM guideline provides a formula for calculating the power grid emission factor (EF). Equation (1) was utilized to compute the combined margin emission factors.
Whereby, a and b represens the shares of Operating margin and Build margin emission factors. In most cases a = b = 50%.
Additionally, for the calculation of the Operating Margin (OM) emission factors, the Simple OM approach was applied, which aligns with Kazakhstan’s energy mix. This method computes CO2 emissions per unit of net electricity generation, excluding low-cost/ must-run (LCMR) plants, and is based on data regarding power plant types, the exclusion of LCMR plants, and three years of information, as shown in Equation (2). This approach aids in understanding the environmental impact of electricity generation in Kazakhstan.
Whereby, the simple operational margin (EFOMsimple,y) for the carbon dioxide emission factor in a specific year (y) is determined using Equation (3). In the equation, EGm,y represents the net electricity production and delivery to the grid by power unit (m) during the year (y) in megawatt-hours (MWh), while EFEL,m,y represents the carbon dioxide emission factor for power unit (m) in a year (y) measured in metric tons of CO2 per megawatt-hour (t CO2/MWh). The equation is applied to all power plants providing grid services in the relevant year, excluding low-cost/must-run power units.
Equation (3) is used to calculate the emission factor (EFEL,m,y) for each power unit (m) in the given year (y).
Whereby, FEEL, my is the power unit m’s carbon dioxide emission factor for the year y (t CO2/MWh); FCi,m,y represents the amount of fuel type (i) consumed by the power unit (m) during the year (y), measured in mass or volume units. NCVi,y refers to the net calorific value or energy content of fuel type (i) in the year (y), measured in gigajoules per mass or volume unit. EFCO2,i,y represents the carbon dioxide emission factor of fuel type (i) in year (y), measured in metric tons of CO2 per gigajoule (t CO2/GJ).
Calculation of the Simple Adjusted OM Emission Factor
A modified version of the Simple OM approach called the simple adjusted OM emission factor (EFgrid, OM-adj,y) is used, which categorizes power plants/units (including imports) into two groups: low-cost/must-run (LCMR) power sources (represented by k) and other power sources (represented by m). The basic adjusted OM emission factor is calculated using Equation (4), taking into account the net electricity generation by each power unit and the corresponding emission factor for each unit.
Whereby, λy is the percentage of time factor that LCMR power units are on the margin in year y.
Calculation of Build Margin Emission Factor and Combined Margin Emission Factor (CM)
The Build Margin Emission Factor (EFBM) is determined using both ex-ante and ex-post methods, employing specific power plant data. This involves selecting recently commissioned power units that contribute 20% of their annual generation to form SETsample. Data on net generation, fuel consumption, net calorific value, and the commissioning year of the power plants are essential for EFBM calculation, and the same formula as for EFOM is used.
To calculate the Combined Margin Emission Factor (CM), the study integrates the Operating Margin (OM) and Build Margin (BM) emission components. In the North Energy Zone, where LCMR is 50%, only the Simple OM method is used for OM calculation. However, in the south and west zones, where LCMR is not 50%, both the basic OM and simple adjusted OM methods are applied. Additionally, for RES emission factors, OM and BM are proportioned at 75% and 25%, respectively.
Carbon Dioxide Utilization Analysis
The study used a survey questionnaire to examine how participants from two cities in Kazakhstan (Almaty and Astana) perceived the concept of carbon dioxide utilization.
Qualitative Interview Approach and Participants
This study employed individual qualitative interviews to gain comprehensive insights into experts’ and laypeople’s perspectives on emerging technologies, particularly carbon dioxide utilization. Qualitative interviews were chosen to prevent the collection of uninformed or superficial opinions due to the limited awareness of these technologies. They offered detailed information to participants, reducing the potential for false opinions. The study included 18 individuals from Almaty and 10 from Astana, representing diverse professions. The Almaty sample had a median age of 33.7 years, while the Astana sample’s median age was 44.8 years. Both groups had relatively low prior knowledge of carbon dioxide utilization. Additionally, there were no significant differences in gender distribution or self-claimed awareness levels. The research highlighted the diversity in both backgrounds and occupational roles among the participants, offering a comprehensive view of their perspectives on emerging technologies like carbon dioxide utilization.
General Introduction, Expert Ratings, and Pre-Interview Questionnaire
This section restated project objectives, introduced the research team, and provided an overview of carbon dioxide utilization’s relevance in mitigating CO2 emissions from major sources like fossil-fuel power generation. It covered CCS as a CO2 sequestration method, addressie its costs, and discussed the potential of carbon dioxide utilization in EOR and product production. The possible advantages of carbon dioxide utilization encompassed decreasing dependence on fresh fossil fuels in the production of goods and mitigating the release of CO2 into the atmosphere [11]. Participants were shown a visual representation of various CO2 capture applications and informed that using renewable or low-carbon electricity was crucial for emissions reduction. They evaluated these options based on eight criteria, with higher scores indicating better evaluations. The evaluators were experts in carbon dioxide utilization, and a pre-interview questionnaire collected background information. The study had ethical approval, and participants signed consent forms before interviews.
Statistical Analysis
The study used Template Analysis to investigate the pros and cons of carbon dioxide utilization in three main areas: the concept, feasibility, and societal consequences. Additional themes, including interview comments, were also analyzed and coded. Statistical techniques like correlation analysis, data distribution analysis, and ANOVA were employed to assess relationships, data distribution, and significant variations among parameters. The study’s coding template evolved during the process, and various statistical methods were used to gain insights into the data.
Results and Discussion
General Analysis of the Power Zones
Fig. 1 provides an overview of energy production in various zones in Kazakhstan, showing that thermal power plants dominate the energy landscape. These plants generate electricity by heating fossil fuels to produce steam, which powers turbines. However, they release environmentally harmful substances and contribute to thermal pollution. Kazakhstan heavily relies on oil and gas, accounting for a significant portion of the GDP, export revenues, and state budget. Despite this, Kazakhstan is actively working on a Long-Term Low-Carbon Development Strategy for 2060, aiming to double the use of renewable energy sources by 2025, cease new coal projects, and phase out coal combustion between 2021 and 2025. The country has also launched a program to plant two billion trees by 2030 [12].
Kazakhstan’s participation in the EU4Energy Program and the introduction of feed-in-tariffs (FiT) and renewable auctions have been instrumental in promoting renewable energy investments and technologies [13]. While energy production is vital for economic growth, it is also a major contributor to carbon dioxide emissions. The intricate relationship between economic development and carbon emissions requires a comprehensive understanding. Kazakhstan ranks among the top global greenhouse gas emitters and is among the top emitters per capita. Energy production constitutes the primary source of the country’s carbon emissions. Given the significant environmental concerns associated with greenhouse gas emissions and carbon dioxide’s role in climate change, addressing this issue is paramount [14]. Table 1 presents consolidated data from three energy zones in Kazakhstan, offering insights into energy trends and emissions from 2017 to 2020.
Kazakhstan wants to replace its outdated facilities and machinery; thus there are many needs in the market for power generation. In power-generating facilities, roughly 31% of the equipment has been in operation for more than 30 years, and about 65% has been in use for more than 20 years. With an estimated 15% loss in transmission and distribution systems, electricity transmission networks are inefficient [15]. The Kazakhstani government has created an action plan for the development of electric power through 2030, which includes a list of power plants that might be modernized or rebuilt as well as the building of new facilities. From Table 2, it can be seen that the highest emission factors are from the Nothern Energy Zone.
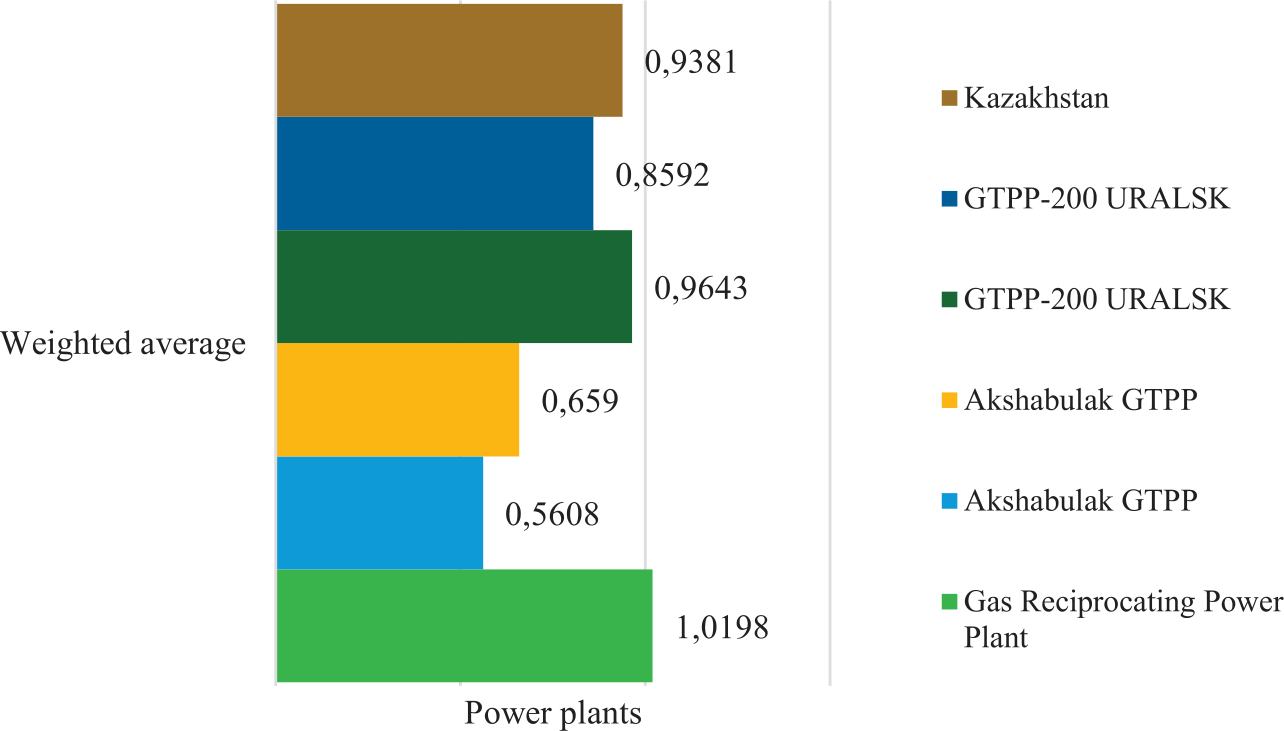
Fig. 2 provides a summary of the weighted average for the selected power plants. From Fig. 2, it can be seen that more than 0.5 weighted average carbon dioxide emissions were retrieved from all the investigated power plants, with the highest observed from the Simple Operating Margin in the North Energy Zone. It should be noted that the average amount of carbon dioxide emitted per unit of electricity produced on the grid is described by the weighted average emission factor [16]. It is computed by dividing the region’s total net generation by the absolute carbon dioxide emissions of all of its power plants. Understanding the balance between energy production and the amount of carbon dioxide produced plays a significant role in the management process. However, although we are learning more about the key processes, we still don’t fully understand how much carbon dioxide the ecosystem can absorb or how precisely the long-term global carbon dioxide equilibrium is maintained [17]. A number of significant political efforts reflect the growing worry among scientists about the steadily rising carbon dioxide levels in the atmosphere on a global scale. The world’s carbon-based fossil fuels are burning and quickly converting to atmospheric carbon dioxide, which is causing carbon dioxide buildup [18].
Fig. 1.
Power systems in different zones a) Kazakhstan Unified Power System (UPS) b) Northern Zone of UPS c) Western zone of UPS d) Southern Zone of UPS
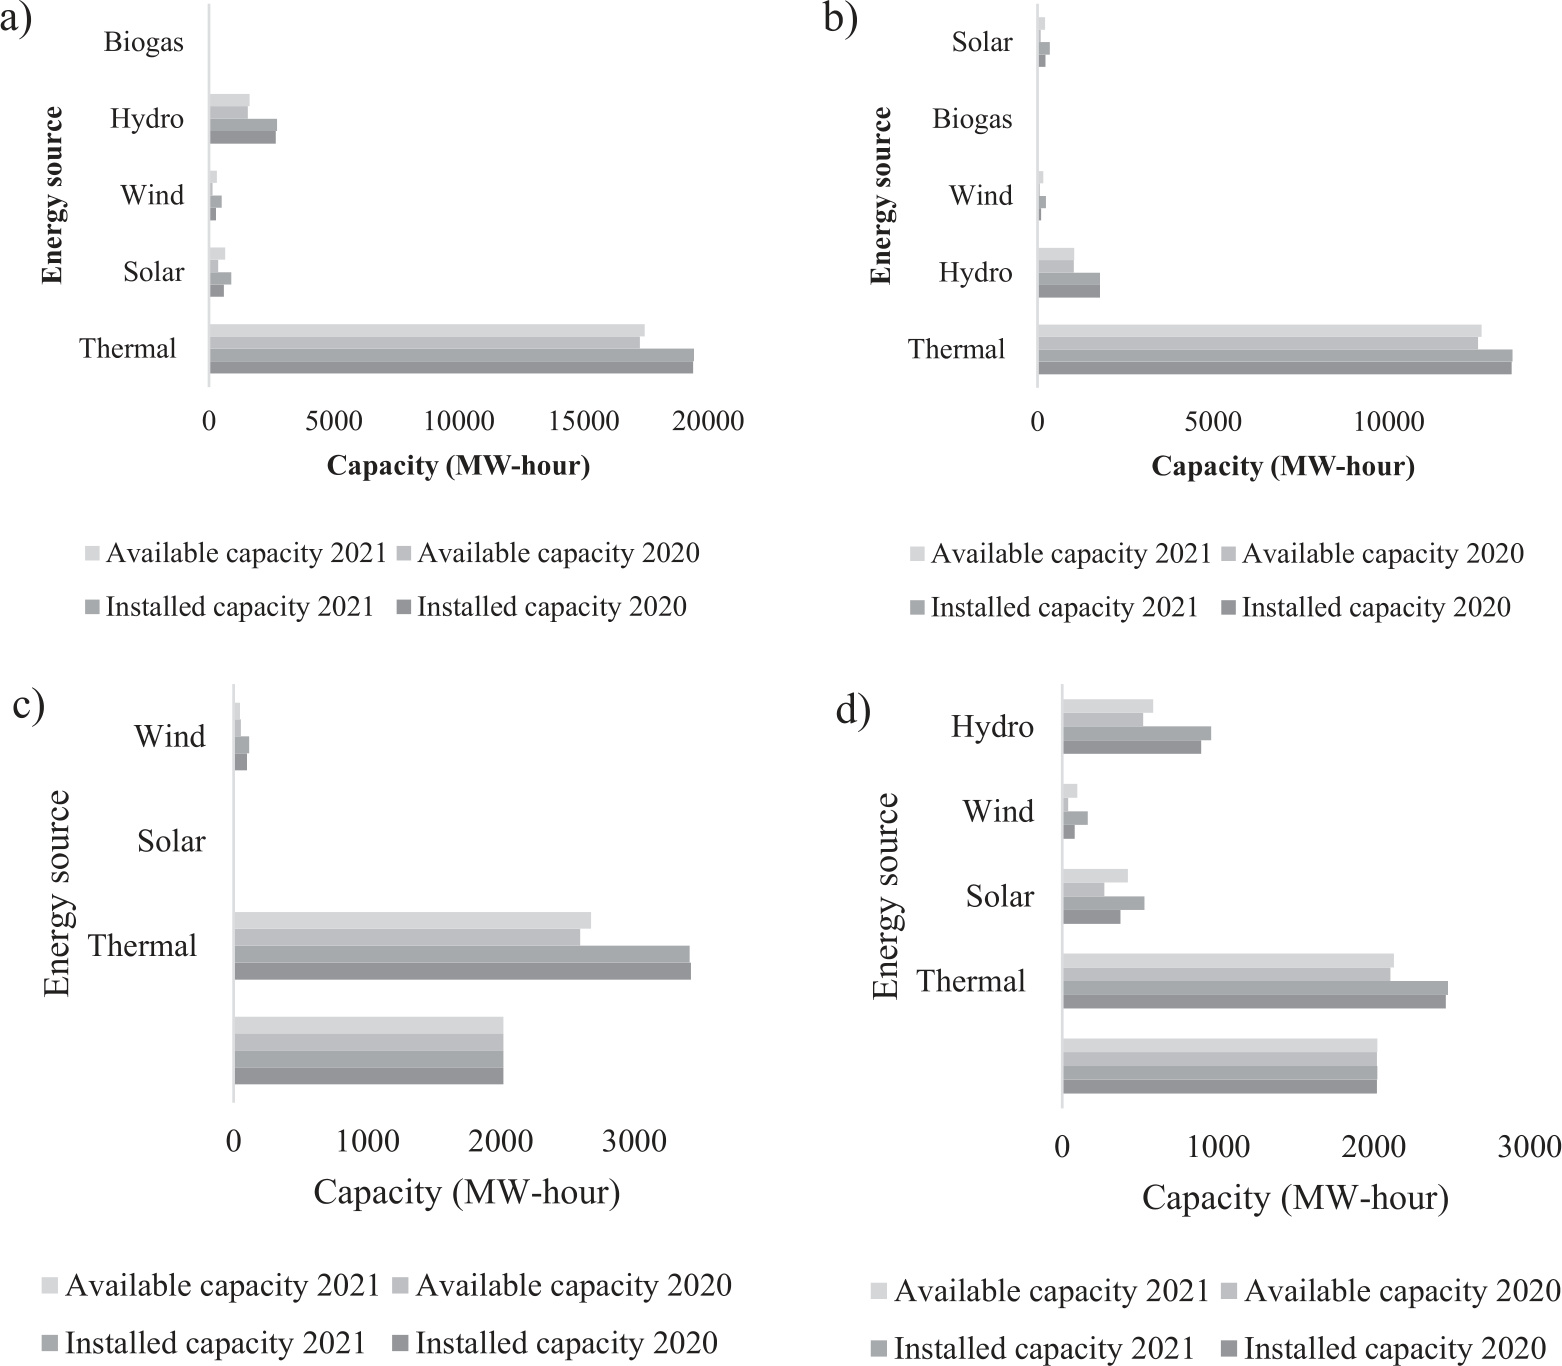
Table 1.
Merged results for the three energy zones of Kazakhstan.
Table 2.
Operating Margin Emission Factor of the Electricity System of Kazakhstan by selected power plants in different zones.
Fig. 2.
Weighted average from the selected power plants. NEZ-SOM = North Energy Zone under Simple Operating Margin, SEZ-SOM = South Energy Zone under Simple Operating Margin, SEZ-SAOM = South Energy Zone under Simple Adjusted Operating Margin, WEZ-SOM = West Energy Zone under Simple Operating Margin, WEZ-SAOM = West Energy Zone under Simple Adjusted Operating Margin.
Analysis of Variance
Single Factor Analysis of Variance
Table 3 provides a summary of the outcomes obtained through the Single Factor Analysis of Variance (ANOVA). ANOVA is a parametric test that assumes the values being analyzed follow a normal distribution, as stated by the null hypothesis [20, 21]. The analysis presented in Table 3 reveals that the ANOVA conducted on the emission factors from various years resulted in a p-value of 0.869253. This p-value, associated with the F-statistic in the one-way ANOVA, exceeds the significance level of 0.05, indicating that there is no significant difference among the treatments. The ANOVA findings also indicate that there was no significant improvement in the reduction of carbon dioxide emissions from 2017 to 2020. Over the course of four years, the rate of carbon dioxide emission remained relatively stable without any significant changes.
Table 3.
Results from ANOVA: Single Factor.
Table 4.
Results from Tukey Honest Significance Difference Test.
Tukey Honest Significance Difference Test
Tukey’s honest significance difference was employed to examine the significance of the differences in emission factors among the years investigated in the case study. Table 4 displays the results, indicating that the p-values associated with the research years were all greater than 0.01. This suggests that the observed changes in the predicted emission factors are not statistically significant.
Correlation Analysis
In statistics, the term “correlation” is used to describe any statistical association or dependency between two random variables or bivariate data, regardless of whether it is causal or not. While the term “correlation” can have a broader meaning in general usage, in statistics it primarily refers to the degree of linear relationship between a pair of variables [22]. Table 5 presents the correlation analysis results, which explored relationships between the year, Simple Operating Margin, and Simple Adjusted Operating Margin datasets from EF (OM). The analysis revealed a strong correlation between the year and emission factors from the Simple Operating Margin (0.81) and the Simple Adjusted Operating Margin (0.68). However, the correlation between the two methodologies was weak, indicating their independence from each other. Interestingly, there was no identifiable pattern in the relationship between emission components from Simple Operating Margin and Simple Adjusted Operating Margin, reflecting their dependence on input data.
Perception on Carbon Dioxide Utilization
Given the limited existing research on public perceptions of carbon dioxide utilization, there is a growing need to enhance our understanding of this subject [11]. To address this research gap, our study aimed to investigate and evaluate how the general public in Kazakhstan perceives carbon dioxide utilization. This investigation followed an exploratory approach, involving qualitative interviews with 28 participants selected from Almaty (n = 18) and Astana (n = 10). The analysis focused on three main themes: conceptual notions, technical considerations, and societal implications related to carbon dioxide utilization. The primary objective was to gain insights into how attitudes toward carbon dioxide utilization are evolving in different regions, taking into account the influence of the existing public perception of Carbon Capture and Storage (CCS) on participants’ opinions regarding carbon dioxide utilization. Overall, the respondents displayed a positive disposition toward carbon dioxide utilization, although this sentiment was accompanied by reservations and skepticism. It is noteworthy that their support for this technology was contingent upon the condition that carbon dioxide utilization should not be the exclusive or sole focus when addressing climate change. Throughout the course of the interviews, three sub-themes emerged in discussions about carbon dioxide utilization, encompassing its effectiveness in addressing climate change, alignment with broader sustainability objectives, and comparisons with other technologies, notably Carbon Capture and Storage (CCS). This comprehensive examination shed light on the multifaceted nature of public attitudes and perceptions concerning carbon dioxide utilization.
The Contribution of Carbon Dioxide Utilization to Climate Change Mitigation, Sustainability Goals and Feasibility
Participants held varying perspectives on carbon dioxide utilization as a climate change solution, expressing skepticism about its effectiveness and concerns about its long-term benefits and connection to fossil fuels. While some viewed it as a temporary solution or a contributor to mitigation, doubts about motivations for its promotion led to calls for stricter monitoring and regulation. Sustainability concerns were raised, but participants recognized potential benefits, such as resource conservation and circular economy principles. The favorability of carbon dioxide utilization varied, with a balance between optimism and pragmatism regarding its technical and economic viability. Concerns included doubts about its immediate impact on global climate change and questions about its energy requirements and potential contribution to increased CO2 emissions. Overall, public opinions on carbon dioxide utilization appear intricate and varied, reflecting a range of views on its role in addressing environmental challenges and promoting sustainability.
Carbon Dioxide Utilization: Commercialization, Societal Impact and Miscellaneous Considerations
The study explored the multifaceted aspects of carbon dioxide utilization, encompassing financial viability and market potential. Participants expressed uncertainties about its commercialization, emphasizing its potential profitability, emissions tax reductions, and appeal to various industries if it offered an economical carbon source. Additionally, the research delved into the societal impact, implications for consumers, public health, and the environment, with diverse perspectives on whether it could promote sustainable practices or serve as an excuse to avoid them. Furthermore, the study addressed the risks, costs, and opportunities associated with carbon dioxide utilization, including job creation and its support for businesses. It also highlighted the importance of effective public communication, facility location considerations, and the need for more comprehensive data to address the various issues surrounding carbon dioxide utilization.
Challenges and Opportunities in Carbon Reduction Initiatives
The results of the survey show that a majority of respondents strongly agree (12) that communities face significant challenges in implementing carbon reduction initiatives, indicating a high level of perceived difficulty in this endeavor (Fig. 3). Furthermore, respondents are largely very pessimistic (6) or pessimistic (4) about the opportunities that carbon reduction initiatives can bring to communities, suggesting a lack of optimism regarding their potential benefits. In addition, there is a strong consensus with 14 respondents strongly agreeing that a lack of funding is a significant challenge for communities in implementing carbon reduction projects. However, there is a more positive outlook on the role of technological advancements, with 16 respondents strongly agreeing that they can create opportunities for more effective carbon reduction in communities, indicating a belief in the potential of technology to facilitate these initiatives.
Fig. 3.
Challenges and opportunities in Carbon Reduction Initiatives a) To what extent do you believe communities face challenges in implementing carbon reduction initiatives? b) How optimistic are you about the opportunities that carbon reduction initiatives can bring to communities? c) Do you think a lack of funding is a significant challenge for communities in implementing carbon reduction projects? d) To what extent do you believe technological advancements can create opportunities for more effective carbon reduction in communities?
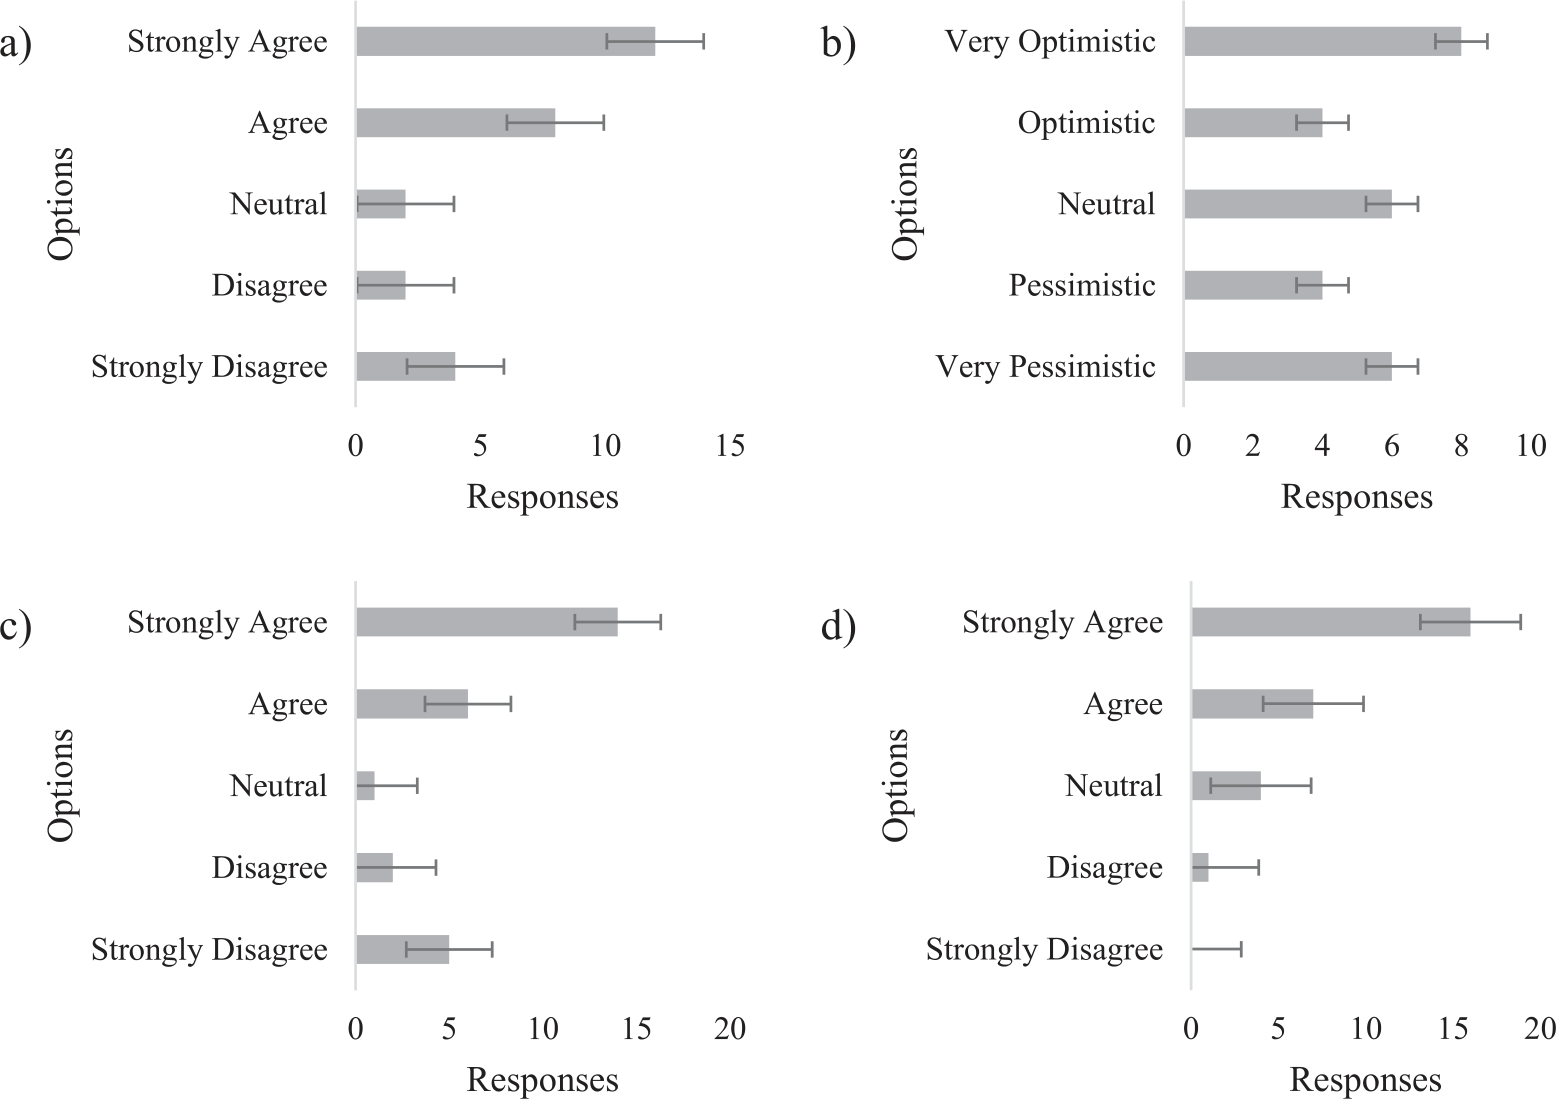
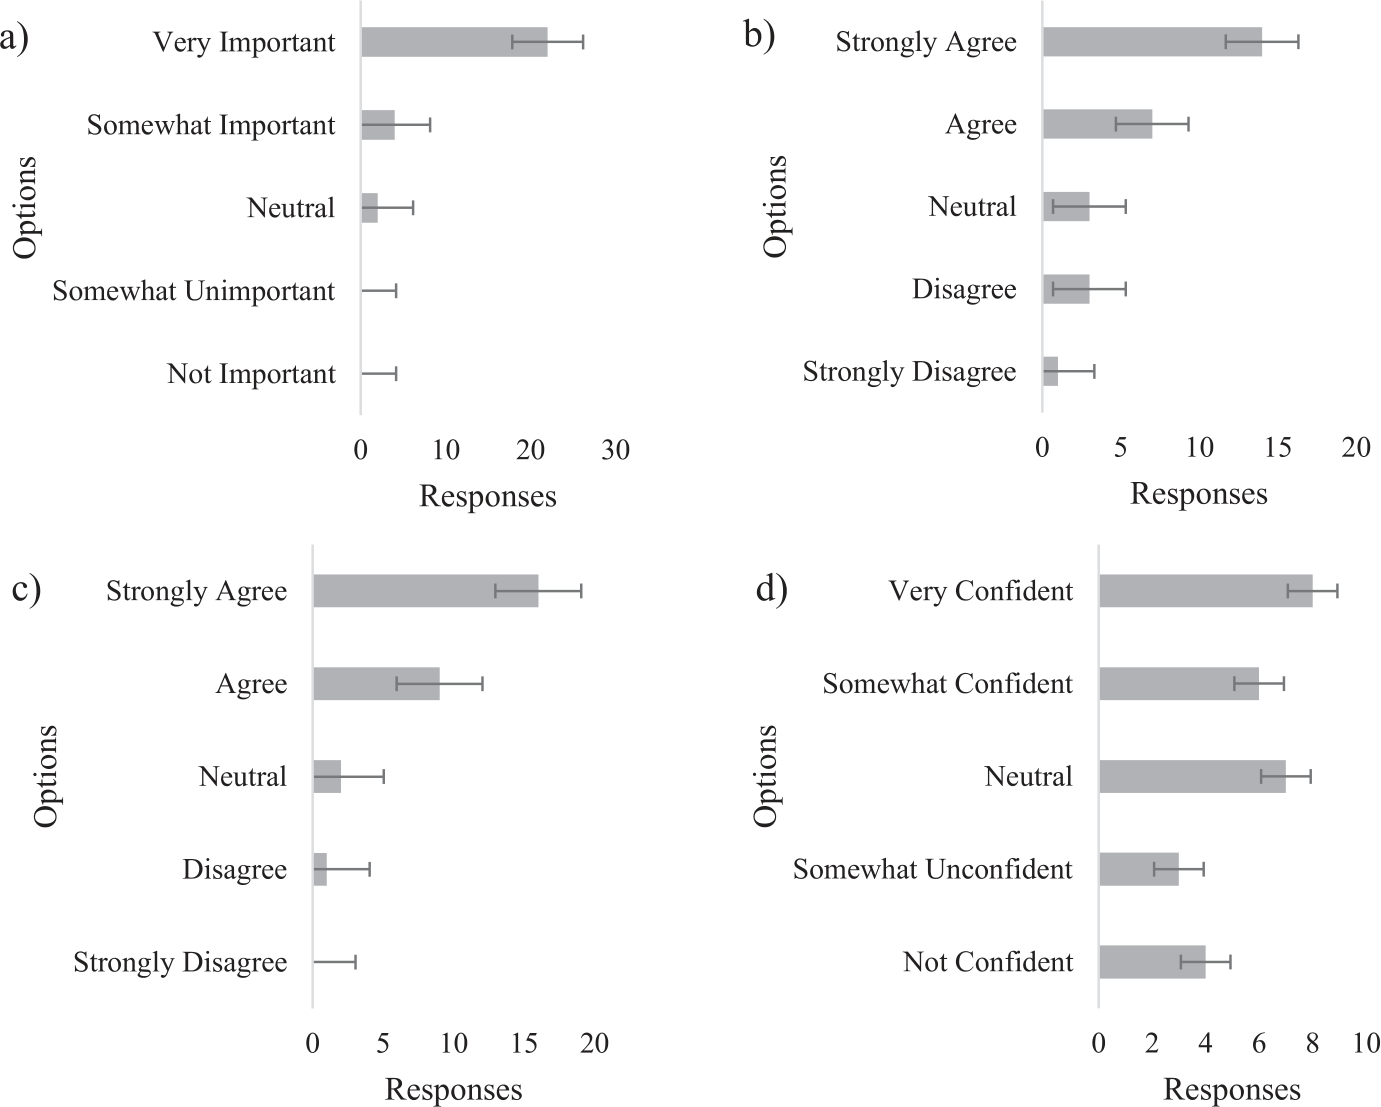
Fig. 4.
Community engagement for reducing Grid Emission Factors a) How important are community engagement and participation in reducing grid emission factors? b) To what extent do you think active community participation can influence the success of grid emission reduction initiatives? c) Do you believe that better public awareness and education can enhance community participation in reducing grid emission factors? d) How confident are you that community collaboration can lead to more sustainable solutions for reducing grid emission factors?
Community Engagement for Reducing Grid Emission Factors
The results of the survey indicate a strong consensus on the importance of community engagement and participation in reducing grid emission factors, with a majority of respondents finding it very important (22) (Fig. 4). Additionally, there is a high level of agreement (14 strongly agree and 7 agree) that active community participation can influence the success of grid emission reduction initiatives, showing a belief in the impact of community involvement. Respondents also strongly support the idea that better public awareness and education can enhance community participation in reducing grid emission factors, with 16 strongly agreeing and 9 agreeing. However, when it comes to confidence in community collaboration leading to more sustainable solutions for reducing grid emission factors, there is a mixed response, with 8 very confident but 7 somewhat unconfident or not confident, indicating a level of uncertainty regarding the effectiveness of community-driven solutions in this context.
Conclusions
This study explored Kazakhstan’s carbon landscape through a statistical analysis of electricity generation emission factors and an assessment of public perceptions in Almaty and Astana. Utilizing correlation analysis and surveys, the research aimed to uncover both deterministic and stochastic elements. In the emission factor analysis, a robust correlation (0.81) between the year and emission factors from the Simple Operating Margin and a weaker correlation (0.68) with the Simple Adjusted Operating Margin highlighted temporal trends and underscored their independence, emphasizing the need for nuanced understanding of stochastic factors. The absence of a discernible pattern in the relationship between emission components further underlined the stochastic nature. Qualitative interviews in Almaty and Astana captured a positive disposition towards carbon dioxide utilization, contingent on it not being the exclusive focus in climate change mitigation. Sub-themes, including effectiveness and alignment with sustainability objectives, added complexity to public attitudes, emphasizing the stochastic nature of perceptions. Survey results on challenges and opportunities exposed the stochastic nature of community sentiments. While respondents expressed strong agreement on challenges, including a lack of funding, there was a notable lack of optimism about associated opportunities. The contrast between perceived difficulty and belief in technological advancements introduced a stochastic element, highlighting uncertainty in the success of initiatives. The survey on community engagement for reducing grid emission factors revealed a strong consensus on the importance of participation, but a mixed response on confidence in community collaboration indicated uncertainty. This, coupled with acknowledgment of the importance of public awareness, underscored the stochastic nature of community-driven initiatives. The study emphasized the need for nuanced, adaptive strategies for addressing carbon-related challenges in Kazakhstan. The findings offered valuable insights for policymakers, emphasizing context-specific, data-driven strategies that recognized the deterministic and stochastic aspects of the carbon landscape.

