

Introduction
Over the past century, greenhouse gas emissions have led to a nearly 1°C increase in average surface temperatures, causing irreversible impacts on both humanity and ecosystems. To address the increasingly severe climate and environmental issues, many countries, including China, have formed a consensus to achieve carbon neutrality at specific time points. The scale and impact of international carbon neutrality efforts are continually expanding. Meanwhile, amidst the deep integration of next-generation information technologies like 5G, big data, and artificial intelligence with the real economy, digital transformation is rapidly advancing globally. As the infrastructure that powers information systems, computational infrastructure (CI) has become an indispensable component of economic and social development. While supporting technological advancements and productivity improvements, it also has implications for the energy system and the ecological environment [1]. In fact, the digital industry itself is a highly energy-consuming and carbon-intensive sector. Joppa and Herweijer calculated that greenhouse gas emissions from digital technologies increased from 2.5% in 2013 to 4% in 2020 [2]. Jones predicts that by 2030, the ICT industry will account for 8–21% of the world’s electricity demand [3]. In 2022, the International Energy Agency’s report “Data Centers and Data Transmission Networks” reveal that although greenhouse gas emissions from data centers and transmission networks accounted for only about 1% of energy-related greenhouse gas emissions, given the growing energy demand, governments and industries need to make efforts in energy efficiency, research and development, and decarbonizing power supply [4].
Similar to other emerging technologies, there is no unanimous consensus in academia regarding the impact of digital technology on the environment. Optimists view it as a solution to environmental sustainability issues [5–8]. Through process automation, digitization reduces the input of materials and energy per unit of output [6–9]. The diffusion of digital technology accelerates industrial upgrading and economic transformation, facilitating the transition of manufacturing to services and promoting low-carbon economic development [5, 6, 9]. From an energy perspective, digitization can lower operational costs and enhance energy efficiency across various sectors by optimizing supply systems and improving demand management [1, 8, 9]. Furthermore, the digital economy can advance green technologies, reduce the costs of renewable energy usage, and thereby expand its application [5, 6, 8]. However, despite these advantages, digitization is also considered a potential threat to sustainability. Critics argue that the large-scale production and construction of digital devices make digital technology a significant consumer of materials [10, 11]. Moreover, the digital industry is highly energy-intensive, especially in terms of electricity demand. If the energy structure in a region remains reliant on fossil fuels, digital infrastructure may further exacerbate pollutant emissions [9, 12, 13]. Given the ongoing debate in academia about the environmental impact of digital infrastructure and the increasing energy demands of the digital industry, it is crucial to provide more empirical evidence to clarify the potential environmental impacts of digital transformation, especially in sectors with high energy consumption.
Since the National Development and Reform Commission classified data centers and intelligent computing centers as computational infrastructure, various regions in China have successively launched new types of digital infrastructure construction. At the same time, the rapid development of data centers has brought about energy consumption issues. According to data calculated by the Open Data Center Committee (ODCC), in 2020, China’s data center energy consumption totaled 939 billion kWh, with carbon emissions of 64.64 million tons. It is projected that by 2030, data center energy consumption will reach 3,800 billion kWh; if there is limited improvement in the energy structure, the total carbon emissions will exceed 200 million tons [14]. Therefore, enhancing the carbon efficiency of data centers is of significant importance for reducing energy consumption in the electricity industry and achieving “dual carbon” goals (carbon neutrality and carbon peaking). In 2021, the Ministry of Industry and Information Technology issued the Three-Year Action Plan for the Development of New Data Centers (2021–2023), which states that data centers should meet the requirements for being green and low carbon. Thus, in this context, this study focuses on two national-level CI – the National Supercomputing Centers (NSCs) and the National Big Data Centers (NBDCs) – examining their impact on the environment, specifically whether they will increase CO2 emissions.
When it comes to assessing the environmental effects of digitization, existing research often approaches the subject from economic [5, 6], financial [15], trade [16], and innovation [11]. Some studies focus on specific digital technologies such as the internet [17] or big data [18]. In the context of this study, the most relevant literature pertains to the assessment of environmental effects related to digital infrastructure. Some research constructs digital infrastructure indices using various indicators [19], while another category treats place-based policies as quasi-natural experiments to examine the environmental impacts of initiatives like “National Smart City” [9] and “Broadband China” [7]. In comparison with existing literature, this study’s main contributions lie in: (1) Examining the environmental impact of digital infrastructure from the perspective of computing power. It provides evidence of differentiation in the carbon emissions impact between NSCs and NBDCs. (2) Answering the existing debate on the environmental effects of digitization. Based on a summary of relevant pathways, this study reveals the carbon increment effects of CI and clarifies the dominant influencing mechanisms. (3) In terms of methodology, the multiple synthetic control estimation proposed by Quistorff and Galiani [20] is employed. This approach not only mitigates the subjectivity in selecting control groups inherent in difference-in-differences estimation, but also overcomes the limitations of the traditional synthetic control method, which can only assess individual entities.
Theoretical Framework
The Environmental Kuznets Curve Theory and Its Key Mechanisms
Since the 1970s, discussions regarding the relationship between economic growth and the environment have proliferated. The Club of Rome, in The Limits to Growth, pointed out that economic growth would eventually be constrained by natural resources, implying that a conscious effort to slow down development would be necessary. In the 1990s, with the emergence of the Environmental Kuznets Curve (EKC) hypothesis, the possibility of development coexisting with environmental improvements was proposed. EKC reveals an inverted U-shaped relationship between economic growth and environmental quality, which suggests that in the initial stages of development, economic growth could be detrimental to the environment. However, as per capita income exceeds a certain threshold, further development becomes conducive to sustainability. Grossman and Krueger summarized three main pathways through which economic growth affects environmental quality: scale effects, composition effects, and technological effects [21]. Brock and Taylor also presented similar ideas [22]. Specifically, the entire process can be understood as follows: at a certain technological level, initial development requires increased resource inputs for production, which leads to higher emissions of pollutants and a decline in environmental quality (scale effect). As economic development progresses, a shift in the industrial structure towards cleaner economic activities may occur, mitigating the negative environmental impacts of growth (composition effect). Simultaneously, as regions transition towards knowledge-based economies, increased investments in research and development (R&D) drive technological advancements. This improves resource efficiency and fosters the development of green technologies, known as the technological effect.
Understanding the driving factors behind carbon emissions is of significant importance for clarifying emission reduction strategies. The classification of the above three major effects has been widely used in the assessment of carbon emissions across various socioeconomic activities due to its explainability, including studies on the relationship between digital technology and the environment. In the research by Haldar and Sethi, their hypothesis of an EKC relationship between ICT and CO2 is based on an analysis of scale effects and technological effects [23]. Although ICT increases energy demand by improving production efficiency and stimulating economic growth, it also reduces the use of energy in traditional sectors. Wang et al. find that a 1% increase in the digital economy index led to a 0.886% reduction in CO2 emissions. This reduction is attributed to the expansion of the scale in the tertiary sector, the decline in coal consumption share (composition effect), and the advancement of green technology innovation (technological effect) [5]. Research by Shi Daqian indicates that the smart city pilot reduced urban pollutant emissions by decreasing the share of the secondary industry (composition effect) and enhancing patent innovation levels (technological effect) [24]. Based on this well-established theoretical framework, this study analyzes the impact of CI on carbon emissions from the perspectives of scale effect, composition effect, and technological effect.
Research Hypotheses
Scale Effect – Increased Energy Demand
The scale effect can be understood as the impact of increasing production scale on the environment without changing the technology and economic structure. Existing research mainly uses indicators directly related to economic development, such as per capita GDP [21] and urbanization [25], to measure the scale effect. In the context of this article, we primarily focus on the potential impact of constructing and operating CI on energy input. This can be attributed to two types of impacts and one goal:
Direct Impact: From a technological perspective, to ensure the timely and effective supply of services such as data processing, storage, and transmission, the hardware equipment within data centers needs to run continuously. Moreover, software applications also consume a significant amount of computing resources to support their operation. Deep learning models, for example, use GPUs to increase computational speed, which consumes a considerable amount of electricity. Additionally, the high-power operation of equipment generates a significant amount of heat. Cooling devices are typically used to maintain the appropriate temperature, and the operation of these cooling devices also requires energy support.
Indirect Impact (Environmental rebound effect): Digital technologies not only depend on energy and materials themselves, but may also further increase energy demand by improving energy efficiency. Although the digital economy has significant emission reduction potential [5, 6], it may also promote the rise in energy demand by reducing energy prices, thus creating a rebound effect and increasing greenhouse gas emissions [9, 26]. The CI shortens the R&D cycle and enhances knowledge production efficiency. The increase in energy demand for sectors including science, industry, etc., driven by high-performance computing, improved data service quality, and falling prices, may further increase energy consumption.
Based on the above analysis, it is reasonable to propose the following hypotheses:
H1: Computing infrastructure has a positive impact on CO2 emissions, attributable to its amplification of energy consumption (scale effect).
Technological Effect – Advancement in Green Innovation
The technological effect originally referred to the increase in R&D expenditure as regions transitioned towards knowledge-based economies, thereby propelling technological progress, which, in turn, contributed to mitigating the adverse environmental impacts associated with development. Technology innovation has been recognized as a pivotal solution for addressing environmental concerns and achieving sustainable development [11, 27]. Meanwhile, the construction of CI offers diverse avenues for fostering technological advancement, particularly in green technology.
On one hand, this is manifested in the increasing demand for green technology. With the continuous expansion of supercomputer centers and data centers, a growing amount of data is being collected, stored, and processed. Meeting the processing and computational demands of data necessitates the ongoing development of more efficient and energy-saving technologies and algorithms [28]. For the NSCs in Jinan, a so-called “energy pool” has been devised, encompassing a variety of clean and renewable energy sources, including solar power, air, geothermal energy, and natural gas. The purpose of this initiative is to enhance the efficiency of the system’s thermal management, ultimately contributing to the reduction of carbon emissions, aligning with the “dual carbon” goals.
Furthermore, on the other hand, this is reflected in the provision of technical support. At the governance level, the NBDCs can harness big data technologies to gather and analyze environmental information. The data can subsequently be utilized to implement intelligent control via machine learning algorithms, thus optimizing the operation and management of energy systems. From the microeconomic level, CI has the potential to engage in collaborative research efforts with other organizations, focusing on innovative projects in areas like smart cities and low-carbon initiatives.
Existing literature indicates that investments in technology innovation, particularly the augmentation of green and environmentally friendly patented technologies, can effectively reduce regional CO2 emissions [5, 7, 11]. CI, encompassing areas such as energy-efficient building design, operational management, and energy efficiency enhancement, is well-positioned to elevate its level of eco-efficiency. This covers aspects like the supply of new energy resources and optimization of cooling and heating systems. Moreover, CI plays a vital role in promoting green technology. This not only contributes to alleviating the negative environmental impacts associated with supercomputing centers, but also opens avenues for regional dissemination, consequently enhancing the strength of technological effects. In light of the aforementioned discussion, we posit the following hypothesis:
H2: Computing infrastructure can contribute to regional carbon reduction processes by catalyzing green innovations (technological effect).
Composition Effect: Upgrading Industrial Structure
The composition effect refers to the structural changes in economic sectors, leading to alterations in the impact of economic growth on the environment. If the share of low-pollution economic activities increases, this change helps harmonize the relationship between development and environmental. CI may also act on the environment by altering economic structure. Firstly, CI can facilitate the aggregation of knowledge elements. As one of the fundamental infrastructures of modern information technology, CI is characterized by high knowledge and technology intensity. Its construction and operation require a substantial number of professional technical talents and related support services, which can bring new driving forces for innovation to the region, promoting the upgrading of the industrial structure. Take Tianjin, for example. Under the influence of the NSC, Tianhe Science and Technology Park and the Industrial Big Data Application Innovation Center have been successively established with the aim of building an integrated industrial innovation system that combines production, education, research, and application. This fosters local talent development and international cooperation, establishing an information technology entrepreneurship base and an emerging industry cluster.
Secondly, when the concentration of digital innovation reaches a certain level, it will further accelerate the regional digitization of industries. The efficient, clean, low-cost, and replicable nature of data overcomes the deficiencies of traditional production factors, effectively addressing issues such as diminishing returns in the industrial economy [29]. By stimulating the development of data services, software, and other third industries, digital industrialization becomes a new driving force leading to the upgrading of the industrial structure [30].
Finally, the CI could drive the spread of knowledge, technology, and experience in related fields. The spillover effect encourages traditional enterprises to introduce intelligent production equipment, accelerate innovative production modes, and ultimately achieve a green transformation. If this trend reaches a certain scale, it will further promote the transformation of the industrial structure from high-pollution, high-emission industries to low-energy consumption and low-pollution green and clean industries.
In Jinan, the city’s industrial structure was primarily based on manufacturing in its early stages. Since receiving approval for the construction of the NSC in 2011, the share of high-tech industry output in the total output value of Jinan’s industrial scale has increased from 39.6% in 2012 to 54.7% in 2021. Thus, through the formation of digital industrialization resulting from innovation aggregation and industry digitalization due to knowledge spillover, the construction of CI may promote the upgrading of the industrial structure, reduce the share of development’s negative impact on the environment, and increase the proportion of the clean economy.
Based on the above analysis, we propose the following hypothesis:
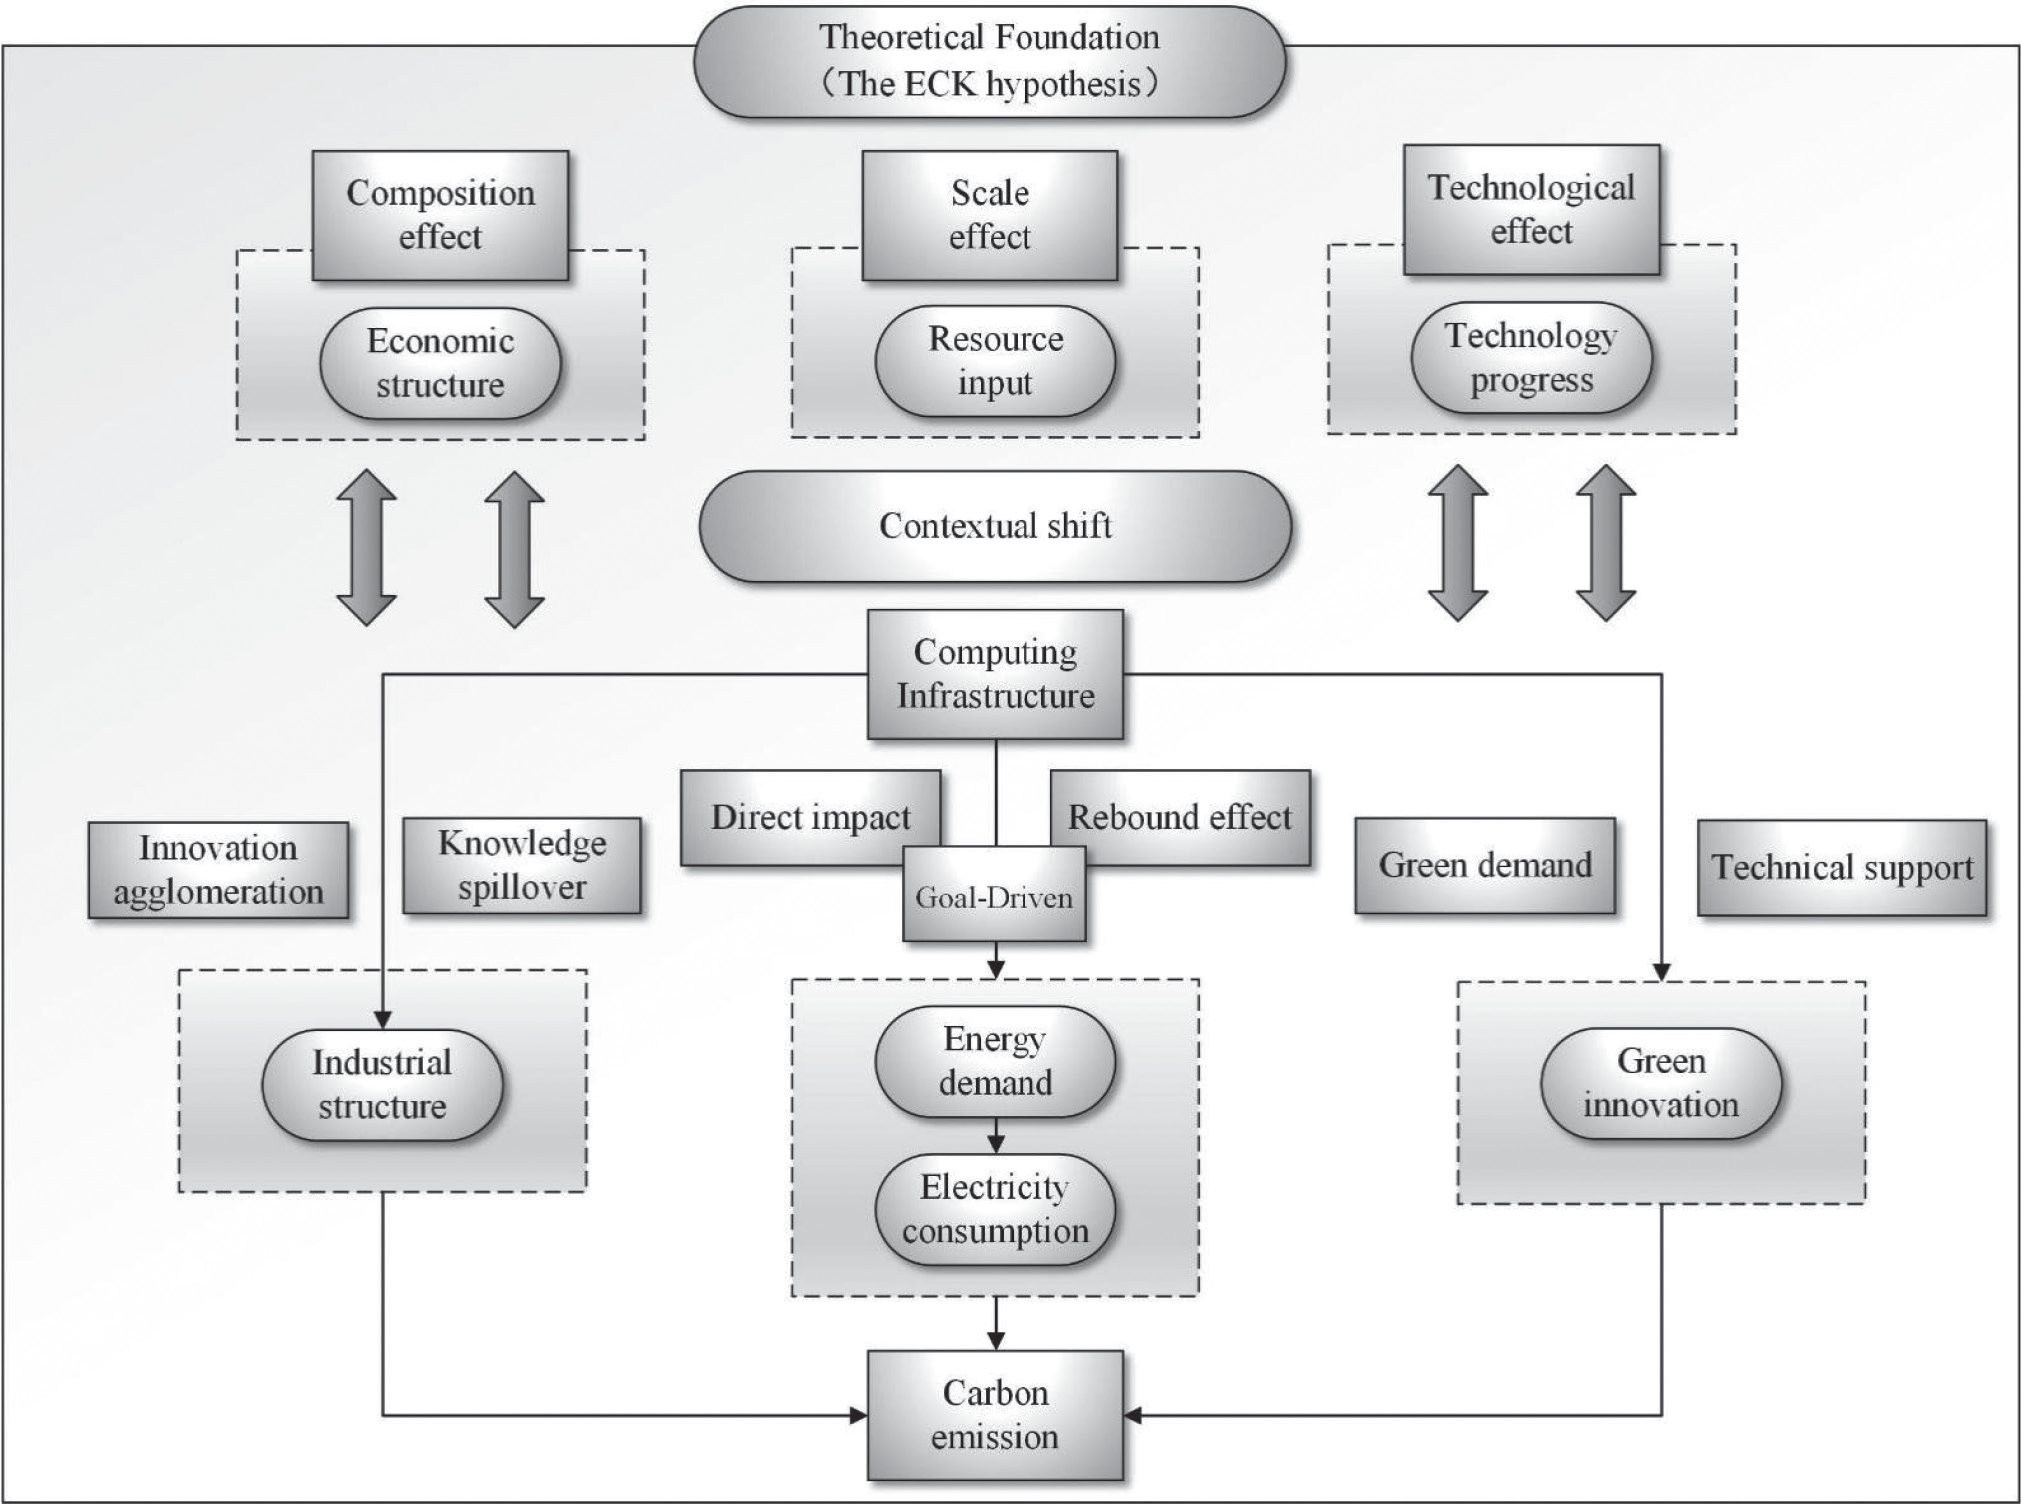
H3: Computing infrastructure can mitigate CO2 emissions by improving urban industrial structures (Composition effect). Based on the above, a framework is constructed as shown in Fig.1.
Institutional Background
From the Twelfth Five-Year Plan for the Development of the Communications Industry, which emphasized accelerating the development of national information infrastructure, to the Fourteenth Five-Year Plan, which emphasized the construction of an integrated big data center system and building a multi-level CI system. Under the backdrop of policy support, the scale and quantity of CI and data centers have significantly increased over the past decade. In 2023, the Overall Layout Plan for Building Digital China further emphasizes optimizing the layout of CI, encouraging regions to develop general data centers and supercomputing centers. From a perspective of necessity, both technological development and societal production require the support of new digital technologies (large scientific facilities) represented by supercomputers. Under the guidance of policy objectives, the development trend of CI sets the tone for the increase in energy demand across the digital industry. Based on this premise, in the following sections, we will introduce two types of computational infrastructure.
“South Gui, North Wu” National Big Data Bases
Since 2013, the three major telecom operators in China - China Telecom, China Mobile, and China Unicom - have established data centers in the “Guian New Area”, which has significantly contributed to the development of the big data industry in Guizhou. In February 2015, the “Guian Big Data Industry Development Agglomeration Area” became the first national-level pilot demonstration zone for big data in China. In September of the same year, the State Council issued the “Action Plan for Promoting Big Data Development”, which clearly stated that Guizhou should promote the construction of comprehensive pilot zones for big data. The following year, the National Development and Reform Commission approved Guizhou’s proposal to establish a national comprehensive pilot zone for big data (Guizhou), making Guizhou the first national-level comprehensive pilot zone for big data. As of 2022, the digital economy accounts for 44% of the regional GDP in Guiyang. The revenue of the software and information technology service industry has grown by 87.6%.
Due to its abundant resources and favorable climate, the Inner Mongolia Autonomous Region was approved as a comprehensive experimental zone for the coordinated development of national big data infrastructure in 2016. In 2020, the “Inner Mongolia Government Cloud Big Data Disaster Recovery Center” project was put into operation in Ulanqab (Wulanchabu). As of now, more than ten data center projects, including Apple, Huawei, and Alibaba, have been initiated in the region. Ulanqab has gradually become a major hub for the big data industry in northern China. Hence, it shares the moniker of “Southern Gui and Northern Wu” with Guizhou.
National Supercomputing Centers
The NSC is a data computing institution approved by the Ministry of Science and Technology in China. Since 2009, they have been set up in various cities, including Tianjin, Shenzhen, Changsha, etc. While supporting scientific research, these centers also empower local industrial development. The NSCs mainly rely on various supercomputers, including: (1) The “Tianhe” series supercomputers at Tianjin, Guangzhou, and Changsha. The “Tianhe-1” and “Tianhe-2” supercomputers have claimed top positions in the TOP500 from 2010 to 2015.
(2) The “Dawning” series supercomputers at Shenzhen, developed by the Chinese Academy of Sciences. In 2010, “Dawning Nebulae” ranked second in the TOP500, marking the best performance of this series. (3) The “Sunway” series supercomputers developed by the National Research Center of Parallel Computer Engineering & Technology are primarily used in Jinan and Wuxi. In June 2016, the “Sunway Taihu Light” supercomputer topped the TOP500 [https:// www.top500.org].
Research Design
Methodology
While some studies have employed instrumental variable estimation methods to identify the impacts of digital technologies on the environment, the precise and unbiased estimation results require careful selection of instrumental variables. In order to investigate the association between CI and urban carbon emissions, this study utilizes a causal inference theory based on the treatment effect framework, comparing the performance of the intervened subjects before and after the intervention. Studies adhering to this methodology often employ the difference-in-differences (DID) approach to assess the environmental effects of digital infrastructure [7, 9, 24]. However, it is also susceptible to sample self-selection biases and demands strict data structures.
This study employs the synthetic control method proposed by Abadie, which is suitable for evaluating the effects of exogenous shocks in cases with relatively few groups [31, 32]. Through a weighted average of synthetic cities, this method constructs a control group, circumventing issues of “natural assignment” in the DID estimation.
In a more specific context, we assume that the carbon emissions of (N+1) cities within the period t ∈ [1, T] are known. The i-th city commences the construction and operation of a NSC or a NBDCs (treatment group) starting at T0 (1 ≤ T0 ≤ T), while the other N cities have not initiated national-level CI (synthetic group). YitI represents the carbon emissions for city i influenced by the CI at time t, and YKit is the carbon emissions for city i unaffected by it. The treatment effect ait can be expressed as YitI – YKit, where YitI represents the known carbon emissions of the city after the influence of CI. For YNit, Abadie et al.’s factor model [32] can be used to estimate it:
In equation (2), δt represents time-fixed effects, μi denotes unobservable (F×1) dimensional individual fixed effects, Zi represents (R×1) dimensional covariates, θt is an unknown (1×R) dimensional parameter vector, and λt signifies unobservable (1×F) dimensional common factor vector. εit denotes unpredictable short-term shocks with a mean of 0.
As per Abadie et al.’s research, it has been demonstrated that if there is a sufficiently long pre-shock observation period, we can use N+1 ω*tYit as an unbiased estimate for YKit [32]. Here, ω*t represents the weight contribution from N=2 the synthetic control group; k is the individual index for the control group. Consequently, we obtain an estimate for the environmental effect of CI construction, denoted as ait:
Furthermore, to overcome the limitations on the number of treated units imposed by traditional synthetic control methods, this study employs the “synth_runner” program developed by Quistorff and Galiani in Stata. This program allows for the inclusion of multiple treated units affected at different times and directly provides P-values for statistical inference, facilitating the statistical inference of treatment effects through placebo tests [20].
Variable Selection
(1) Dependent variable: This study employs CO2 emissions as the dependent variable, sourced from the China Emission Accounts and Datasets (CEADs). This database encompasses energy inventories, CO2 emission inventories, industrial process carbon emission inventories, emission factors, input-output tables, etc. It provides measurements of carbon emissions across various dimensions, including provinces, cities, and counties in China [33, 34].
(2) Mechanism variables: Based on the analysis in Section Research Hypotheses, we have identified three categories of mechanism variables. Firstly, energy consumption. Given that electricity consumption represents a significant portion of the energy use in data center infrastructure, this study selects urban industrial electricity consumption as a proxy for the energy consumption scale [35]. Secondly, green innovation. City-level green innovation is measured by the granted green patents [5, 7]. Data for this variable is sourced from the Green Patent Research Database within the China Research Data Service Platform (CNRDS). This database classifies patents based on the green patent classification standards published by the World Intellectual Property Organization (WIPO). Thirdly, industrial structure. The study uses the ratio of the third industry to GDP as a proxy for industrial structure [5].
(3) Predictive variables: Based on the primary mechanisms outlined in the EKC theory, the study selects per capita GDP [7, 19, 36], year-end total population [37], and the percentage of the secondary industry in GDP [37] as predictive variables. Per capita GDP and year-end total population represent economic scale, the percentage of the secondary industry represents the industrial sector structure (distinct from mechanism variables), and technological factors are measured by the proportion of city financial S&T expenditures in GDP [7]. Additionally, following Abadie et al. [32], the study includes the values of the dependent variable (CO2 emissions) for specific years before the event as predictive variables. Specifically, for the estimation of NSCs, carbon emission values for the years 2003, 2005, and 2007 are selected. For NBDCs, the years 2003, 2005, 2007, 2009, 2011, and 2013 are considered.
Table 1.
Descriptive statistics of variables.
Variable Processing and Sample
(1) Estimation process: This study assesses the carbon emission effects of both NSCs and NBDCs separately to form a comparison. (2) Selection of treatment group: To ensure the fitting effect before the construction of NSC, this study excludes cities with relatively later construction times. Excluded cities include Wuxi (2016) and Zhengzhou (2019), while cities with more concentrated construction periods, like Tianjin (2009), Shenzhen (2009), Changsha (2010), Guangzhou (2010), and Jinan (2011), are retained. (3) Selection of control group: To enhance comparability between the treatment and control groups, 35 large and medium-sized cities are chosen as the control group [38]. Interference from infrastructure construction in other cities is eliminated (for instance, when evaluating the environmental effects of supercomputing centers, big data center cities are excluded from the synthetic group, and vice versa). Furthermore, samples from Beijing and Chengdu are omitted. The former serves as a NBDC, while the latter received approval for NSC in 2020.
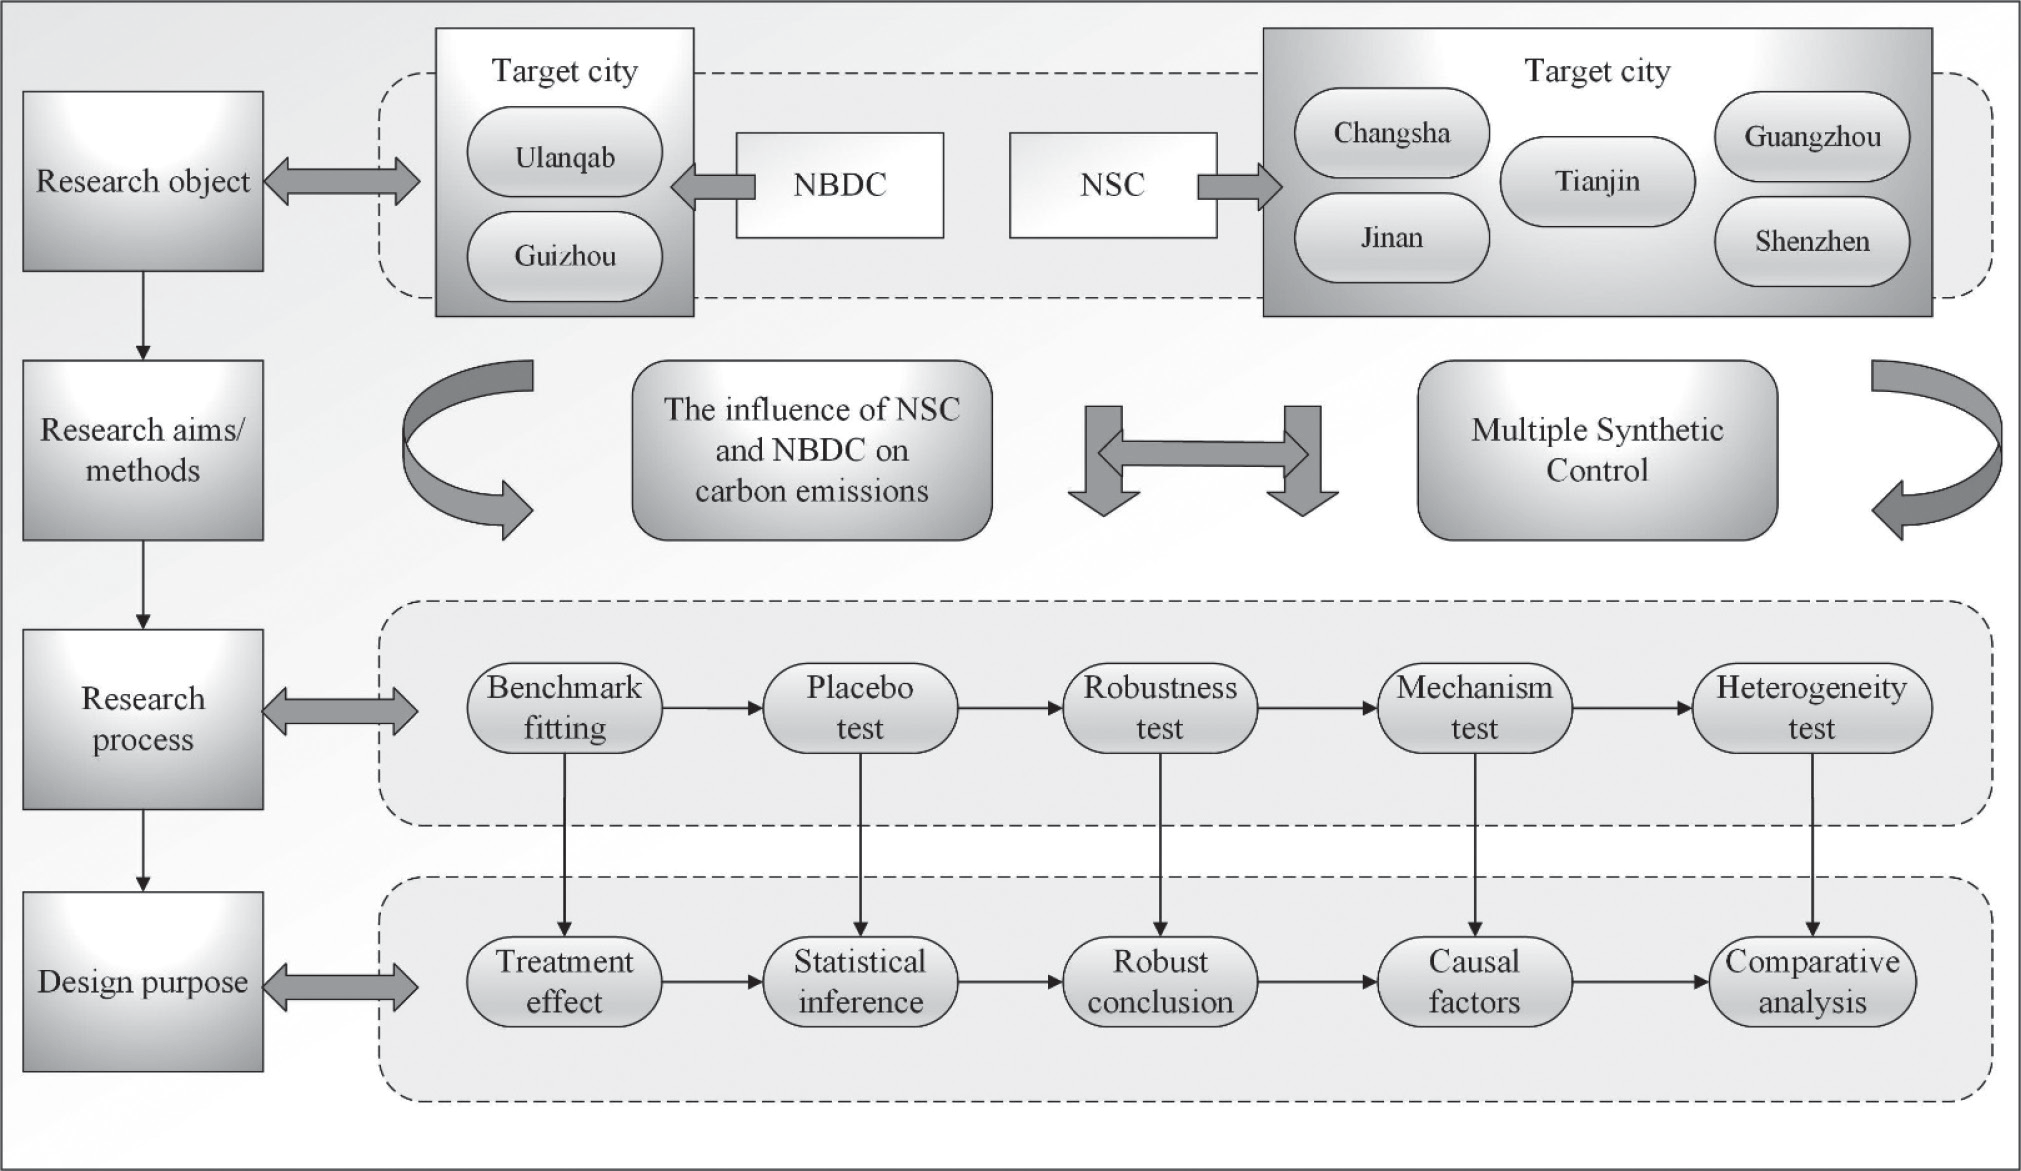
(4) Sample period: Given data availability and to meet the requirements of the synthetic control method for data structure, the research sample includes data from cities in China from 2003 to 2020. (5) Data processing and sources: Per capita GDP and year-end total population are logarithmically transformed. Missing values for some predictive variables are handled using interpolation or replaced with averages. Apart from carbon emissions and green patents, data for other variables are sourced from the China City Statistical Yearbook. Based on the above, the descriptive statistics of the variables are presented in Table 1, and the basic research process is illustrated in Fig. 2.
Research Results
Benchmark Tests
As depicted in Fig. 3, the first column represents the results for NSCs. The solid line indicates the actual carbon emissions for cities with NSCs, while the dashed line represents the control group obtained from a weighted combination of cities in the synthetic group. The vertical dashed line signifies the year when the construction of the NSC commenced, with the carbon emissions trend for supercomputing cities to the left of the dashed line reflecting emissions before the intervention. It’s evident that before the shock, the changes in carbon emissions for the control group closely aligned with those in the actual supercomputing cities. However, from the second year of NSCs construction, the treatment group exhibited significantly higher carbon emissions compared to the control group. In the lower part of this column, the carbon emissions difference between the treatment group and control group is further illustrated, which progressively increases over time and reaches a peak of approximately 15 million tons by the end of the sample period.
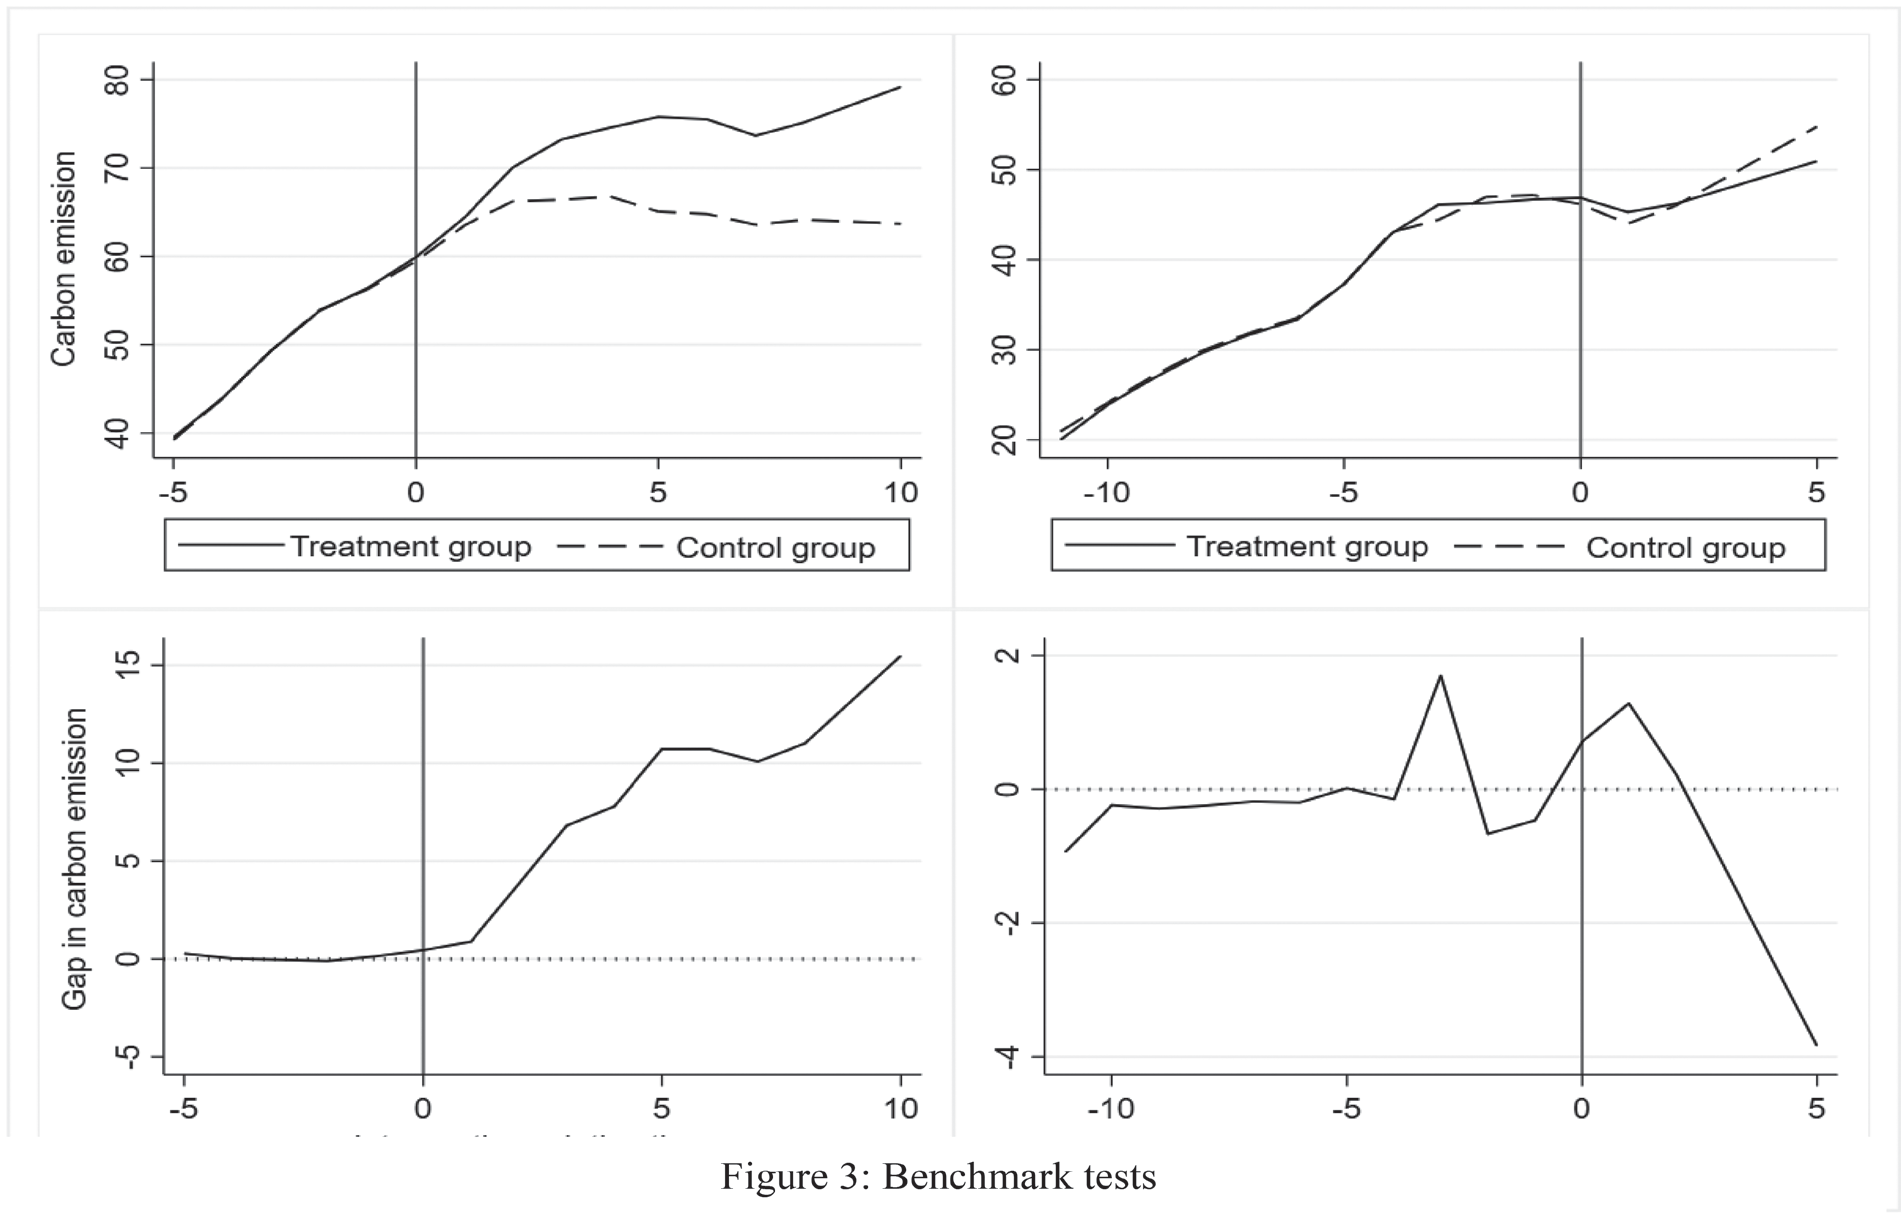
The second column presents the results for the NBDCs. Similarly, the solid line represents the actual carbon emissions for cities with NBDCs, while the dashed line represents the carbon emissions obtained from a weighted combination of cities in the synthetic group. To the left of the vertical dashed line, the trends of the solid and dashed lines mirror each other, which indicates that before the intervention, the synthesized cities provided a good fit for the carbon emissions changes. However, unlike the NSCs, the treatment group does not show higher carbon emissions compared to the control group, even after undergoing the intervention. The lower part of this column illustrates the specific variations in carbon emissions differences between them. It’s observable that, in comparison to before the intervention, the former even exhibits lower carbon emissions than the latter.
The foregoing findings elucidate that, in comparison to NBDCs, NSCs exhibit a more pronounced carbon emission effect. The latent underpinnings of this discrepancy can be attributed to two facets:
(1) NSCs are more energy-intensive than NBDCs. Supercomputing centers are primarily dedicated to high-performance computation, entailing continuous data transmission and processing, thus necessitating a substantial supply of electricity to maintain their high-speed operation. In contrast, data centers predominantly serve the role of data storage and management, resulting in comparatively diminished electrical consumption. Stevens et al. unearthed that the processing of data by supercomputers is the primary contributor to the carbon footprint of Australian astronomers [13]. Jahnke et al. discerned that within the carbon emissions generated by the power consumption of the Max Planck Institute, supercomputing constitutes 75-90% [39]. In alignment with these findings, Bianchini et al., based on research utilizing European urban data, underscored the augmenting impact of digital technology on carbon emissions, with the influence of computing entities being particularly conspicuous [11].
(2) NBDCs benefit from a more abundant supply of clean energy in their power distribution systems. Compared to cities hosting NSCs, regions like Guiyang and Ulanqab, situated in the central and western areas of China, enjoy an opulent reservoir of renewable energy sources. Guiyang, for instance, draws on hydropower sources, while Ulanqab relies on wind energy. As elucidated by Allen, the environmental costs of supercomputing are significantly contingent upon the provenance of the energy that propels the devices [28]. Taking the Dutch National Supercomputer as well as the Max Planck Institute in Germany as exemplars, these organizations have adroitly harnessed wind and solar energy, thereby achieving a notably diminished carbon footprint in contrast to their fossil fuel-utilizing counterparts [39, 40].
Robustness Test
(1) The placebo test
In this study, we conducted robustness checks following the approach of Abadie et al. to verify the evaluation results [32]. This method assumes that other cities in the synthetic group implemented CI at the same time as the cities in the treatment group. We used the SCM to construct control groups for each city and calculate the differences in carbon emissions. It’s important to note that the placebo test requires a good fit between the synthetic group and its synthetic objects. For this purpose, we establish a threshold by multiplying each type of CI’s root mean square prediction error (RMSPE) values by 10. Cities with RMSPE values exceeding this threshold were excluded, and the remaining areas were used for the ranking test. As shown in Table 2, for cities with NSCs, the treatment effect has been significantly positive since the second year of construction (significantly positive at the 5% level in the 2–6 years). However, for cities with NBDCs, the treatment effects for all periods are not statistically significant. The changes in p-values for the treatment effects of CI are shown in Fig. 4.
Table 2.
Statistical Inference (Placebo Test).
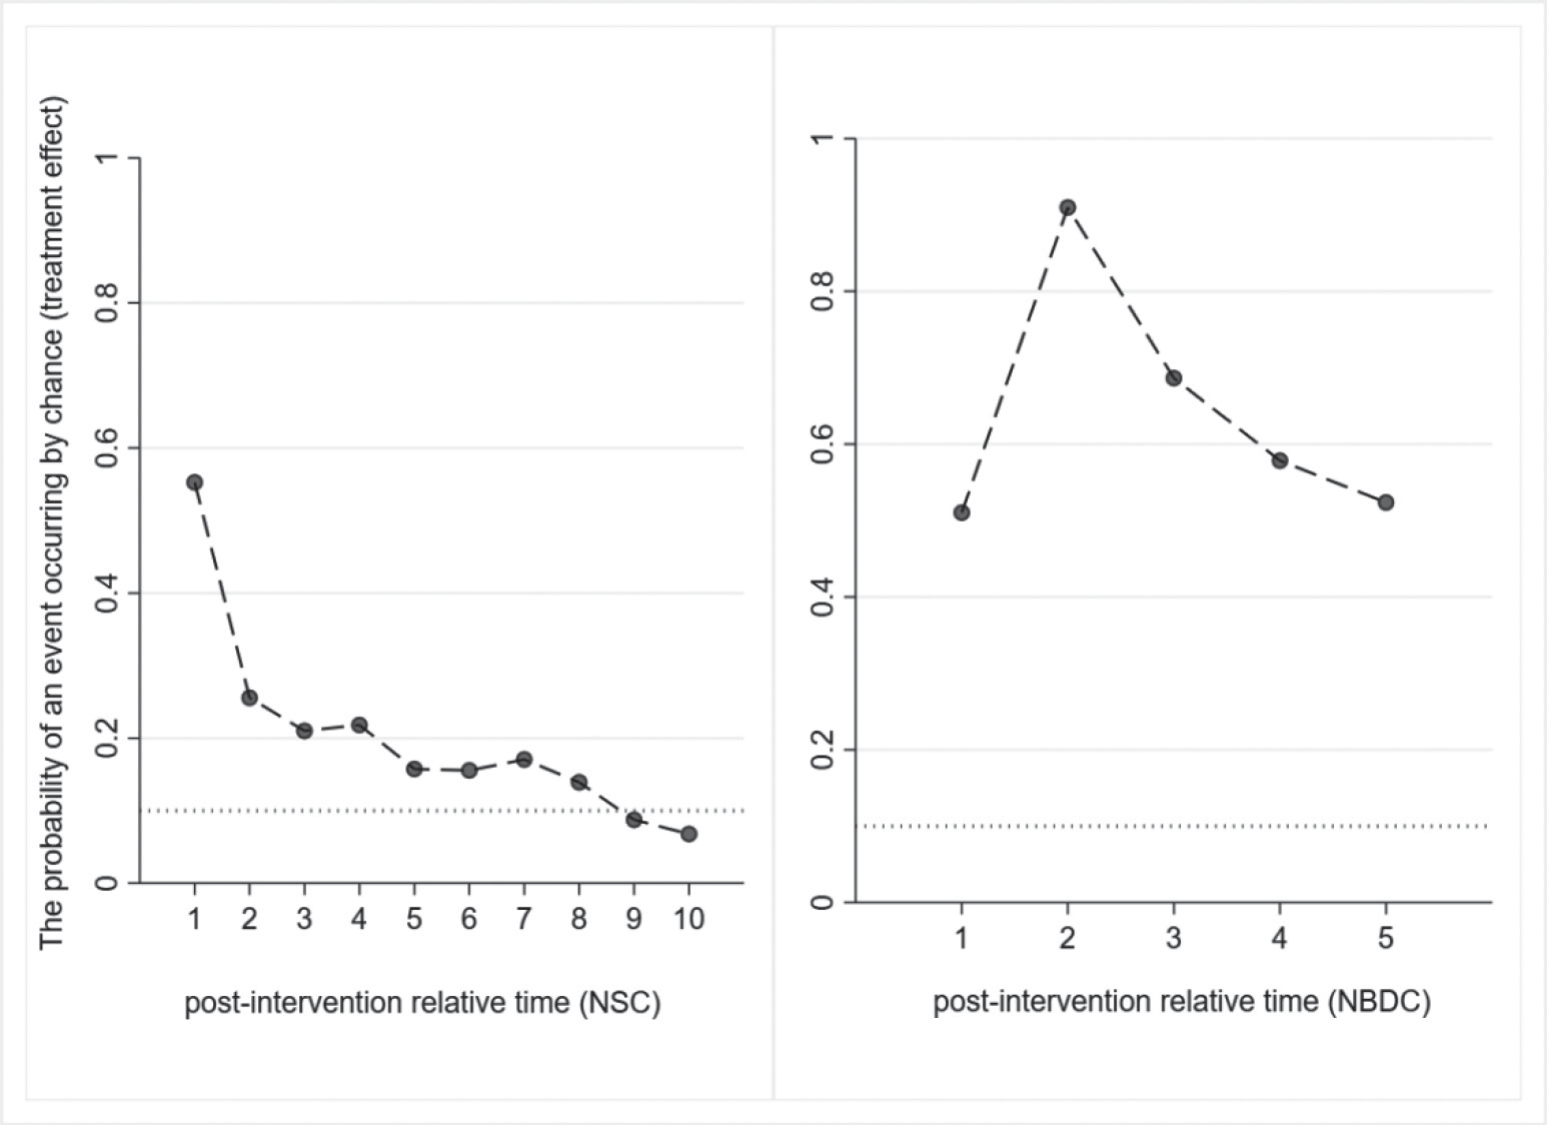
In summary, the results indicate that the increase in carbon emissions in cities with NSCs is not coincidental, while the environmental impact of NBDCs construction is not statistically significant.
(2) Changing the synthetic group
The treatment effect may be significantly influenced by the selection of the synthetic group. To address this, the synthetic group is expanded to 70 major cities. The list of such cities is obtained from the official website of the National Bureau of Statistics of China (http:// www.stats.gov.cn/sj/). Subsequent estimations, as shown in the “Change synthetic group” in Table 3, consistently demonstrate that the treatment effect of the NSCs is statistically significant. The treatment effect of the NBDCs remains statistically non-significant.
(3) Considering other policy interferences
The previous estimations might be influenced by other policies enacted during the same period. Two potential policy interferences are examined: Low-carbon city policy: Since 2010, China has initiated three batches of low-carbon city pilots. After removing all samples from cities participating in low-carbon city pilot programs from the synthetic group, estimations are performed again. The results, as shown in “Consider other policy interference (Low-carbon city policy)” in Table 3, align with the baseline estimation results. Big Data Comprehensive Experimental Zones: Apart from Guizhou and Inner Mongolia, NBDCs also encompass two cross-regional comprehensive experimental zones in the Beijing-Tianjin-Hebei and the Pearl River Delta areas, and four regional demonstration-type comprehensive experimental zones in Shanghai, Henan, Chongqing, and Shenyang. Further estimations are conducted after removing all samples belonging to these cities except for the treatment group. The results, as presented in “Consider other policy interference (Big Data Comprehensive Experimental Zones)” in Table 3, indicate that the treatment effect remains unchanged.
(4) Winsorizing and altering RMSPE threshold
Does the baseline estimation result suffer from the influence of outliers, and does the treatment effect exhibit sensitivity due to varying RMSPE thresholds? To answer these questions, on the one hand, a 1% trimming of the dependent variable is applied, as evidenced by “Winsorizing” in Table 3, where the characteristics remain consistent with the earlier findings. While NBDC is significantly positive at a 5% confidence level, which gradually diminishes thereafter. On the other hand, the RMSPE threshold in the placebo test is extended from 10 times to 20 times, as depicted by “Changing RMSPE Threshold” in Table 3, and the results align with the baseline results.
Table 3.
Robustness tests.
Table 4.
Results of mechanism tests.
Mechanism Tests
In order to delve into the mechanisms by which CI impacts CO2 emissions, this study, grounded in the theoretical analysis outlined in Section 1.2, employs two distinct approaches to scrutinize the mechanisms from the perspectives of scale effect, technological effect, and composition effects.
On the one hand, we treat the mechanism variables as dependent variables and employ the synthetic control method to test the impact of NSC on each mechanism variable. As demonstrated in Table 4, it is evident that, be it the NSC or NBDC, the treatment effects within the scale effect tests are significantly positive at different levels. This affirms that the CI has stimulated the escalation of local industrial electricity consumption. Contemplating the starkly different carbon emission effects of the NSC and NBDC, along with the two potential causes delineated in Section 3.1, we can infer the following results:
(1) The NSC, by augmenting energy consumption, exacerbates carbon emissions. (2) The escalation of energy consumption does not necessarily lead to an increase in carbon emissions (as in the case of the NBDC). This indirectly validates the crucial role of energy structure (abundant renewable energy resources in Guiyang and Ulanqab) in the impact of CI on carbon emissions.
Using the same approach, this study also examines technological effect and composition effect. For the former, it is discernible that in comparison to the NBDC, the technological effects of the NSC are more pronounced. The NSC exhibits a more pronounced carbon emission effect, leading to higher green demand. Furthermore, high-performance computing services can offer direct technical support for green innovation. The examination results for composition effects are presented in the right two columns of Table 4. In contrast to the scale effect and technological effect, CI has not significantly affected the industrial structure, which means its knowledge agglomeration and spillover effects require further enhancement.
On the other hand, we employ the “multi-step method” based on the difference-in-difference model to conduct the mediation effect test [41-43]. The following results are grounded in considerations of individual characteristics that remain constant over time (city fixed effect), time-related features (time fixed effect), and a range of control variables mentioned earlier that could influence carbon emission factors. The data used in this section consists of panel data comprising information from 283 cities in China spanning from 2003 to 2020. Given the regional correlations, adhering to Elhorst’s (2014) selection rules and guided by the premise of the significant Moran Index, we conduct LM tests and Wald tests [44]. The ultimate decision is to adopt the spatial Durbin model as the baseline regression (using the spatial proximity matrix). As shown in Table 5 below. (A1) serves as the baseline test for the DID model, reflecting a positive correlation between NSC construction and urban carbon emissions. In column (A2), it is noteworthy that the estimated coefficient of NSC (treatment effect variable) is significantly positive at the 1% level (64.612), indicating a discernible increase in the regional scale of energy consumption due to the establishment of NSCs. When simultaneously integrating NSC and Energy Consumption into the equation, with Carbon Emissions as the dependent variable, the results in column (A3) reveal a significantly positive estimated coefficient of the mechanism variable at the 1% level (0.030). Additionally, the absolute value of the NSC estimated coefficient experiences a reduction. Meanwhile, it remains significantly positive at the 1% level, which suggests that NSC contributes to an augmented regional carbon emission by amplifying energy consumption. Similar results are observed in the tests for the technological effect in columns (B1) and (B2). The construction of NSC demonstrates its capability to boost green innovation, consequently leading to a reduction in regional carbon emissions. The results in column (C) indicate that NSC does not exert a statistically significant influence on the regional industrial structure. In summary, these findings align with the results obtained from the SCM test in our study.
Table 5.
Mechanism testing based on the DID model.
Heterogeneity Test
The preceding research results indicate that the NSCs have promoted an increase in local CO2 emissions. However, it is pertinent to investigate whether this impact varies among different cities. To answer this question, this study estimates the carbon emission effects of the NSC, respectively. Based on the outcomes, these cities can be classified into two major categories:
(1) Cities with carbon emission effects:
This category includes Tianjin and Changsha, with their corresponding estimations displayed in Table 6. The results demonstrate that from the first year of the construction of the NSCs, the treatment effect becomes evident. Furthermore, in comparison to Changsha, NSC in Tianjin exhibits a higher scale (magnitude) and significance in its treatment effect.
(2) Cities with no significant impact:
The estimations for Guangzhou, Jinan, and Shenzhen indicate that the NSCs in these cities do not significantly increase carbon emissions. Although the differences between real and synthetic cities’ emissions increase to varying degrees after the intervention, the P-values of the treatment effects all exceed 0.05.
Table 6.
The carbon emissions effects of the NSCs in Tianjin and Changsha.
From these results, it becomes evident that the carbon emission effect of the NSCs is primarily driven by the cities of Tianjin and Changsha. Additionally, this study assesses the carbon emission effects of the NBDCs in Guiyang and Ulanqab. The results reveal no statistically significant causal relationship between NBDCs and carbon emissions, further confirming the robustness of the baseline fitting results.
Conclusion and Policy Implications
Discussion and Conclusion
In the digital era, while computing infrastructure accelerates technological advancement and enhances productivity, it may also exert pressure on energy systems and ecological environments. This study employs the synthetic control method to examine the impact of two types of national-level CI in China on urban carbon emissions. Specific research findings include:
(1) The National Supercomputing Center has increased CO2 emissions in urban areas, while the carbon emissions effect in the National Big Data Center is not statistically supported. Existing research has shed light on the positive aspects of digital economics on carbon emissions reduction from various perspectives. Kou and Xu found that the construction of internet infrastructure significantly improves carbon total factor productivity and suppresses the increase in carbon emissions intensity [18]. Wu et al. identified negative effects on carbon emissions from smart city development [9]. Wang found that an increase in the digital index is associated with a reduction in CO2 emissions and a decrease in carbon emissions intensity [5]. Our research findings align with the exacerbation viewpoint, elucidating the detrimental implications of the digitalization process on environmental sustainability [9-11, 35]. Furthermore, from a computational perspective, this study furnishes empirical evidence regarding the carbon emissions attributable to digital infrastructure development. This assertion resonates with the conclusions drawn by Bianchini et al., who, based on European data analysis, determined that digital technologies amplify greenhouse gas emissions, with the influence of CI being particularly pronounced [11].
(2) The significant energy consumption remains a pivotal factor contributing to the carbon intensification of computing infrastructure. However, under favorable conditions, it is feasible to substantially mitigate the adverse environmental repercussions. The results of the scale effect mechanism test in this study reveal that high energy consumption is a significant pathway for carbon emissions increase due to CI. Arshad et al. found that energy consumption is one of the main reasons for the impact of ICT on carbon emissions in Southeast Asian countries [35]. Similar results or statements can also be found in studies by Sadorsky, Van Heddeghem, and Guo et al. [10, 45, 46]. Some literature on large-scale computing infrastructure carbon emissions assessments has also emphasized the impact of supercomputing use on energy systems [28,39,40]. On the other hand, although NBDCs exhibit significant scale effects, they have not manifested a carbon-intensive impact comparable to that of NSCs. This indirectly underscores the crucial role of energy structure. For institutions like the Netherlands National Supercomputer Center and the Max Planck Institute in Germany, their adoption of clean energy sources such as wind and solar power has resulted in lower carbon emissions compared to research organizations in Australia [40, 46]. Through a comparative research approach, the scope of the study subjects related to the CI carbon emissions effects has been expanded [47]. Simultaneously, it also leads us to acknowledge that the escalation in energy consumption is a necessary but not sufficient condition for the increase in carbon emissions.
(3) The inducement effect of CI on green innovation is only manifested in NSCs, and both types of CI have no significant impact on the structural composition of local economic sectors (the proportion of the tertiary industry). In the research context of promoting green development through digitization, technological innovation, and industrial structure are two crucial pathways [5-9, 18, 24]. In contrast to such literature, this study only captures significant technological effects in the assessment of supercomputing centers, while weaker technological and compositional effects also constitute important reasons for the carbon increase (rather than reduction) in CI. Overall, our research reveals the roles played by various mechanisms in the main effects. The results also indicate that it is particularly necessary to conduct environmental impact assessments for different types of digital technologies. General ICT technologies may have crossed the turning point of the Environmental Kuznets Curve [48, 49], while for some large-scale computing infrastructures, their impact on the environment is still in the negative phase. Therefore, it is essential for future assessments to dynamically analyze through different mechanisms. In addition, the results of heterogeneity tests show that the carbon increase effects of Tianjin and Changsha, the two major supercomputing centers, are the most significant. Whether this can be attributed to the common adoption of the “Tianhe” series supercomputers awaits further investigation.
Policy Implications
Firstly, the research findings of this study indicate that the construction of NSCs significantly increases urban carbon emissions. High energy consumption (scale effect) is a crucial factor contributing to the carbon emissions of supercomputing centers. Therefore, in the future, a comprehensive evaluation of indicators related to energy efficiency, power supply and distribution systems, and cooling and heating systems of supercomputing centers is necessary. Inefficient equipment should be updated or replaced. Managing the health of critical equipment and improving data center operation and maintenance efficiency can also help reduce energy consumption and carbon emissions. Moreover, more efficient coding, targeted data storage, and improved energy-to-computer conversion efficiency in supercomputing centers are feasible strategies to reduce energy consumption and carbon emissions.
Secondly, while scale effects (increased energy consumption with scale) play a significant role in the carbon emissions of NSCs, they do not always lead to increased carbon emissions. Given that this research indirectly proves the significant role of energy structure (abundant renewable energy in Guizhou and Ulanqab) in the impact of CI on carbon emissions, optimizing the energy structure further on the supply side is a potential strategy. Increasing the supply of solar and wind energy generation, such as the mixed energy pool at the Jinan supercomputing center, or optimizing the spatial distribution of computing power to channel eastern computing demand to the western regions (East to West Computing Project) could be beneficial. Promoting intensive construction following the principle of efficient construction and encouraging projects in areas rich in wind and solar resources can help minimize environmental impacts.
Finally, as the technological and compositional effects of CI need further enhancement, it is necessary to strengthen the technical support provided by national computing infrastructure for green innovation. Deepening cooperation between supercomputing and data centers and various organizations to promote the development of green innovation and low-carbon projects is essential. Additionally, leveraging national-level CI to enhance regional innovation aggregation is crucial. Based on the local industrial base, a collaborative industrial innovation system that integrates production, learning, and research should be developed around CI to facilitate knowledge spillover and technology diffusion in related fields. This can expand the spillover effect and provide support for industrial structure upgrading and energy structure optimization, ultimately achieving the coordinated development of digitalization and greenization.

