

Introduction
With rapid urbanization and industrialization, soil has become severely polluted with heavy metals such as Cd, Cu, and Pb, primarily due to human activities like mining, heavy metal smelting, pollutant discharge, and the use of pesticides and fertilizers [1, 2]. Soil heavy metal pollution has become a global concern [3-5]. Studies show that in nearly 102 copper mines worldwide, the levels of Cu and Cd in soils have escalated from moderate to severe, especially in countries like Oman, China, Australia, and the United Kingdom [6]. The 2022 National Soil Pollution Survey Bulletin of China reported a decline in the environmental quality of arable land, with pollution levels exceeding the threshold by 19.4%. Cadmium (Cd) accounted for 7% of the total pollution. Cd pollution in soil proves hard to remove through biodegradation, electrokinetic techniques, or cleaning approaches. It further contaminates food via plants, posing a threat to public health [7, 8]. In addition, soil Cd pollution disrupts the microbial community structure and ecological balance of the soil. Fan et al. found that bacterial communities can restore Cd-contaminated soil by regulating enzyme activities [9]. In China, Cd pollution is a prominent threat to soil health and food security. The impact of soil Cd pollution on microbial diversity will be an academic focus of soil environmental governance and the micro-ecological environment in the future.
Scholars have probed into the relations between heavy metals and microbial communities in soil, focusing on methods, effects, and experimental design. In terms of methods, soil heavy metal detection, high-throughput sequencing, and quantitative analysis are mostly used to analyze the relations between heavy metals and microbial community structure [10, 11]. Soil microorganisms can also play a part in transferring heavy metals or helping plants absorb heavy metals to alleviate pollution [12, 13]. Heavy metals also shape the microbial community structure and diversity in soil, eliminating heavy metal-intolerant bacteria [14]. In the meantime, the physiochemical properties of soil, microbial and plant factors, and chemical fertilizers in the soil contribute to the shaping and transformation of heavy metals [15-17]. For instance, with suitable humidity and temperature, manganese-oxidizing bacteria can effectively remove As, Pb, and Cd [18]. Different bacterial species also exhibit varying degrees of adaptability to heavy metals at different pollution levels, making it possible to be screened out [19]. Isolation, screening, and identification of heavy metal-tolerant bacteria in soil can be applied to soil pollution bioremediation, which is a current research hotspot [20].
Globalization and human activities have now made Cd the most concerning toxic heavy metal, greatly threatening the biological communities and human health [21]. Bacteria, as the largest number of microorganisms in soil, play multiple roles in ecosystems, such as the transport of pollution, energy, and nutrients [22]. Soil bacterial communities respond swiftly to environmental changes, as relevant research has confirmed that they are dramatically influenced by heavy metal pollution [23, 24]. Heavy metal pollution alters the composition of bacterial communities; however, some studies indicate that it does not significantly impact overall bacterial diversity [25]. As technologies keep advancing, most scholars turn to high-throughput sequencing, a new method that accurately analyzes microbial community structure and diversity, as it explores how environmental factors influence microbial communities [26]. To be specific, some used it to analyze bacterial communities in various Cd-contaminated environments and found that soil amendments improve the abundance and diversity of soil bacteria and the number of metal-resistant bacteria but also lead to a decline in the number of Proteobacteria, Acidobacteria, and Gemmatimonadetes [27]. In addition, soil Cd pollution also affects bacterial community structure in different rhizospheres. Experiments confirmed that Cd pollution strongly influences enzyme activity in carbon, nitrogen, and phosphorus cycles in soils where Salvia tiliifolia is planted. Surprisingly, bacterial diversity and richness were less affected [28]. With the help of plants, Klebsiella and Enterobacter manifest the most cadmium tolerance, as proved by molecular and biochemical mechanisms [11].
High concentrations of Cd in agricultural soil and irrigation water threaten the ecological environment, food security, and the health of both humans and animals across the globe. Microorganisms, including bacteria, can capture and transform Cd and other compounds. As a result, microbial bioremediation emerges as an efficient strategy to lower the concentration of heavy metals in the natural environment [29, 30]. Certain strains have demonstrated the ability to remediate heavy metal-affected soils [31, 32]. However, a thorough analysis of how Cd pollution and bacterial communities interact in cultivated soils, aimed at identifying the most suitable microbial resources for bioremediation or bacteria-assisted phytoremediation, is yet to be carried out. This study selects the grain-producing areas with severe Cd pollution in China as the study area. By analyzing the interaction between physicochemical properties, heavy metal content, and bacterial communities of cultivated soil, we aim to uncover how Cd pollution affects the soil’s bacterial community and identify Cd-tolerant bacteria. This study hopes to fill the gap in the influence mechanism of soil Cd pollution on bacterial communities in China’s grain-producing areas and offer guidance on improving bioremediation technologies to alleviate heavy metal pollution in cultivated soil.
Materials and Methods
Overview of Study Area and Samples
The study area, J County (120°44′ to 121°01′ E; 30°45′ to 31°02′ N), lies in the Hangjiahu Plain within the Taihu Lake Basin. It is located in the core area of the Yangtze River Delta urban agglomeration; the most important grain-producing area in eastern China. The local water network is complicated and intertwined, with an average river network density of 12.7 kilometers per square kilometer, the highest in China. The surface sediments are mainly fine-grained (fine silt and clay), typical of river and lake sediments. The southern margins, on the other hand, are enriched with tidal flat sediments. The soil is coarse, loose, and fertile, extremely beneficial to agricultural production and the construction of water conservancy facilities. However, in recent years, the problems of soil degradation and heavy metal pollution have become increasingly prominent, seriously restricting the sustainable development of agriculture in J County. Therefore, selecting this county as the research area has a certain representativeness.
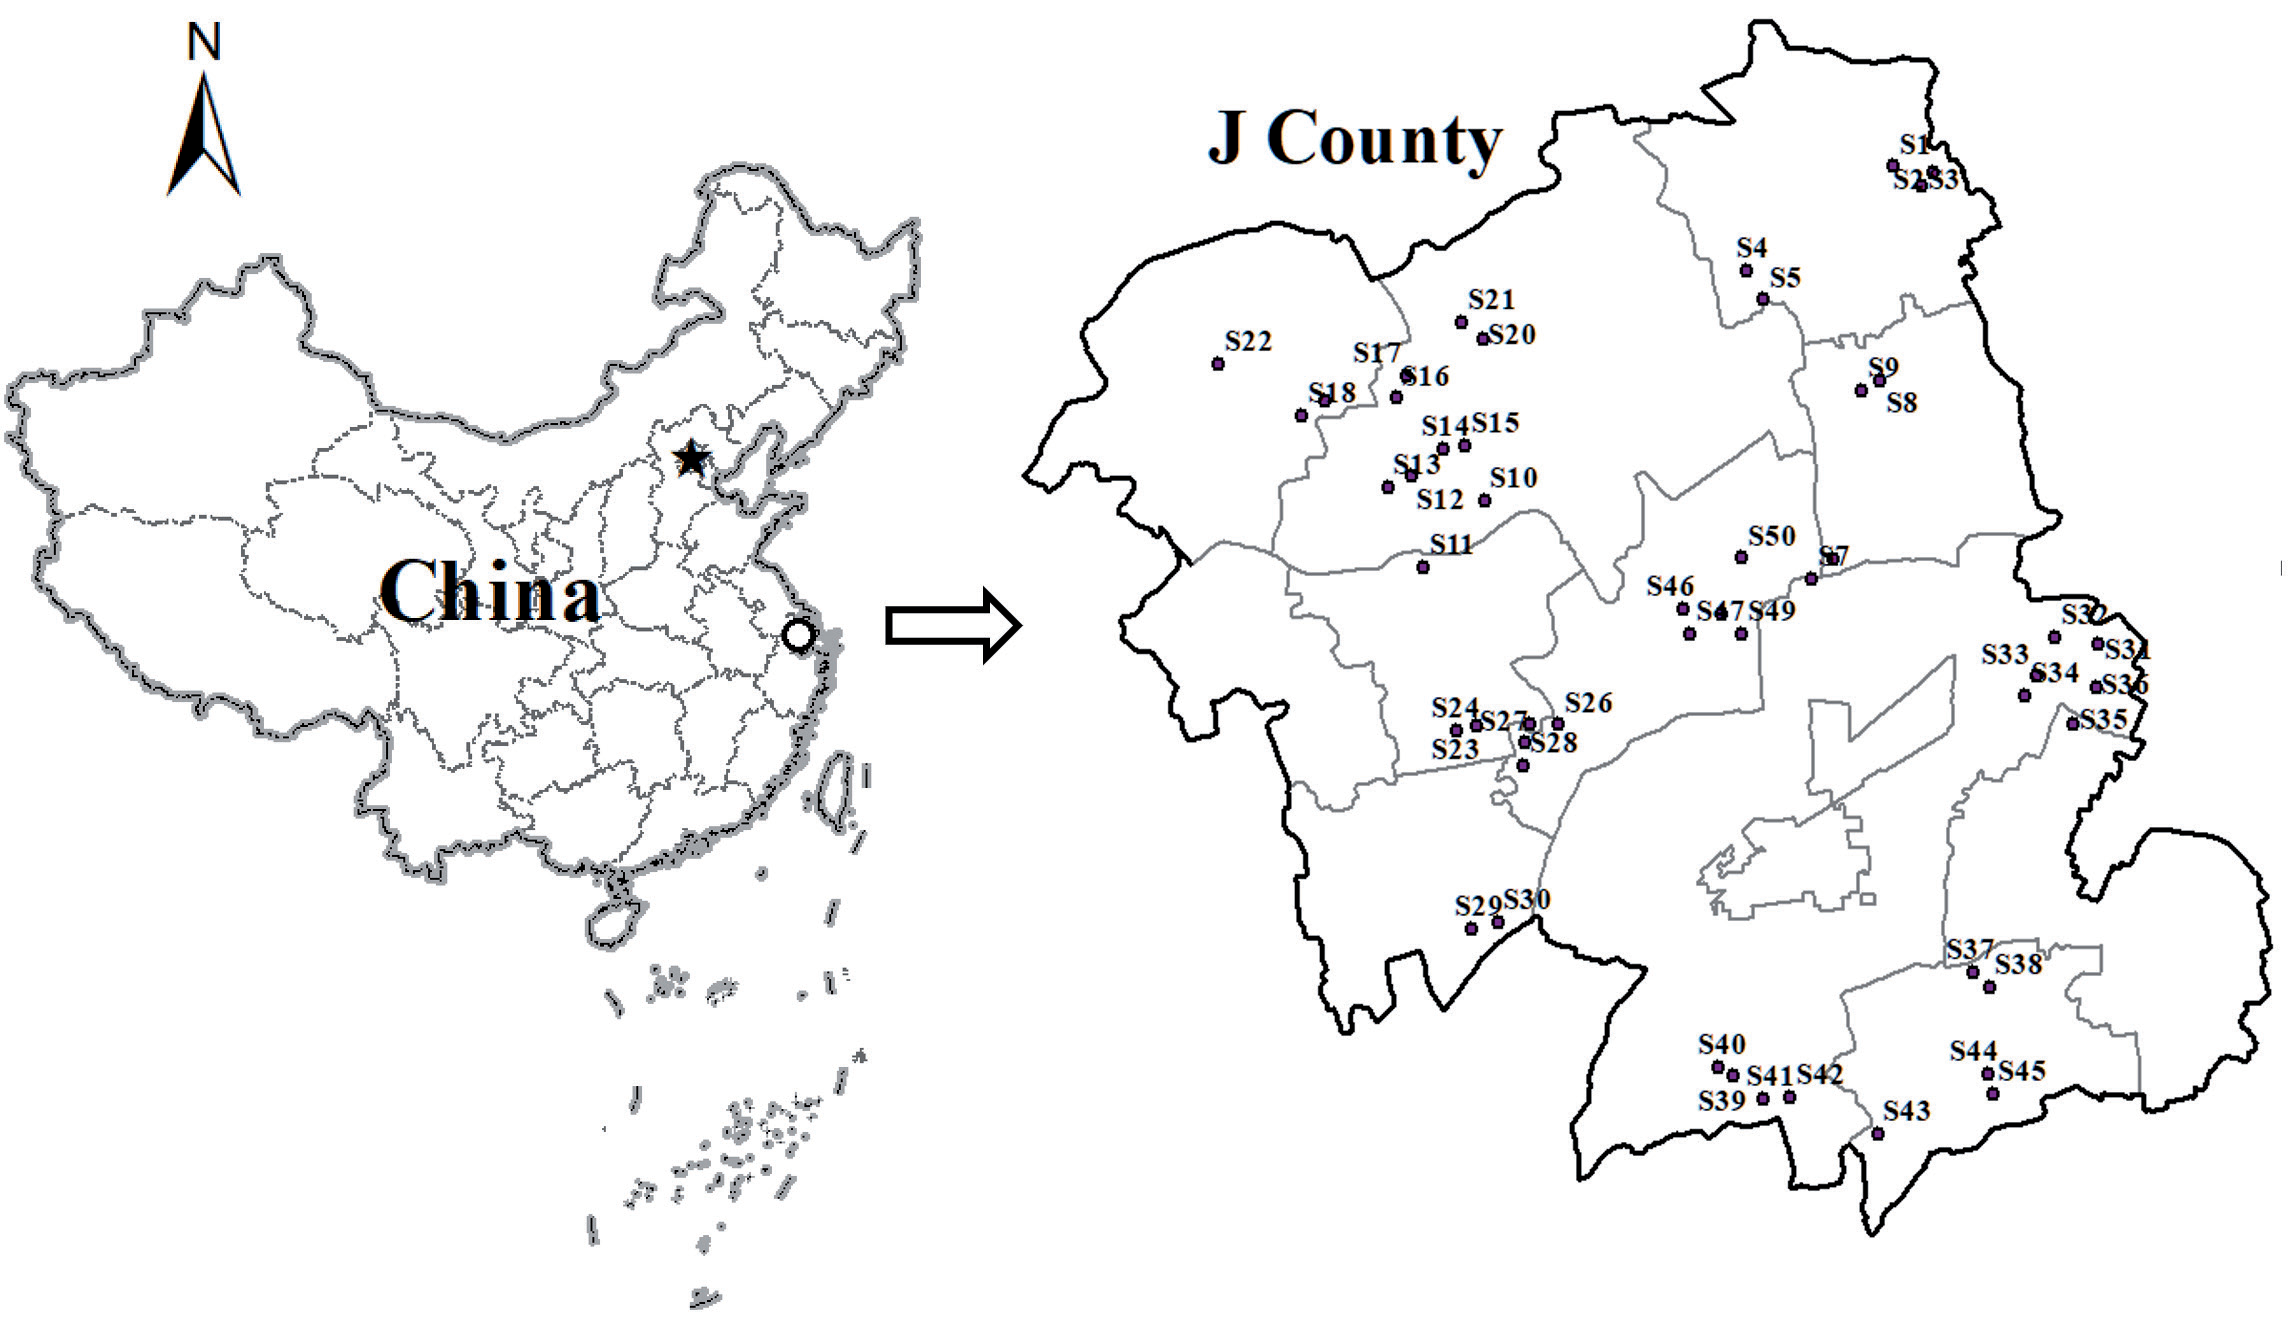
In May 2019, we randomly selected 50 cultivated fields in the study area (Fig. 1), all of which were paddy fields. We collected topsoil (0 - 30 cm) with stainless steel shovels and removed large debris such as stones, plants, and animal residues. Samples were then sealed in plastic bags and placed on dry ice for preservation while being transported to the laboratory. Upon arrival, the samples for DNA assay were stored at -80°C in a refrigerator, while those for assessing physicochemical properties and heavy metals were stored at 4°C [33]. This study used the national standard background values of soil.
Soil Property and Heavy Metal Analysis
The soil pH was measured at a soil-to-water ratio of 1:2.5 with a pH meter, and the soil water content (MC) was measured at 105°C for 6 hours in an electric thermostatic oven. Soil particle size (SPS) is measured using a soil particle size measurement system. Soil organic matter (OM), total nitrogen (TN), available phosphorus (AP), and available potassium (AK) were respectively measured via a total organic carbon analyzer (BOCS301, Shimadzu of Japan), an automatic Kjeldahl analyzer (K9860, Hainan of China), a spectrophotometer, and a flame photometer. Soil catalase (SC), urease (SU), and phosphatase (SP) activities were determined by sodium phenate, sodium phenol-sodium hypochlorite colorimetry, and phenyl disodium phosphate colorimetry. In the study area, we identified 8 major heavy metals (Cd, Cu, Zn, Hg, Cr, Cd, Pb, and Ni) that drastically impact the soil microbial community and endanger the soil ecological environment, plant growth, and food safety. After digesting the heavy metals via a specific solution of HCl-HNO3-HF-HClO4, we employed the Agilent 7900, an inductively coupled plasma mass spectrometer produced in California, USA, to measure the metal concentrations. In light of China’s national standard GB 22105-2008, concentrations of As and Hg were measured via an atomic fluorescence spectrophotometer (AF-630, BFRL, China) pretreated with aqua regia. To guarantee valid and robust results, duplicate samples and blank control materials were employed. The recovery rate of all heavy metals surpassed 90%, which is in line with the reference GBW-07405, proving the validity and precision of the results.
Bacterial Community and Diversity Analysis
DNA Extraction and PCR Amplification
We used the soil DNA kit from Omega Bio Tek Company, California, USA, to extract microbial DNA from soil samples. The final DNA concentration and purity were measured using the NanoDrop 2000 UV Vis spectrophotometer of Thermo Scientific Company, Washington, USA. To check DNA quality, we conducted the 1% agarose gel electrophoresis. Next, with genomic DNA as a template, we amplified the V3-V4 hypervariable region of the bacterial 16S rRNA gene via a thermocycler PCR system (GeneAmp 9700, ABI, USA) with primers 338F (5' – ACTCCTACGGGAGGCAGCAG - 3') and 806R (5' – GGACTACHVGGGTWTCTAAT - 3'). Then we carried out PCR reactions in triplicate in a 20 μL mixture containing 4 μL of 5 × FastPfu Buffer, 2 μL of 2.5 mM dNTPs, 0.8 μL of each primer (5 μM), 0.4 μL of FastPfu Polymerase, and 10 ng of template DNA. The detailed process is: 3 min of denaturation at 95°C, 27 cycles for 30 sec at 95°C, 30 sec of annealing at 55°C, 45 sec of elongation at 72°C, and 10 min of final extension at 72°C. After that, we extracted a PCR product from 2% agarose gel, purified it with the AxyPrep DNA gel extraction kit from the Axygen Biosciences Company in the Union City of California, USA, and last quantified it with QuantiFluor™-ST from the Promega Company, USA.
Illumina MiSeq Sequencing
The purified amplicons were combined with equimolar for paired-end sequencing on the Illumina MiSeq platform of Illuminia Company in San Diego, USA.
Processing of Sequencing Data
The operational taxonomic unit (OTU), which is the basic unit for analyzing microbial communities, was obtained via UPARSE (version 7.1) by clustering based on the similarity cutoff value of 97% and then going through identifying and deleting chimeric sequences via UCHIME. The classification of each 16S rRNA gene sequence was analyzed using the RDP classifier algorithm targeting the Silva (SSU123) 16S rRNA database with a 70% confidence threshold. The functional composition of soil microorganisms was used to predict the function of amplicon sequencing data of bacteria through PICRUSt software (Harvard University, Cambridge, Massachusetts, USA).
Statistical Analysis
The α diversity demonstrates the number, abundance, and evenness of species in an ecosystem. To be specific, community richness is represented by the ACE and Chao indexes, and diversity is represented by the InvSimpson and Shannon indexes [34]. The β-diversity index was calculated through the QIIME platform to explore the structural difference of bacterial communities in different soil samples. Using R language, we ran CCA and Spearman analyses to spot environmental factors affecting bacterial community structure.
Next, we evaluated levels of heavy metal pollution based on the widely used geo-accumulation index (GI) [35]. Combining GI and the Nerome comprehensive index (NI) could deliver more comprehensive evaluation results [36]. The detailed equation is as follows:
Ci stands for the concentration of a single heavy metal in sample i, and Bi is the geochemical background value of a single heavy metal. Drawing from current studies, we denoted a coefficient of 1.5 to manifest how local environment and human factors change heavy metal content [37]. GI<0 means no pollution; 0≤GI<1 means zero to moderate pollution; 1≤GI<2 means moderate pollution; 2≤GI<3 means moderate to severe pollution; 3≤GI<4 means severe pollution; 4≤GI<5 means severe to extremely severe pollution; and GI≥5 means extremely severe pollution.
NI can be calculated from the GI results via the following equation:
GIiave and GIimax represent the mean and maximum values of the 8 heavy metals, respectively. According to NI, the pollution can be divided into four levels – clean (I, NI≤1), mild (II, 1<NI≤2), moderate (III, 2<NI≤3), and severe (IV, NI>3) [38].
Results
Composite Heavy Metal Pollution
Among the 8 heavy metals tested, the average contents of three, including Cd, were higher than the background values (Table 1). Specifically, the average contents of Hg, Cd, As, Pb, Cu, Ni, Zn, and Cr are 0.55, 2.50, 5.29, 41.94, 45.17, 56.77, 123.27, and 223.79 mg/kg, respectively, 1.10, 8.33, 0.21, 0.14, 0.45, 1.14, 0.49, and 0.75 times the national standard, surpassing it by 38%. In other words, heavy metals are concentrated in the farmland soil of the study area.
Table 2.
Physiochemical properties of soil samples.
Table 3.
Activity of three soil enzymes.
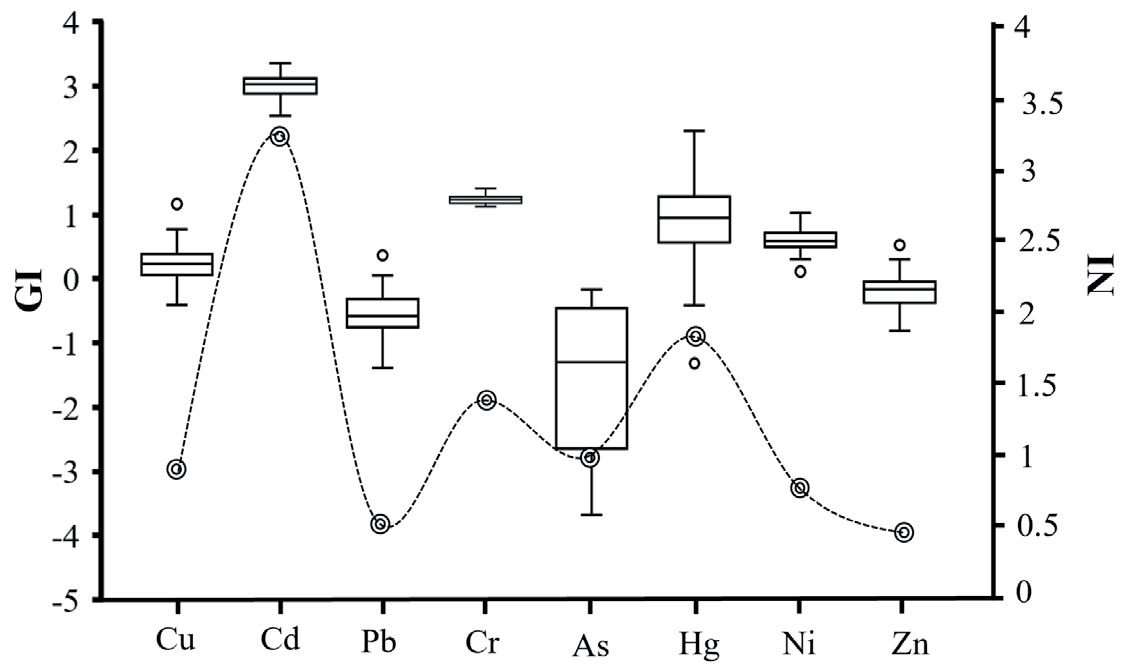
As the GI results suggest (Fig. 2), the pollution levels of heavy metals can be ranked: Cd > Cr > Hg > Ni > Cu > Zn > Pb > As. In particular, Cd has the highest GI and causes the most serious pollution. However, Pb, As, and Zn mostly show negative GI values, meaning that they do not contribute to soil pollution.
The level of composite pollution can be figured out by measuring the NI value. Results showed that the NI values of all soil samples ranged from 0.47 to 3.31. Specifically, the NI values of Cu, Cd, Pb, Cr, As, Hg, Ni, and Zn are 0.95, 3.31, 0.51, 1.45, 0.96, 1.83, 0.78, and 0.47, respectively. If NI < 1, the soil is clean; if 1 < NI < 2, the soil is mildly polluted; if 2 < NI < 3, the soil is moderately polluted and may threaten the growth of plants; if 3 < NI < 4, the soil is severely polluted and may damage the growth of crops. In summary, the analysis above indicates significant Cd pollution accompanied by mild Cr and Hg pollution, as well as slight contamination by other heavy metals (Fig. 2).
Soil Cd Pollution
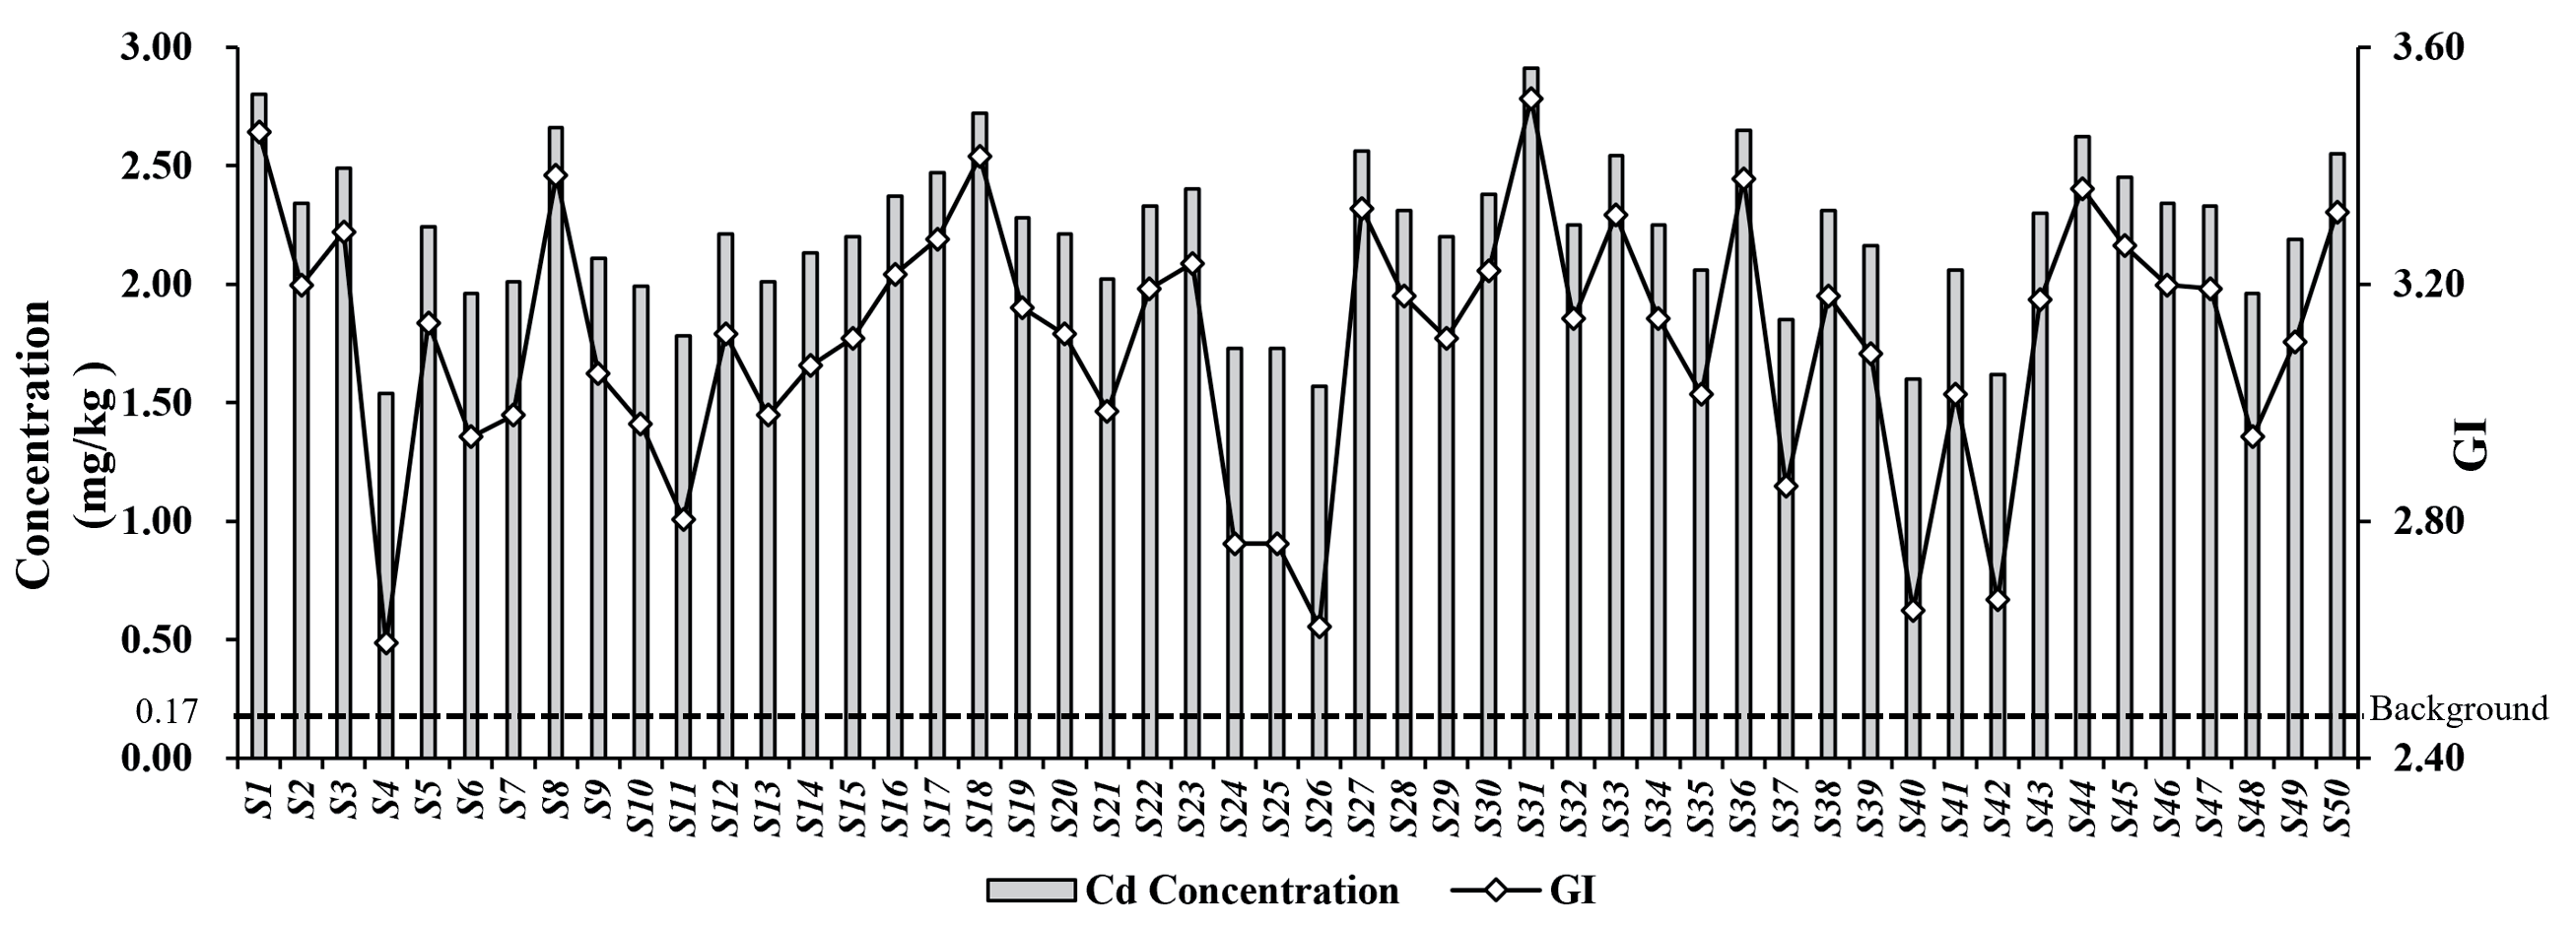
The Cd content and the reference background values of all 50 soil samples are shown in Fig. 3. The average Cd content is 2.215 mg/kg, with a minimum value of 1.54 mg/kg and a maximum of 2.91 mg/kg. The content in all samples is higher than the background value of 0.17 mg/kg. The maximum, minimum, and average values are around 17, 9, and 13 times the background value, respectively. In accordance with the results, the maximum GI value of Cd was 3.51, and the minimum was 2.59. In particular, there are 14 samples (28% of all samples) with pollution levels ranging from moderate to severe (2≤GI<3), and 36 (72%) with severe pollution (3≤GI<4). In a word, the study area suffers from serious Cd pollution.
Soil Physiochemical Properties
Soil particle size (SPS) and soil moisture content (MC), as the focus of current soil physics research, are the main physical property indicators. The SPS of the samples ranges from 10.16 to 30.42 μm. In particular, the average SPS of severely polluted areas is significantly higher than that of moderately polluted ones. MC, on the other hand, ranges from 21% to 54%, with no significant difference between moderately and severely polluted areas.
Soil chemistry is mainly composed of indicators such as total nitrogen (TN), organic matter (OM), available phosphorus (AP), available potassium (AK), and soil pH, key to soil self-purification, productivity, nutrient balance, and carbon emissions. The pH values of all samples ranged from 6.16 to 8.30, with the pH in severely polluted areas slightly higher than that in moderately polluted areas. As for nutrients, the contents of OM, AP, AK, and TN ranged from 16.00 to 70.40 g/ kg, 8.56 to 330.79 mg/kg, 14.45 to 80.25 μg/ml, and 0.93 to 3.75 g/kg, respectively. In particular, the contents of OM and TN in severely polluted areas are higher than those in moderately polluted areas, but AP and AK are quite the opposite (Table 2).
Soil enzymes drive the soil biogeochemical cycles, acting as an indicator of the changes in soil properties. The activity of soil enzymes represents the supply capacity of soil nutrients and serves as a key indicator of soil health and quality. According to the assay results, the activity ranges of soil catalase (SC) and soil phosphatase (SP) are 125.45-276.90 mg/g and 2.80- 45.20 mg/g, respectively. Activities of SC and SP in moderately polluted areas are significantly lower than those in severely polluted areas. Meanwhile, soil urease (SU) activity ranged from 0.01 to 0.98 mg/g, showing no significant difference between moderately and severely polluted areas (Table 3).
Bacterial Community Structure and Diversity
Soil Bacterial Diversity
After PCR amplification and quality control optimization of 16S rDNA, a total of 1,249,000 valid sequences were obtained, and then 11,295 OTUs were gathered via QIIME. Next, once we got the bacterial community α diversity index, we used Spearman correlation to analyze the correlation and significance relationship between the α diversity indexes of different groups (Table 4). Results showed that the bacterial community richness indexes, such as Sobs and Chao, in severely polluted areas were significantly higher than those in moderately polluted areas (p<0.05). Simpsoneven and Shannoneven indexes that reflect the evenness of the bacterial community and distribution revealed no significant difference among the various groups. In other words, the bacterial community is evenly distributed in soils at different Cd pollution levels. In light of Shannon and Invsimpson, bacterial community diversity in moderately polluted areas was significantly lower than in severely polluted ones. Next, in line with Coverage, an index that manifests microbial community coverage as well as the depth and effectiveness of high-throughput sequencing, if the value of Coverage is close to 1, the sequencing depth is able to cover all microbial community species. In this study, the coverage of all samples exceeds 0.95, proving the high reliability and operability of the data.
Grounded in the analysis above, it is evident that severe Cd pollution greatly impacts the diversity of the soil bacterial community, as reflected by indexes of community diversity and richness.
Soil Bacterial Community Structure
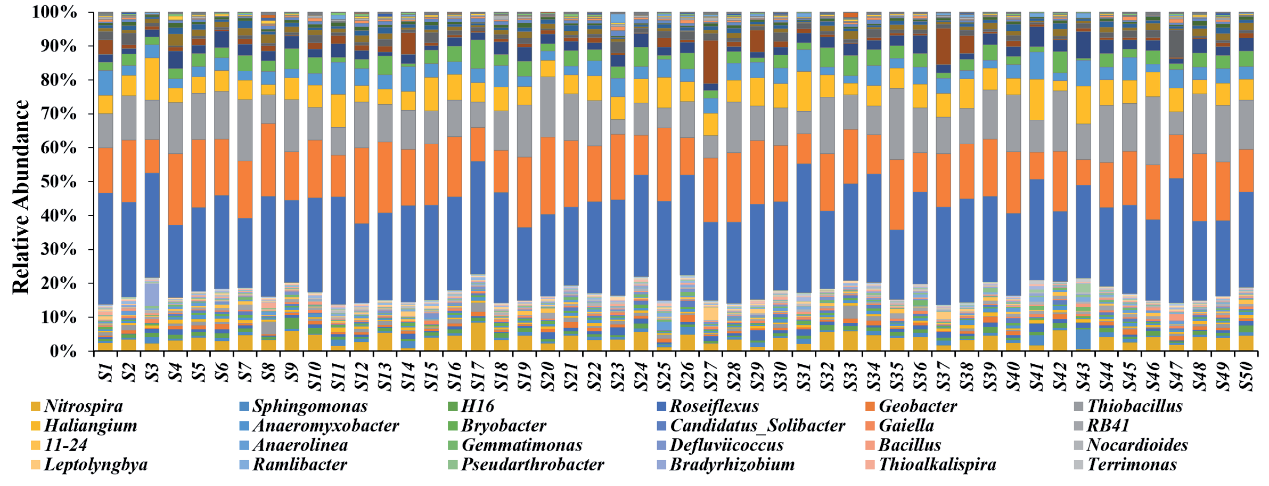
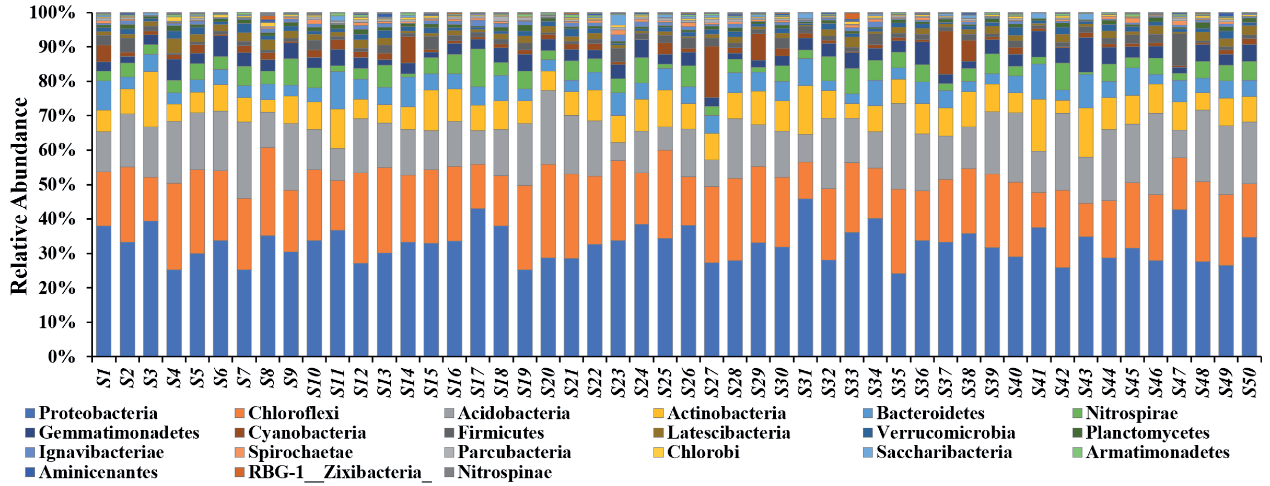
The OTUs of bacteria in all samples were divided into 56 phyla, among which 8 were the dominant ones (relative abundance > 2%): Acidobacteria, Actinobacteria, Bacteroidetes, Chloroflexi, Cyanobacteria, Gemmatimonadetes, Nitrospirae, and Proteobacteria. They have 7,852 OTUs, accounting for around 70% of the total number, aggregated from 1,111,904 effective sequences. Specifically, Proteobacteria, Chloroflexi, and Acidobacteria rank in the top three in terms of relative abundance. In detail, Proteobacteria has 2,823 OTUs (accounting for about 25%), Chloroflex 1,970 (about 17%), and Acidobacteria 973 (about 9%) (Fig. 4).
A total of 90,261 high-quality sequences fell into 593 bacterial genera, with H16, Nitrospira, Roseiflexus, and Spingomonas being the dominant ones (relative abundance > 1%). The average relative abundance of Nitrospira ranks the highest, about 4.37%, way higher than other genera. In addition, the relative abundances of Sphingomonas, H16, and Roseiflexus are 1.23%, 1.23%, and 1.20%, respectively (Fig. 5).
Discussion
Factors Affecting Soil Bacterial Community Structure at Different Cd Pollution Levels
According to CCA analysis, among the 50 samples, Cd (r2=0.25, p=0.043), SPS (r2=0.18, p=0.009), OM (r2=0.22, p=0.003), MC (r2=0.23, p=0.003), pH (r2=0.69, p=0.001), TN (r2=0.26, p=0.002), and SC (r2=0.33, p=0.002) showed significant correlations with bacterial community structure (Table 5). Subsequently, we employed the Wilcoxon rank-sum test to assess the differences in the distribution of two sample groups. The results indicated that soil bacterial genera such as Gaiella, Hyphomicrobium, Candidatus-Nitrotoga, Rhodoplanes, Tumebacillus, Methylomonas, and Methylobacterium in moderately polluted areas differed significantly from those in severely polluted areas, with a 90% confidence interval.
Phylum Level
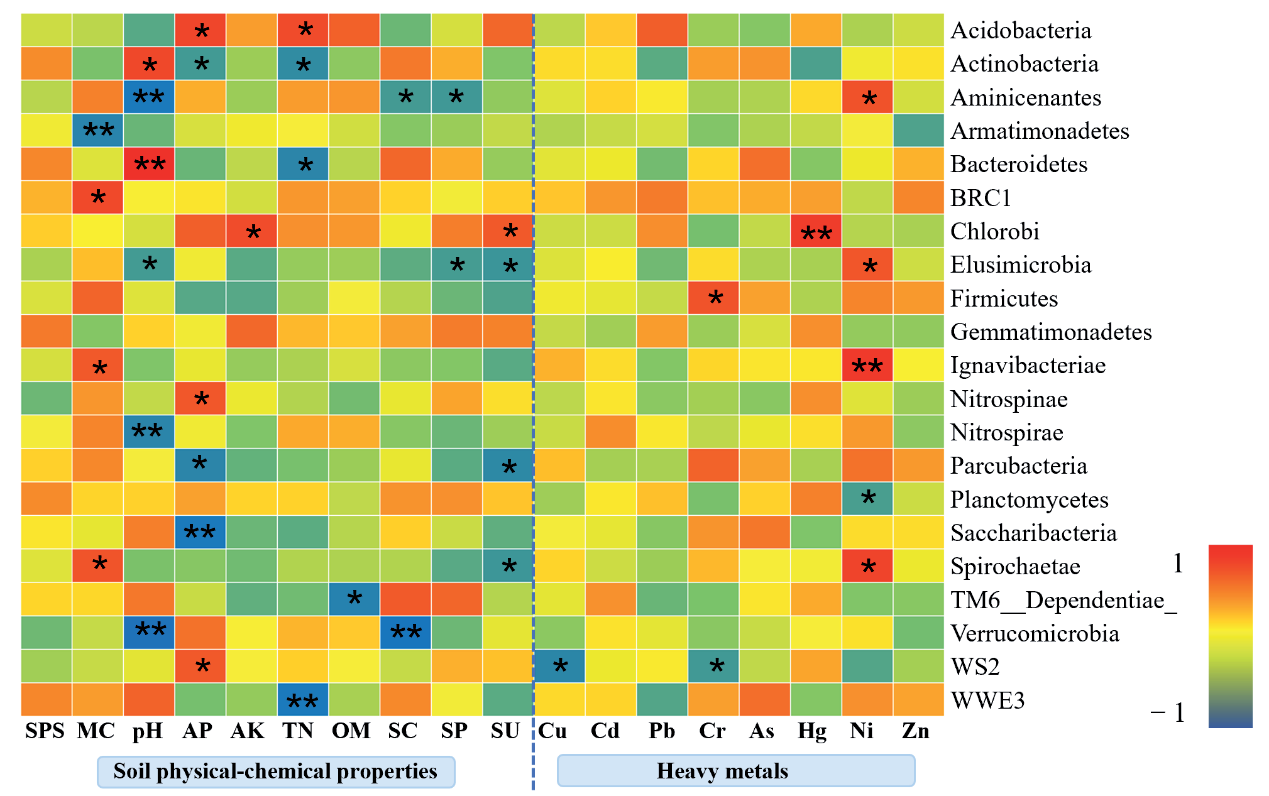
In farmlands with moderate Cd pollution, the relative abundance of soil bacteria showed significant correlations with soil physicochemical properties. Specifically, Dependentiae (TM6), Nitrospinae, Chlamydiae, Bacteroidetes, Aminicenantes, and Actinobacteria were closely associated with environmental factors such as MC, pH, OM, and AP (P ≤ 0.05) (Fig. 6). Additionally, the relative abundance of these bacteria was significantly correlated with heavy metal contents, including Zn, Ni, Hg, and Cd, at the 0.05 level. Notably, the relative abundances of nine bacterial phyla were significantly correlated with the contents of Hg and Ni. Among these, Chlorobi exhibited a positive relationship with Hg, while Firmicutes, Ignavibacteriae, and Spirochaetae were positively correlated with Ni. This indicates that these four phyla are strongly adaptable to moderate Cd pollution levels and can effectively degrade and transfer Hg and Ni in specific soil environments. Moreover, there is a significant correlation between pH and six bacterial phyla, indicating that pH further influences the microbial community structure by affecting the leaching of heavy metals and regulating AP, AK, TN, and OM, consistent with the findings of this study [39, 40].
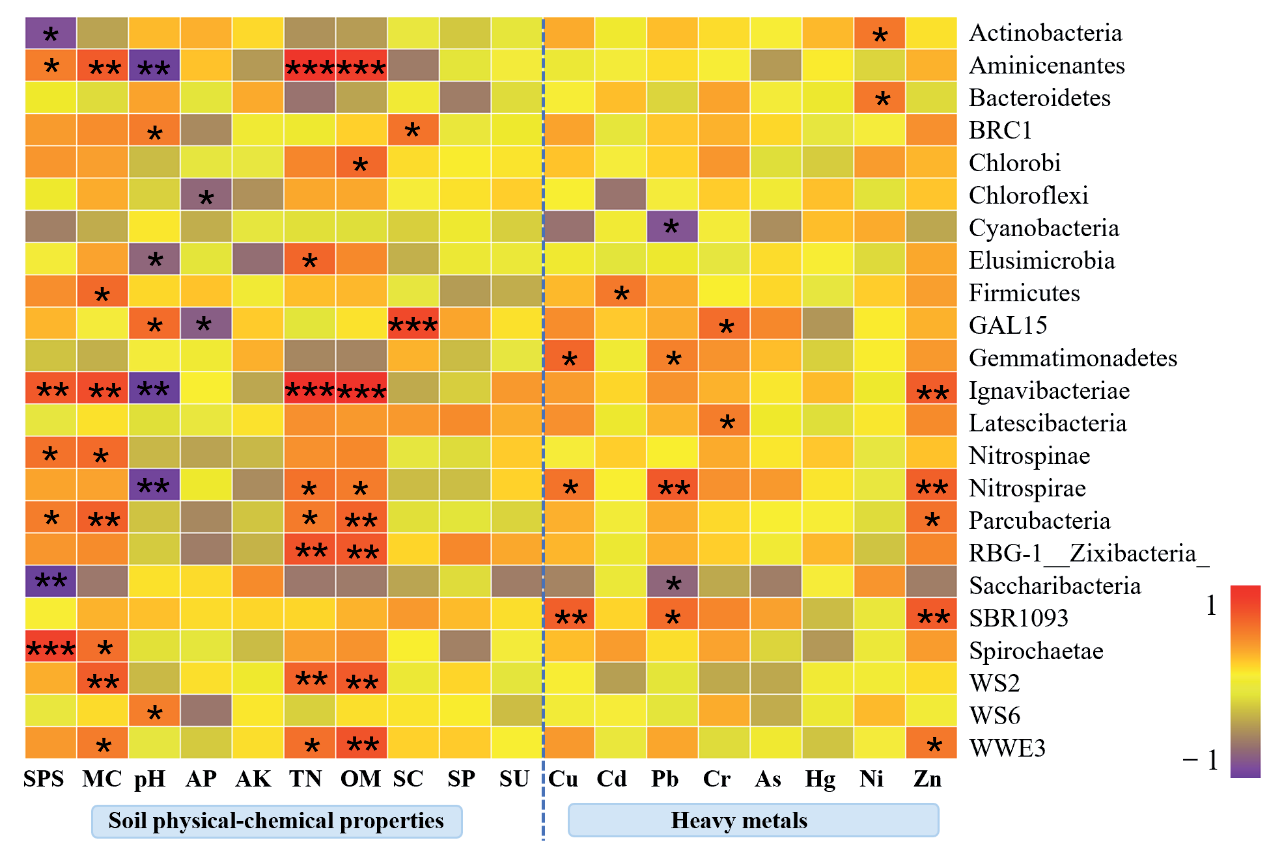
Furthermore, the relative abundance of soil bacteria was closely related to the basic physicochemical properties of soil in farmlands with severe cadmium (Cd) pollution. Specifically, Aminicenantes, GAL15, Ignavibacteriae, Nitrospirae, Parcubacteria, WS2, and WWE3 showed significant correlations with OM, TN, pH, MC, and SPS at the 0.05 level (Fig. 7). The relative abundances of 13 bacterial phyla were found to be closely associated with the contents of Cu, Cd, Pb, Cr, Ni, and Zn. Among these, Cu was positively correlated with Gemmatimonadetes, Nitrospirae, and SBR1093; Firmicutes with Cd; GAL15, Gemmatimonadetes, and Latescibacteria with Cr; Actinobacteria and Bacteroidetes with Ni; Gemmatimonadetes, Nitrospirae, and SBR1093 with Pb; and Ignavibacteriae, Nitrospirae, Parcubacteria, SBR1093, and WWE3 with Zn. Overall, these 11 bacterial phyla demonstrated strong adaptability to severe Cd pollution and were able to effectively degrade and transfer Cu, Cr, Pb, and Zn. The results also indicated that basic soil physicochemical properties had a greater impact on bacterial community structure under severe Cd pollution conditions, and many bacteria remained capable of degrading heavy metals. The heavy metal-tolerant bacteria identified in this study aligned with findings from other research, reinforcing the robustness and reliability of these results [41-43].
Table 4.
Diversity indexes of soil bacterial community at different Cd pollution levels.
Table 5.
The correlation between environmental factors and bacterial community structure.
Fig. 6.
Effects of environmental factors on bacterial community phyla at moderate Cd pollution level. Note: the figure shows the correlation between environmental factors and bacterial communities, with a warm tone indicating a positive correlation and a cool tone indicating a negative correlation. (* indicates 0.01 < P ≤ 0.05, ** indicates 0.001 < P ≤ 0.01).
Genus Level
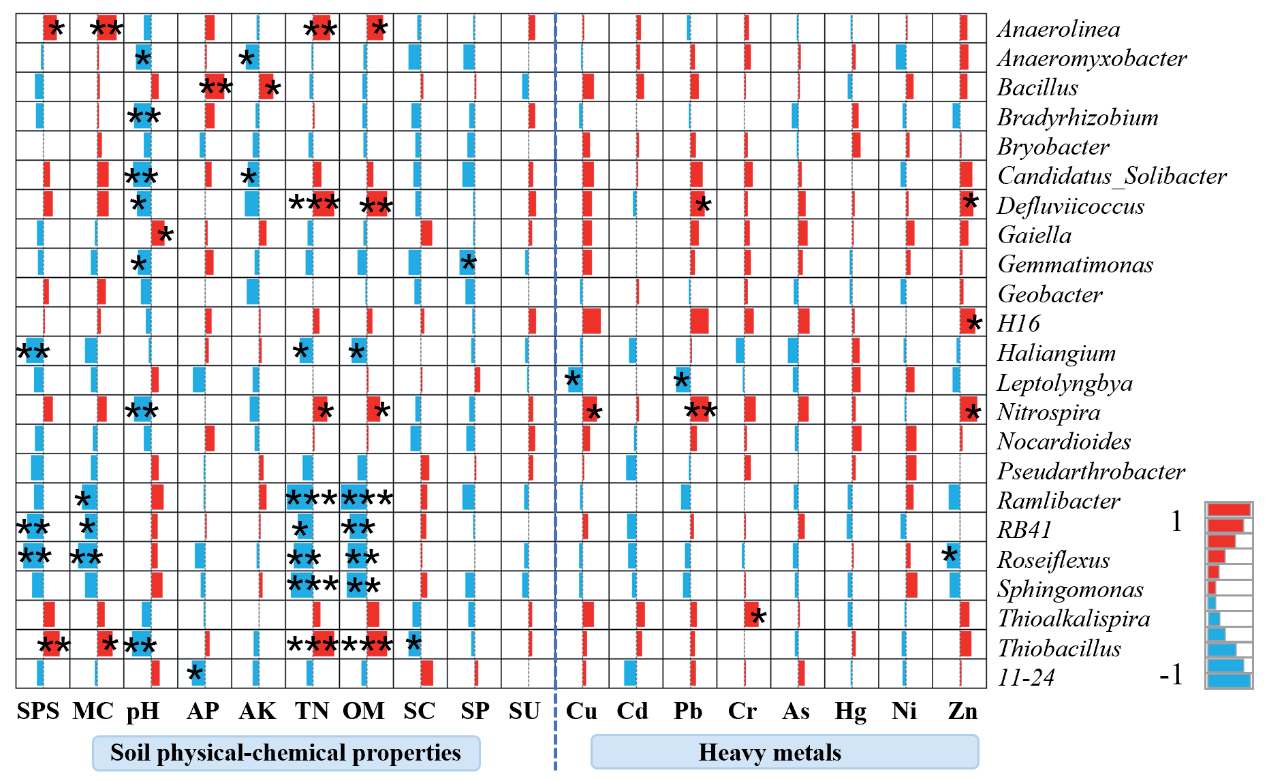
In soils with moderate Cd pollution, the relative abundance of the bacterial community was primarily influenced by factors such as pH, MC, TN, OM, SC, and SP, which reflect the basic physicochemical properties of the soil. These factors had a significant impact on the relative abundance of Anaerolinea, Candidatus_ Solibacter, Gemmatimonas, and Haliangium (Fig. 8). In summary, only two heavy metals, Ni and Cr, showed a significantly positive correlation with Bacillus, Thioalkalispira, and Thiobacillus. Thus, the content of heavy metals in the soil only slightly influenced the relative abundance of bacterial genera. In comparison, the basic soil physicochemical properties exerted a greater effect on bacterial community structure, and some bacteria were capable of degrading heavy metals like Ni and Cr [44].
Fig. 7.
Effects of environmental factors on bacterial community genera at severe Cd pollution level. Note: the figure shows the correlation between environmental factors and bacterial communities, with a warm tone indicating a positive correlation and a cool tone indicating a negative correlation. (* indicates 0.01 < P ≤ 0.05, ** indicates 0.001 < P ≤ 0.01, *** indicates P ≤ 0.001).
In soils with severe cadmium (Cd) pollution, SPS, pH, MC, TN, and OM, among the basic soil physicochemical properties, drastically affected the bacterial community structure. Specifically, these factors correlated with the relative abundances of Anaerolinea, Defluviicoccus, Haliangium, Nitrospira, Pseudarthrobacter, Ramlibacter, RB41, Thiobacillus, and other genera (Fig. 9). Among these, Ramlibacter, RB41, Roseiflexus, and Sphingomonas were negatively related to the relative abundance of nutrient indicators such as TN and OM. This may be because heavy metal-intolerant bacteria rapidly absorbed nutrients while degrading heavy metals and resisting toxins, consistent with findings from previous studies [25]. On the other hand, Cu, Pb, Cr, and Zn prominently affected the abundance of certain bacterial genera. In particular, Cu showed a significant positive correlation with Nitrospira at the 0.05 level, Pb correlated with Defluviicoccus and Nitrospira, Cr with Thioalkalispira, and Zn with Defluviicoccus, H16, and Nitrospira. In soils with severe Cd pollution, nutrients were key to the growth and reproduction of bacterial communities. In summary, heavy metal-tolerant bacteria created a more favorable environment for other bacteria by degrading heavy metals [45]. In soils with high pollution levels, the relative abundance of heavy metal-tolerant bacteria generally exhibited an upward trend. This may be because the more severe the pollution, the better the bacteria absorbed and degraded heavy metals, aligning with findings from other studies [46].
Influence of Different Cd Pollution Levels on Soil Bacterial Function
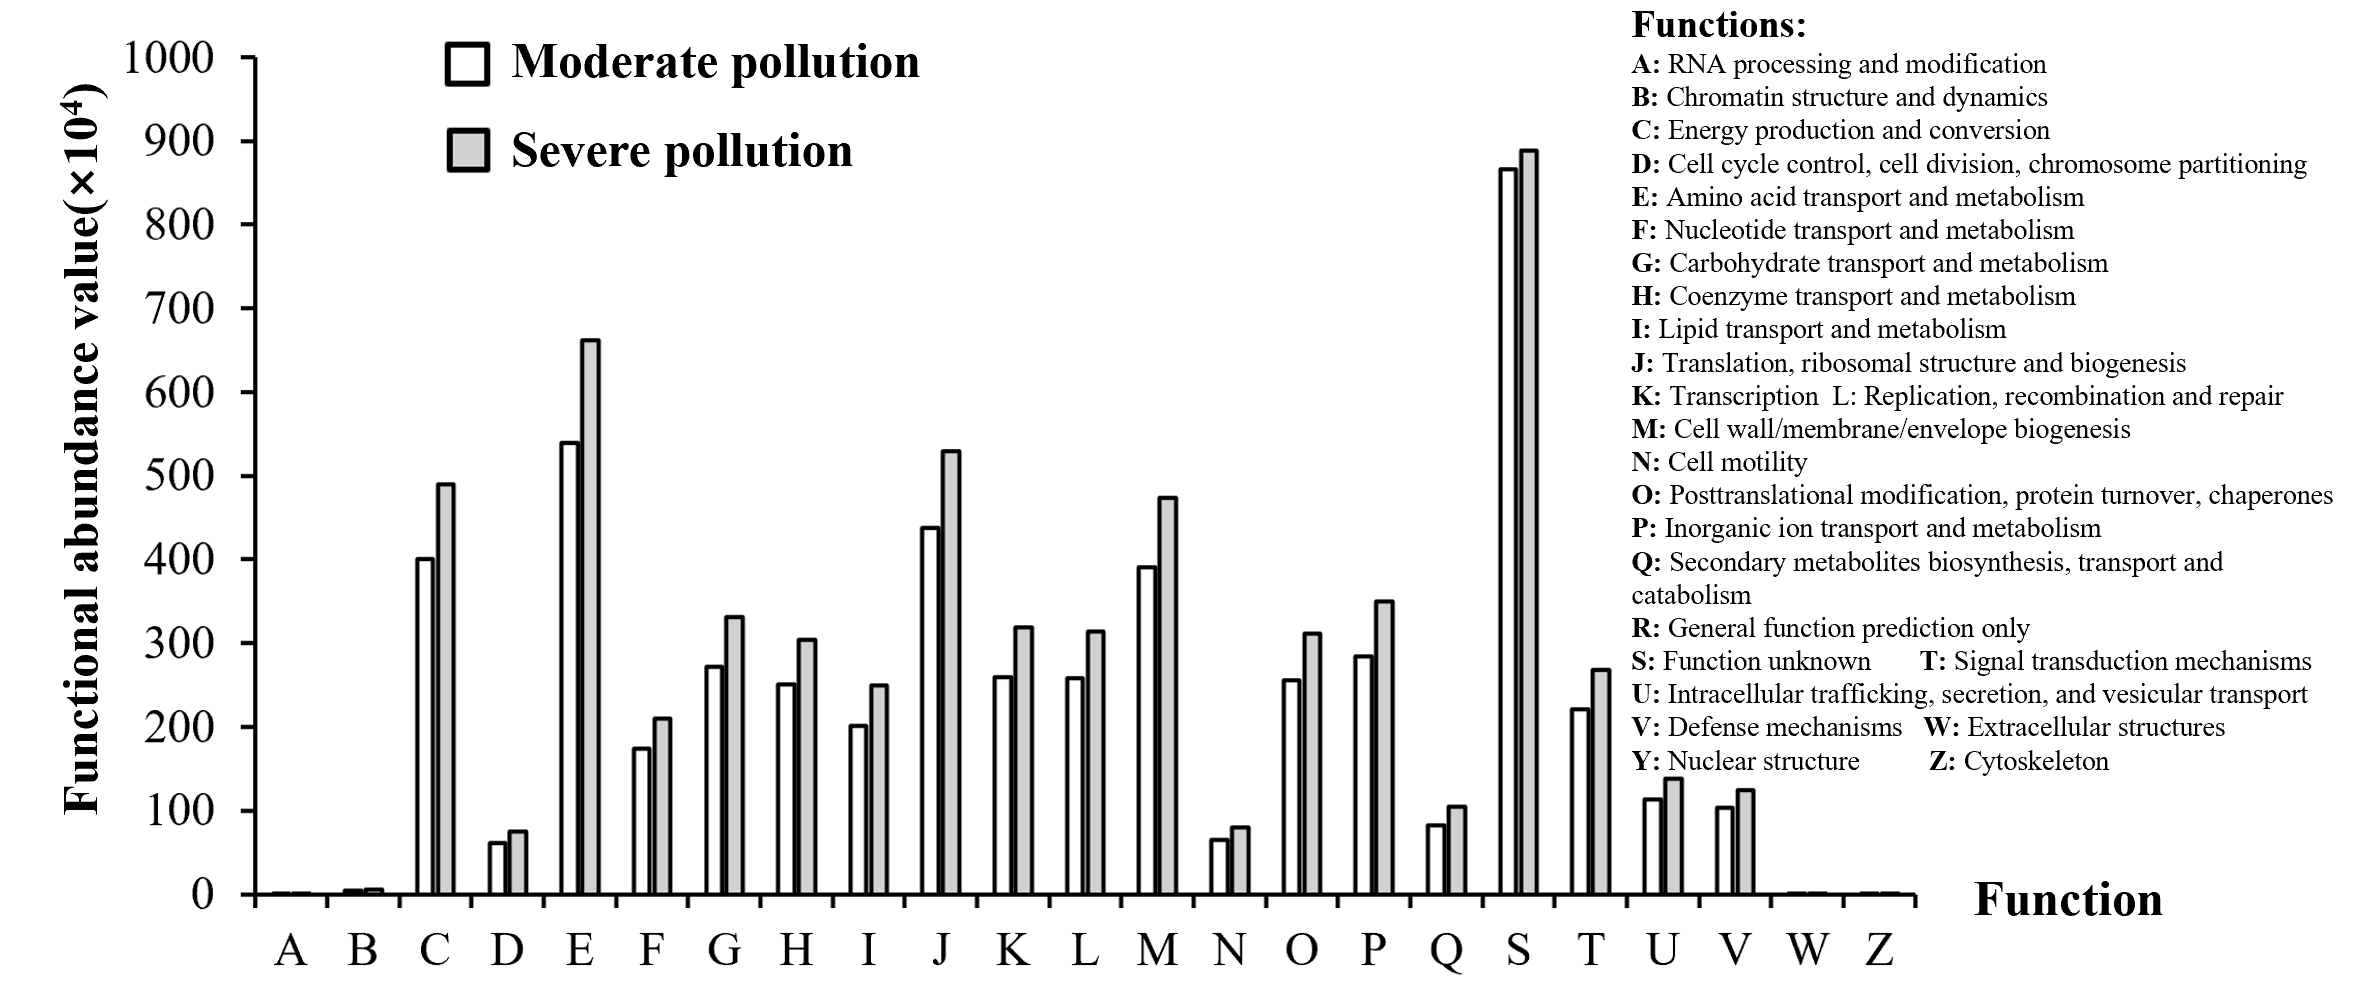
To predict the 16S amplicon sequencing, we utilized PICRUSt, a commonly used method designed to infer gene functions based on the information from bacterial 16S rDNA and OTUs of related bacteria in the Greengenes database [47]. Simultaneously, we predicted the gene functions of other untested bacteria in Greengenes to construct a comprehensive overview of the functions of archaea and bacteria. Finally, we mapped the bacterial community composition from sequencing to the database to predict the metabolic functions of the bacterial community [48, 49]. The results indicated that amino acid transport and metabolism, energy production and conversion, cell wall/membrane/ envelope biogenesis, translation, ribosomal structure, and biogenesis were the predominant functions, particularly in severely Cd-contaminated soils (Fig. 10). In other words, the more contaminated the soil, the more efficient and active the bacteria became in functions such as amino acid transport and metabolism, energy conversion, and cellular activities. The functions of bacteria in the two groups differed significantly (p < 0.05), as did the compositions of the bacterial communities. As a result, the cycling of soil nutrients and the transfer and degradation of pollutants were facilitated, creating a favorable environment for plant growth [50].
Fig. 8.
Correlation between soil environmental factors and bacterial community genus at moderate Cd pollution level. Note: the figure shows the correlation between environmental factors and bacterial communities, with a warm tone indicating a positive correlation and a cool tone indicating a negative correlation. (* indicates 0.01 < P ≤ 0.05, ** indicates 0.001 < P ≤ 0.01).
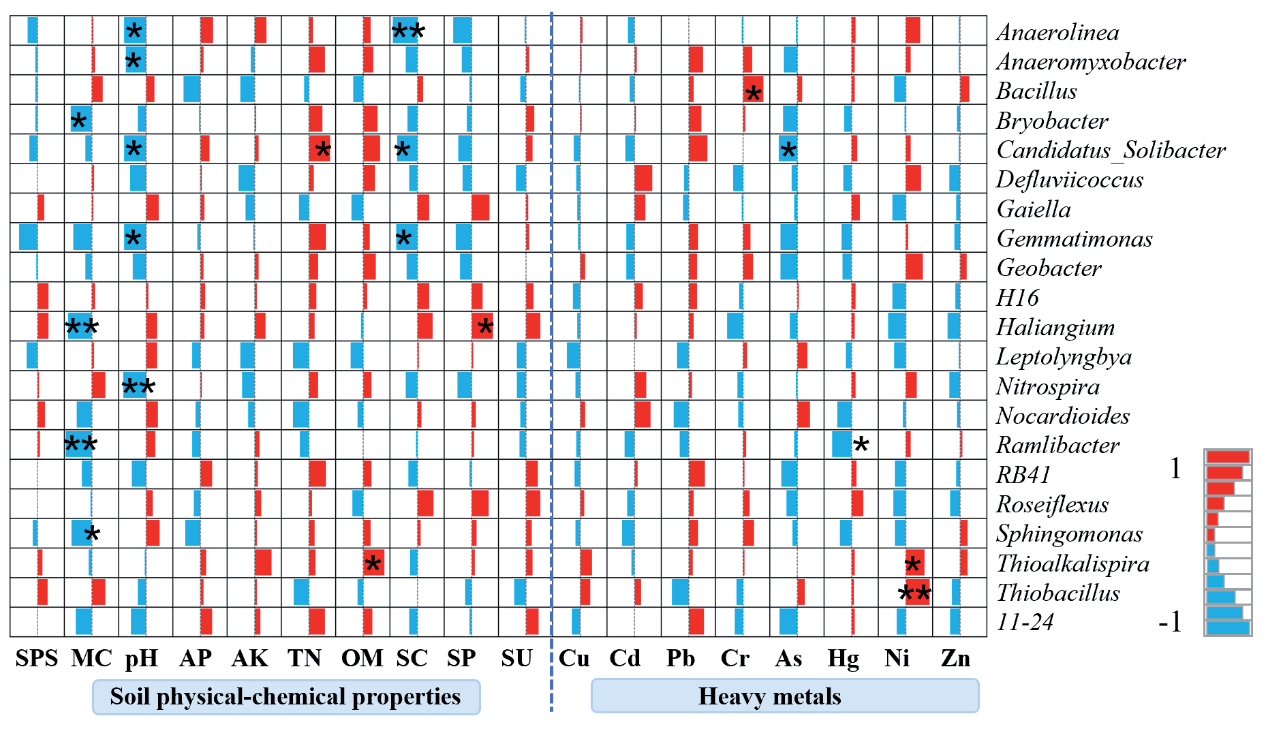
Fig. 9.
Correlation between soil environmental factors and bacterial community genera at severe Cd pollution level. Note: the figure shows the correlation between environmental factors and bacterial communities, with a warm tone indicating a positive correlation and a cool tone indicating a negative correlation. (* indicates 0.01 < P ≤ 0.05, ** indicates 0.001 < P ≤ 0.01, *** indicates P ≤ 0.001).
Conclusions
In this study, the biological traits, heavy metal content, and basic physiochemical properties of soil were measured by DNA high-throughput sequencing and experimental analysis. We probed into how different Cd pollution levels influence soil microbial community structure. Here are the main conclusions:
(1) Cd pollution levels significantly affected the soil bacterial traits, mainly demonstrated in the bacterial community diversity and structure changes. In the study area, for one thing, indexes of community richness, including Sobs and Chao, of samples with severe Cd pollution are significantly higher than those with moderate pollution at the p < 0.05 level. For another, indexes of community diversity, including Shannon and Invsimpson, of samples with severe Cd pollution are also way higher than those with moderate pollution.
(2) At different levels of Cd pollution, heavy metal has a prominent effect on bacterial community structure. In detail, there are 14 cultivated soil samples with moderate Cd pollution; 9 bacterial phyla positively correlated with Ni and Hg significantly; and 3 bacterial genera can efficiently degrade Ni and Cr. In addition, there are 36 soil samples with severe Cd pollution; the relative abundance of 11 bacterial phyla is in a significantly positive correlation with the contents of Zn, Pb, Cr, and Cu, showing strong adaptability with severe Cd pollution and the ability to transfer and absorb certain heavy metals. In addition, Ramlibacter, RB41, Roseiflexus, Sphingomonas, and other genera are in a significantly negative correlation with the relative abundance of TN, OM, and other nutrient indicators, and the contents of Zn, Cr, Cu, and Pb with the relative abundance of four genera.
(3) As for bacterial functions, the functional abundances of energy production and conversion, translation, cell wall/membrane/envelope biogenesis, amino acid transport and metabolism, ribosomal structure, and biogenesis in soils with severe Cd pollution are much higher than those in soils with moderate pollution at the p < 0.05 level. This leads to huge differences in bacterial community compositions. In other words, the more contaminated the soil is, the more efficient and vitalized bacteria become in functions like amino acid transport and metabolism, energy conversion, and cellular activities.
This study examines the composite effects of soil physicochemical properties and heavy metal contents on soil bacterial communities across various levels of Cd pollution. The findings are intended to provide guidance for future analyses of soil bacterial community structure in contaminated environments, the impact of varying levels of heavy metal pollution on soil microorganisms, and the identification of heavy metal-tolerant bacteria.

