

Introduction
The ecological crisis, which has become more visible through global climate change will bring many green discourses and policy tools from ecology to economy, from economy to politics. Environmentalism and the green movement, which stands out as activism, have turned into a very serious sanction tool by the European Union (EU). This tool is the search for an alternative way on economic growth, which cannot be waived. For new pursuits, the idea of green is always promising. The idea of green is the manifestation of green thinking and the starting point of green thinking is the respect for nature. Europe, which pioneered the Green Consensus, is the continent that also constitutes the primary source of green thinking in parallel. As a matter of fact, the 18th century is the period when scientific knowledge gained a reductionist and categorizing nature, and nature began to be examined systematically. Scientific and systematic studies on nature in Europe have evolved into nature conservation as a developing movement in North America. As a matter of fact, the European Union (EU), with the European Green Consensus announced on 11 December 2019, set its goal of being the first climate-neutral continent in 2050; at the same time, it has announced that it will adopt a new growth strategy that requires the transformation of its industry and that it will reshape all its policies on the axis of climate change. Relevant actions within the scope of the European Green Deal lay the foundations for a transformation that will reshape the EU economy, including energy, transport, industry, finance, construction, agriculture, and gain momentum with each passing year. With the need for structural transformation in the global economy revealed by the COVID-19 crisis, after the EU announced its comprehensive and ambitious green transformation targets to become the first carbon-neutral continent in 2050, policies in other countries in the field of combating climate change have also gained momentum. In this context, it is seen that other leading actors of international trade such as South Korea, Japan and China have started to announce their targets for the green transformation of their economies in 2020. In addition, countries such as Sweden, Norway, Canada, Chile, and South Africa were among the countries that declared their net zero emission targets. The implementation of the Smart Transportation Systems Strategy Document and Action Plan (2020-2023) prepared by the Ministry of Transport and Infrastructure will also contribute to the reduction of emissions through the creation of an efficient, sustainable, environmentally friendly and smart transportation. In the Action Plan, in order to contribute to Türkiye’s transition to a sustainable and resource-efficient economy and to adapt to the comprehensive changes envisaged by the European Green Deal, in a way that will preserve and further the integration achieved under the Türkiye-EU Customs Union, (1) border carbon regulations, (2) a green and circular economy, (3) green finance, (4) clean, affordable and secure energy supply, (5) sustainable agriculture, (6) sustainable smart transportation, (7) combating climate change, (8) diplomacy and (9) European Green Deal information and awareness activities to be implemented in order to achieve the targets determined under the headings are included. In this framework, the Action Plan includes a total of 32 targets and 81 actions under 9 main headings [1].
Another area that should be at the center of policies to reduce greenhouse gas emissions is sustainable smart transportation policies. As a matter of fact, with the increasing mobility all over the world, the share of emissions from the transportation sector in global greenhouse gas emissions is gradually increasing. This situation has led to the development of transportation modes, which is one of the main agenda items of many countries around the world, in parallel with globalization and technological developments, and to be reconsidered by taking into account sustainability and environmental dimensions. When the Sustainable and Smart Transport Strategy announced by the EU within the scope of the European Green Consensus is examined, it is aimed to increase the share of sustainable and green transport modes by developing combined transport; increasing rail and inland waterway transport in freight transport; launching zero-emission vehicles in road, air and maritime transport; development of electric vehicle infrastructure; increasing the production/use of sustainable and alternative fuels in all modes of transport. Considering the effects of transportation on the environment, it is seen that the pricing of transportation and the development of smart transportation systems are included. In addition, it is aimed to reduce emissions from transportation by 90% by 2050 by creating an environmentally friendly, smart, competitive, safe, accessible and affordable transportation system [1].
On the other hand, in addition to efforts to limit and reduce anthropogenic greenhouse gas emissions; it has become inevitable to deal with climate change in connection with other global problems such as economy, international trade, health, migration and security. The need for additional reforms at the global level in order to realize economic growth by considering the climate agenda and to encourage investors and businesses to operate in line with a scenario that limits global warming has brought the fight against climate change to the center of international economic and trade policies. In most studies in the academic literature, it has been empirically proven that trucks are dominant in freight transportation in many countries, and that freight transportation increases energy consumption and emissions despite all the precautions taken [2–3]. Steenhof (2006) et al. showed in their study that the primary cause of increased freight transport emissions in Canada is increased demand and this demand is met by trucks. The Life Cycle Analysis has shown that the most important share in the environmental impacts of road freight transport is due to truck mobility [4].
The most important factors affecting the emission of trucks are driving and route efficiency. Driving too much by accelerating, decelerating or changing gears increase emissions as well. In this regard, it has been observed that emissions can be reduced as a result of efficient driving training given to drivers. The issue of driving efficiency also includes the use of navigation, information and communication systems that provide route optimization. The important point in this regard is that the shortest route chosen is not always the least emitter. The shortest route chosen will increase emissions if it includes high-slope roads and congested sections [5].
When the contributions of this manuscript to the academic literature are take into account, time series models including multivariate regression, Johansen cointegration, Phillips-Ouliaris, Engle-Granger, FMOLS, DOLS, CCR and ARDL analysis ascertain the long-run relationship between trade openness, economic growth, freight transport and CO2 emissions from 1985 to 2021 for Türkiye. Considering the novelty of this article which brought to the academic literature, there is no other study for the 4 variables mentioned for the 1985-2021 periods for Türkiye. It is a surprising finding that trade openness causes more emissions than comparing to other variables. This study aims to contribute to the transportation literature through questions with both the methods used and the econometric findings obtained by several analyses. There is no other study that includes such comprehensive variables and various analyses in the environmental economics literature. The findings of this article, in which the complex models are constructed, are supported by many econometrical analyses. Considered from this perspective, the transport-induced EKC hypothesis has not been studied before and the fact that all the various findings on the subject overlap with each other make the research important. Thus, the fact that the transport-induced EKC hypothesis has not been studied in the literature increases the importance of this article through the analyses performed, the gap regarding this issue has been fulfilled as well. After the introductory part of the study, theoretical information about the EKC hypothesis and empirical studies on this subjects are given. Then, indicators of environmental pollution caused by CO2 are discussed which is revealed by using various econometric methods for Türkiye. Afterwards, information about the models used in this study, the data set and the methods to be applied are given. Subsequently, empirical findings obtained in multivariate regression, co-integration tests, FMOLS, DOLS, CCR, and ARDL analyzes are presented in methodology part of the manuscript. In the conclusion part, some policy recommendations were given by interpreting the findings.
Literature Review
There are several researches in the academic literature regarding the relationship among economic growth and environmental degradation within the context of EKC Hypothesis. Notably, in studies on the validity of the EKC hypothesis, GDP and energy consumption draw attention among the main variables affecting environmental damage. As a result of the discussions made with environmental problems coming to the fore on a global scale, it was emphasized that environmental problems could not be handled independently from economic development and social factors, and that the dimensions and direction of the relations of these factors with each other should be examined as a whole. In this direction, the Environmental Kuznets Curve (EKC) hypothesis has been put forward regarding the existence and form of the relationship between environmental quality and economic growth [6]. This hypothesis basically argues that there is a relationship between environmental degradation and economic growth, and while environmental degradation is observed in the first phase of economic growth, environmental degradation gradually decreases after a certain level of economic growth.
In the current academic literature, it is seen that there are quite a lot of studies testing the EKC hypothesis in various countries in terms of several factors. In this sense, some of these manuscripts discuss the relationship between environmental pollution, economic growth and trade openness by testing the Environmental Kuznets Curve (EKC) hypothesis. Several authors including Gyamfi et al. (2023), Bahadir (2022), Bese and Kalayci (2021), Dogan et al (2019), Dursun (2022a), Dursun (2022b), Kalayci (2021), Kalayci and Ozden (2021), Yazici (2022), Kayabas (2022), Kirikkaleli et al. (2021), Koksal (2021), Koksal and Cetin (2021), Bekun et al. (2023), Öztürk (2021), Sarigul and Apak (2022), Siddique (2022), and Tarazkar et al. (2021) have tested the validity of the EKC hypothesis within the context of trade liberalization [7-24].
Emission studies originating from road transport are very limited in Turkish academic literature. In fact, even the modeling of road freight mobility has not been fully done yet; Soylu (2007) estimated truck emissions using data from 2003 in his study, which generally focuses on emissions from automobile transportation and reduction strategies. According to the results of this study, trucks produced 11.1 million tons of CO2 in 2003 [25]. Agacayak et al. (2015) estimated nitrogen oxide (NOx), particulate matter (PM10), sulfur dioxide (SO2), volatile organic compounds (VOC) and ammonia (NH3) emissions from truck transportation in 2003 [26]. They also carried out the first two stages of the traditional four-stage demand model, the creation and distribution of travel. Vestreng et al. (2009) stated that the road transport sector in Türkiye produced 42% of the total nitrous oxide (NO2) emissions in 2005 [27]. TUIK estimated the countrywide direct CO2 emissions as 299.1 million tons in 2009 and stated that 46.7 million tons (15.6%) of this was due to the transportation sector [28].
When the EKC literature originating from the transportation sector is reviewed, Shahbaz et al. (2015) examined the relationship between energy consumption, energy prices, added value of the transportation sector and carbon emissions from road transport for Tunisia in 1980-2012. According to the results of the paper, fuel prices decreased CO2 emissions and road infrastructure boosted CO2 emissions. Besides, transport value-added increases CO2 emissions as well. The causality analysis demonstrated that the bidirectional casual linkage among CO2 emissions and energy consumption [29]. Bayer and Hanck (2013) applied ARDL limit test approach and VECM causality test, it was ascertained that there is an inverted-U trend between the transportation sector value added and carbon emissions, in other words, the EKC Hypothesis is affirmed in their study [30]. On the other hand, Xu and Lin discussed the relationship between economic growth and carbon emissions resulting from the energy consumption used in the transportation sector in 30 regions of China between 2000 and 2012. In the study, it was concluded that the EKC hypothesis is confirmed in terms of transportation sector within the determined years [31].
On the other hand, when the EKC literature is reviewed in terms of trade openness, Artan et al. (2015) investigated the effect of economic growth and trade openness on environmental pollution and tested the validity of the EKC hypothesis for the Turkish economy. In the study covering the 1981-2012 period, time series analysis method of CO2 emission, energy production, economic growth and trade openness data was used. The findings support that there is a long-term relationship between economic growth and trade openness and environmental pollution in Türkiye. However, while there is an inverted U-shaped relationship between economic growth and environmental pollution in line with the EKC Hypothesis, no inverted U-shaped relationship was found between economic growth and trade openness [32]. The findings of Artan et al. (2015) in terms of the long-term relationship between the relevant variables except truck transportation coincided with the results of this article for Türkiye. Kılıç and Balan (2018) analyzed the relationship between CO2 emissions, income, economic growth, trade openness, and financial development for the period 1996-2010 by using the pooled ordinary least squares method for 151 countries. Findings from the study support the cubic properties of the EKC hypothesis [33]. Lebe (2016) tests the validity of the EKC Hypothesis for Türkiye’s from 1960 to 2010. SO2 and GNP were selected as variables. It has been determined that the EKC hypothesis among the variables is valid for Türkiye and especially trade openness financial and development increase carbon dioxide emissions. According to the causality test results, one-way causality was found from financial development to carbon dioxide emissions, energy consumption and GDP in the short run. In the long run, findings confirming the feedback hypothesis between carbon dioxide emissions and financial development were obtained as well [34].
Mudam et al. (2018) investigated the existence of dynamic relationships between financial openness, trade openness, per capita income and carbon dioxide emissions (CO2) variables through VAR model by using annual data covering the period 1970-2015 for Türkiye. As a result of the analysis, it was revealed that 0.46% of the change in CO2 emissions was explained by financial openness, 1.04% by per capita income and 0.42% by trade openness [35].
Shahzad et al. (2017) aimed to address the long-term relationship between carbon emissions, energy consumption, trade openness and financial development in Pakistan with the ARDL bounds test approach. The data set of the study covers the period 1971- 2011. According to the Granger causality results, a unidirectional causality running from energy consumption, trade openness and financial development to carbon emissions, and bidirectional causality between energy consumption and financial development was determined [36]. Sbia et al. (2014) used both ARDL and VECM methods by using the data of renewable energy, trade openness, GDP, CO2 emission values between 1975-2011 in their study for the United Arab Emirates. According to the results of the analysis, since trade openness contributes to the development of the energy market and facilitates access to energy-efficient products, it leads to more efficient use of energy. Therefore, trade openness reduces energy consumption [37].
Material and Methods
This paper examines the relationship among trade openness, economic growth, freight transport on motorways, state and provincial roads and CO2 emissions in order to reveal and interpret empirical results of analysis by suggesting some solutions to Turkish government and policy makers. Data are derived from official websites of The World Bank (2022a, 2022b) [38- 39].
Table 1.
The result of multivariate regression (MR) analysis for Türkiye.
The General Directorate of Highways (2022) and Our World in Data (2022) for trade openness, economic growth, freight transport on motorways, state and provincial roads and CO2 emissions respectively from 1985 to 2021 as annual data in order to employ Multivariate Regression, Augmented Dickey-Fuller (ADF), Phillips-Perron (PP), The Kwiatkowski-Phillips-Schmidt-Shin (KPSS) Unit Root, Johansen co-integration, Impulse Response & Variance Decomposition, Engle-Granger co-integration, Phillips-Ouliaris co-integration, Jarque‑Bera Normality, Cusum tests, Fully Modified Ordinary Least Squares (FMOLS), Dynamic Ordinary Least Squares (DOLS), Canonical Co-integration Regression (CCR) and Autoregressive Distributed Lag (ARDL) analysis [40-41].
The effects of trade openness, economic growth, freight transport on motorways, state and provincial roads on CO2 emissions have taken into account from 1985 to 2021 through Multivariate Regression (MR) for Türkiye, see Table 1. The variables of GDP represents economic growth, road freight indicates freight transport on motorways, state and provincial roads, CO2 emissions demonstrates ‘production’ or ‘territorial’ emissions (i.e. emissions from the burning of fossil fuels, or cement production within a country’s borders), and finally trade openness represents the sum of exports and imports of goods and services measured as a share of gross domestic product.
One of the main question of this article are there any impact of independent variables on dependent variable. In this context, Multivariate Regression (MR) is performed in order to answer this research question. According to Table 1, it has been found that all dependent variables including trade openness, economic growth, and freight transport (truck transport) affect the dependent variable (CO2 emissions). The p-value of trade openness is 0.00 which is significant finding of MR analysis. The other independent variables GDP and truck transport influence the CO2 emissions where the p-values have been found as 0.0039 and 0.0255 respectively. When MR analysis is questioned whether the model correct or not, there indicator have to be investigated including autocorrelation, heteroscedasticity and spurious nexus in terms of correlation coefficient. The first indicator of potential autocorrelation problem is Durbin-Watson statistics which is 1.9423 at Table 1. above. The result of Durbin-Watson statistics is pretty closest to 2 means that there is no autocorrelation problem. The other important indicator is autocorrelation graph below (Fig. 1.) where all residual are distributing randomly within the circle. Thus, this graph also shows that there is no autocorrelation problem. Finally, the score of AR(1) is also less than 0.05 which is final proof of nonexistence of autocorrelation problem.
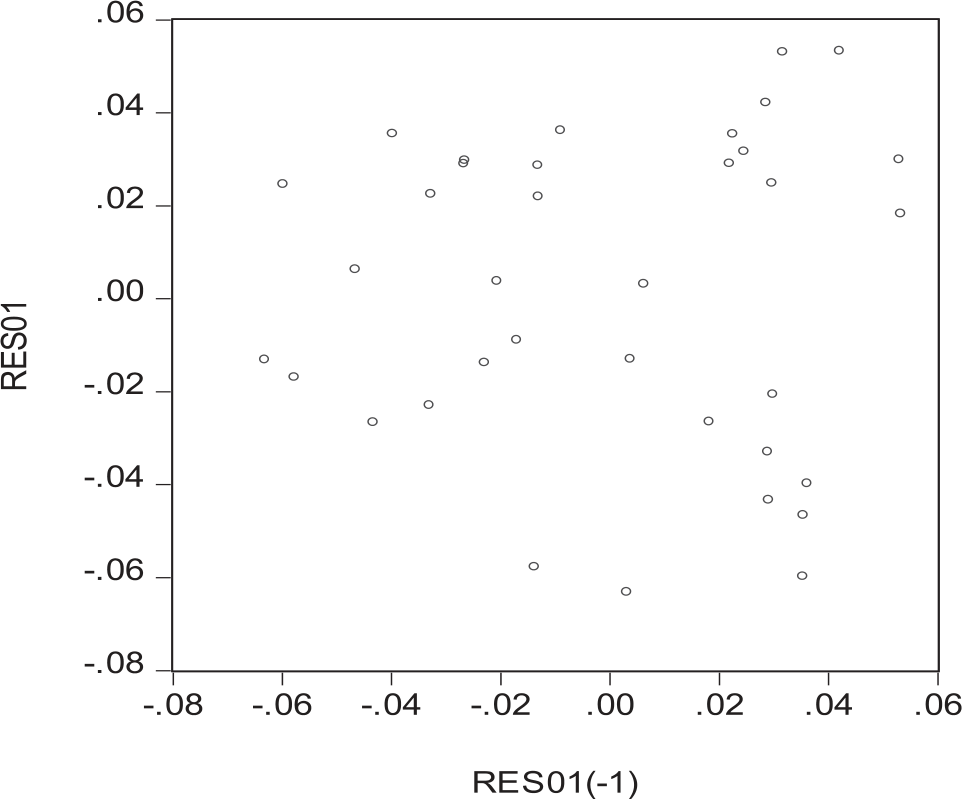
Another potential problem to be questioned in the model is heteroscedasticity problem. The p-value of r-square is 0.9827 which is among the optimal values. The last potential problem is the spurious relationship between variables. The p-value of @trend is more than 0.05 which indicates that there is no spurious regression problem. Thus, it can be interpreted that the Multivariate Regression (MR) is statistically corrected and verified that truck transport, trade openness, and economic growth caused environmental degradation.
First of all, the series of all variables should be stationary in order to proceed to Johansen co-integration, Impulse Response & Variance Decomposition, Engle-Granger co-integration, Phillips-Ouliaris co-integration, Cusum Tests, Fully Modified Ordinary Least Squares (FMOLS), Dynamic Ordinary Least Squares (DOLS), Canonical co-integration Regression (CCR) and Autoregressive Distributed Lag (ARDL) analysis. In this sense, Augmented Dickey-Fuller (ADF), Phillips-Perron (PP), and the Kwiatkowski-Phillips-Schmidt-Shin (KPSS) unit root tests were employed to test the stationarity of the series.
According to results of Table 2 below, all variables are not stationary at I(0) level. After converting the series from I(0) to (I), they all became stationary as indicated by the value of their respective ADF and PP statistics which are both larger (in absolute terms) than the standard critical values, thus leading to the rejection of the null hypothesis at Table 2. On the other hand, Table 2. demonstrates the findings of KPSS below as well. A stationary property of the series is investigated by implementing the FKPSS test. According to the findings in Table 2., F statistics points out the non-linear nexus among variables which should be implemented in the test. The FKPSS test statistics indicate that all series are not stationary at I (0). Thus, negative releasing effect and damaging the atmosphere cause environmental pollution when considering the initial stage of the Türkiye. 0.172 at 5% levels for k = 1 is considered at KPSS test when calculating the stationarity of the series.
Table 2.
ADF, PP and KPSS unit root tests for Türkiye.
The ADF test is performed to the series through AIC Akaike Information Criterion including trade openness, economic growth, freight transport and CO2 emissions to reveal their stationarity. In addition, the maximum lag length is selected to be 2 as per Ng and Perron’s suggestion [42]. The ADF unit root test contains a parametric model in terms of higher-order correlation, considering that the series sustain an AR (k) process and entrain the lagged difference nomenclature of the dependent variable to the right side of the specified series.
When Equation (1) is taken into account the null hypothesis examines a mean stationary alternative unit root in yt of the investigated time series of y. Besides, Equation (2) indicates the unit root of null hypothesis along with being the aim of trend-stationary as alternative. The term Δyt–j states the first difference of Equation in the error term which provides the serial correlation. Lastly, a linear and constant time trend should be considered in the ADF test, as indicated in the Equations (1) and (2).
According to the Augmented Dickey Fuller (ADF) test findings at Table 2, above the series are not stationary at level intercept. After converting the series of data from non-stationary I(0) to stationary I (1), (Table 3) the series have been employed in the Johansen co-integration test in order to comprehend that there is a long-run nexus among the variables or not. The findings of Johansen co-integration test above that there is a long-run relationship among CO2, GDP, freight transport (truck transport) and trade openness at Table 3. The results of Johansen co-integration test is coincide with Multivariate Regression (MR) analysis’s findings at Table 1. Thus, it has been found that both all independent variables affect the dependent variables and there is long-run nexus among variables.
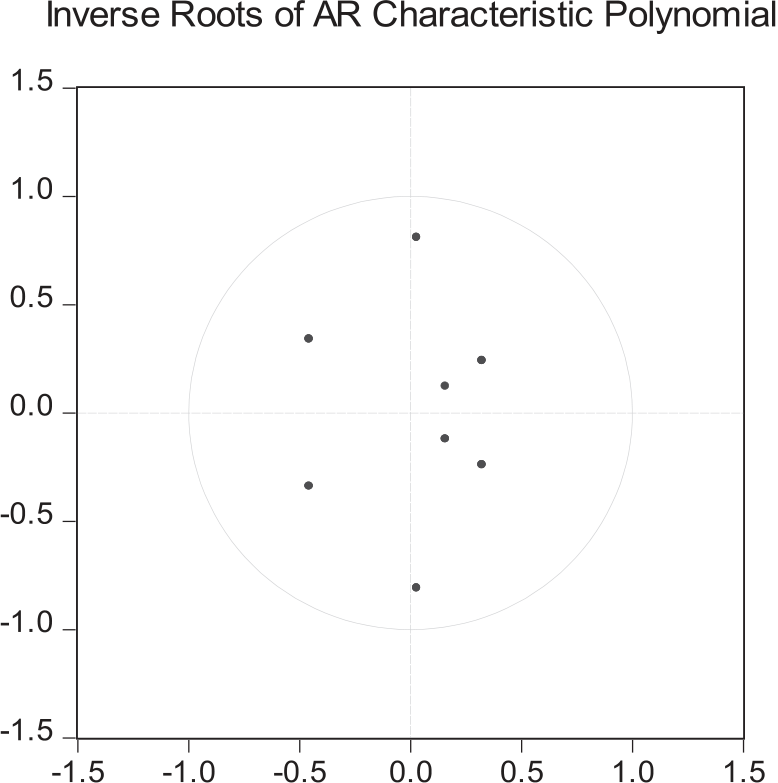
Türkiye is considered for both impulse response and variance decomposition analysis to comprehend the effect of freight transport (truck transport), GDP, trade openness on CO2 emissions. It has been implemented the VAR analysis to conceive the linear interdependence among the relevant series including freight transport (truck transport), GDP, trade openness and CO2 emissions for Türkiye. In this context, in order to execute the VAR model the lag order is determined as 2. After taken into account the inverse roots of the characteristic AR polynomial, eight points of the roots fall inside the unit circle. Thus, it has been decided that VAR model is stationary (see Fig. 2).
Table 3.
Johansen co-integration test results for Türkiye.
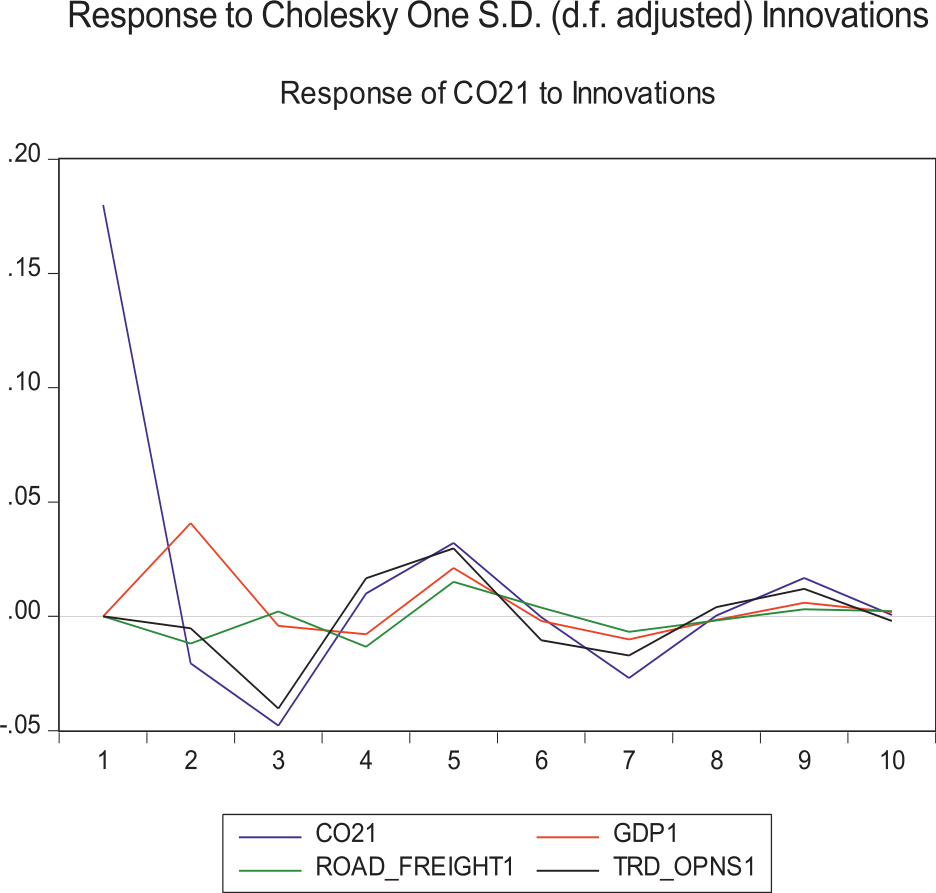
It has been employed impulse response and variance decomposition analysis by using the data after determining the VAR analysis as stationary. In this context, the impulse response model is performed in order to test the tenor of the linkage among the four variables. The findings indicate that trade openness has the strongest effect on CO2 emissions compared to truck transport and GDP in the Türkiye (see Fig. 3). The variance decomposition results verify the impulse response analysis (see Table 4). According to variance decomposition of Türkiye, trade openness has highest impact on CO2 emissions which is found as “7.759287”. The empirical findings of both impulse response and variance decomposition that the results of Multivariate Regression and Johansen co-integration test coincide with each other. Thus, empirical results confirm the EKC hypothesis.
When the academic literature is reviewed in terms of econometric methods, especially two co-integration tests are widely used. First one is the Engle-Granger (1987) test and the other one is Phillips-Ouliaris (1990) co-integration test which is developed by Phillips-Ouliaris [43-44]. The Equation models in terms of Phillips-Ouliaris co-integration test are demonstrated at (3), (4), (5), (6) and (7) below. According to Table 5, and Table 6, there is a long-run co-integration relationship among the variables. Thus, a long-run linkage is determined among the series for Türkiye from 1985 to 2021 which affirms the EKC hypothesis.
After performing the unit root test to the series in order to comprehend if they are stationary or not at Table 2, Phillips-Ouliaris co-integration test is employed in to test the long-run linkage among the series. Whether the values are empirically significant at a certain level or not and the null hypothesis of “no co-integrated vector” is analyzed considering the co-integration test. If the p-value is statistically meaningful, the null hypothesis of “no co-integrated vector” is rejected. Thus, it is demonstrated that the series are correlated in the long term for the Türkiye. In addition, Phillips-Ouliaris co-integration test is one of the significant analyses which employed to the residuals, and it concludes two test statistics, respectively variance ratio test and multivariate trace test. The variance ratio test statistic “Ṕu” is indicated in Equation model (3).
Table 4.
Variance decomposition for Türkiye.
Table 5.
Engle-Granger co-integration test for Türkiye.
The ût demonstrated in Equation model (3) which is the residual of the long-run regression.
As Adesina expressed the variance ratio test is a fundamental residual Equation that the null hypothesis (H0), which is assumed as there is no co-integration [45]. The null hypothesis is stated as the conditional variance parameter ώ11.2 in the following equation. The hypotheses in the variance ratio test are:
The trace statistic stated as Ṕz which is demonstrated in Equation model 7.
“T” is demonstrated in Equation model (7), as the quantity of observations.
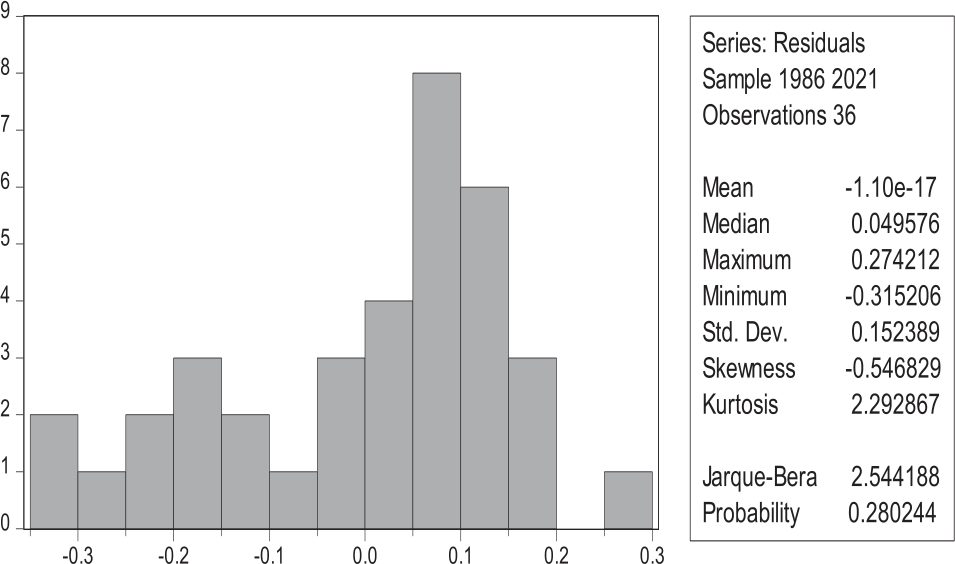
According to the Phillips-Ouliaris co-integration test in Table 6 above, Z statistic and Tau statistic are statistically meaningful at one percent significance level. The long-term linkage of the analysis is confirmed by the co-integration test of Engle-Granger and Phillips-Ouliaris for Türkiye at Table 5 and Table 6 respectively. It should be examined whether the Engle-Granger and Phillips-Ouliaris analyses have econometric problems or not to validate both models. In this context, first of all, it is demonstrated whether the relevant models have a normal distribution or not. Therefore, the presence of the normal distribution of the model is analyzed by implementing the Jarque-Bera statistic. According to Fig. 4, the Jarque-Bera statistic is “2.544188” and the p-value is “0.280244” since the probability value is greater than 0.05, the residuals have a normal distribution. Finally, both Engle-Granger and Phillips Ouliaris co-integration tests are affirmed as statistically for Türkiye.
Consequently, empirical findings of Türkiye confirmed the Environmental Kuznets Curve (EKC) hypothesis in terms of multivariate regression, Johansen co-integration, impulse response, variance decomposition, Phillips Ouliaris, Engle Granger and Jarque-Bera Normality tests from 1985 to 2021.
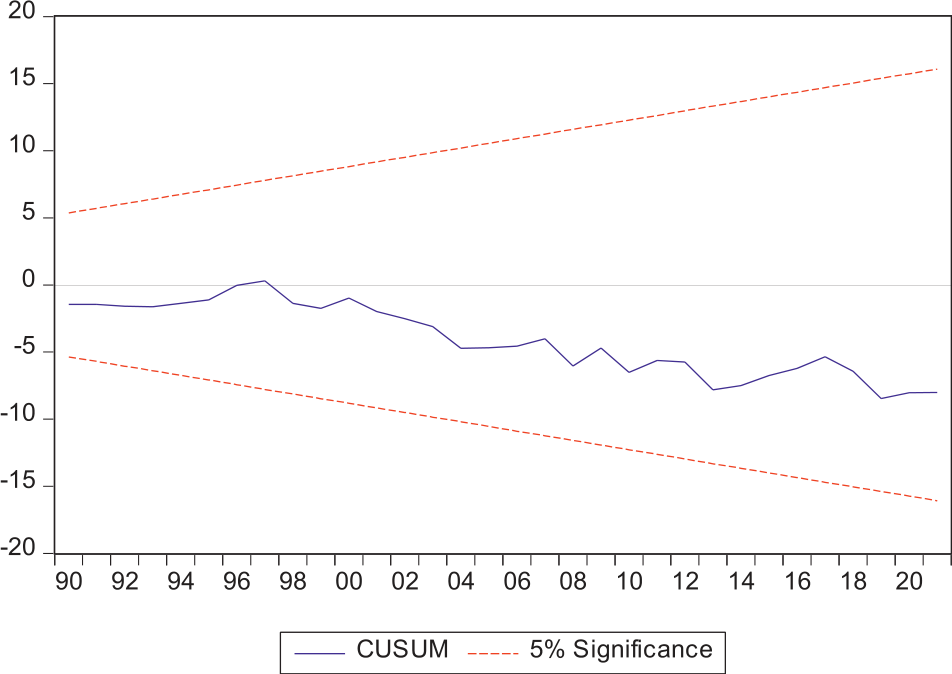
Cusum test is performed to test the stability of the variables in the long-run at Fig. 5 above. The test is improved by several researchers [46]. Besides, the Cusum test involves the cumulative sum of the recursive residuals. The cusum test provides the pair of 5% critical lines at Fig. 5. If the movement of predicted value climb over the critical line that mean it recommends instability. The results demonstrate that the movements of the line fall inside the 5% significance critical value which suggests that the coefficients are stable in the specific period.
Table 6.
Phillips-Ouliaris co-integration test for Türkiye.
Fully Modified Ordinary Least Squares (FMOLS), Dynamic Ordinary Least Squares (DOLS), Canonical co-integration Regression (CCR) analysis are used to comprehend the long‐term impact among freight transport (truck transport), GDP, trade openness on CO2 emissions for Türkiye. CCR analysis is developed by Park (1993) , DOLS analysis is developed by Stock and Watson (1992) and FMOLS analysis is developed by Phillips and Hansen (1990) [47-49]. FMOLS is a semi‐ parametric model to reveal the error of correlation which is asymptotically impartial and influential through CCR analysis. Besides, it arranges non-scalar coefficient error, allows for asymptotic chi‐square, and contains normal mixture distribution. DOLS conceive the explanatory series via considering the lags and leads. In addition, DOLS method predicts the co-integrating model and its errors containing perpendicular stochastic regressors. Both DOLS and FMOLS methods are so crucial to overcome the errors of endogeneity and autocorrelation by taking into account the inaccurate parameters.
According to results of FMOLS, DOLS and CCR analysis there is a long-term stable linkage between CO2, GDP, freight transport (truck transport) and trade openness from the periods of 1985 to 2021 for Türkiye which is demonstrated as empirically at Table 7 above. The p-values of all variables are less than 0.05 and they all exist at the 95 percent confidence interval. The empirical findings including Multivariate Regression, Johansen co-integration, Engle-Granger and Phillips-Ouliaris tests coincide with FMOLS, DOLS and CCR analyses. Thus, empirical results of all analysis confirm the EKC hypothesis for Türkiye. The other prevalently employed model in order to reveal the long-term linkage between series is ARDL analysis which supports the results of previous econometric findings. The ARDL Equation is indicated via econometric symbols, where the parameters of long-run CO2 are examined in Equation (8) below. ARDL model is performed out of FMOLS, DOLS and CCR analysis whether there is a long-term correlation between CO2, GDP, freight transport (truck transport) and trade openness. The findings of ARDL model at Table 9 coincide with the results of FMOLS, DOLS and CCR analysis. On the other hand, as a result of the bound test, it is determined to test the short and long term dynamics. The unconstrained error correction model in the work can be stated as follows which is indicated as Equation (8).
(8)
Table 7.
FMOLS, DOLS and CCR analysis for Türkiye.
The long-term relationship between CO2, GDP, freight transport (truck transport) and trade openness for Türkiye from 1985-2021 are considered through f bounds test which is assumed the zero hypothesis. Starting from Equation (8), δ, Δ, and εit indicate constant term, difference operator and error term, respectively. In this model, the long-run linkage among the series is examined and the hypotheses are established as follows. If F statistic value is less than lower limit value, which is suggested by Pesaran et al. (2001), then the null hypothesis is rejected, thus concluding that there is no long-run linkage among the series. In addition, if the calculated F statistic is greater than the upper limit value, then it is determined that there is a long-run relationship between the series. Besides all these, if the calculated F statistic is among the minimum and maximum values of specific interval, then indefinite findings may be acquired as well. After specifying the entity of a long-run nexus among the series with the boundary test, the process of forecasting the long-run coefficients of the variables can be performed.
Long-run predictions are acquired through comprehending nexus between the series by using ARDL Bound Test. Long term ARDL estimation results are given in Table 9. According to ARDL test results, there is a long-run relationship among the variables for Türkiye.
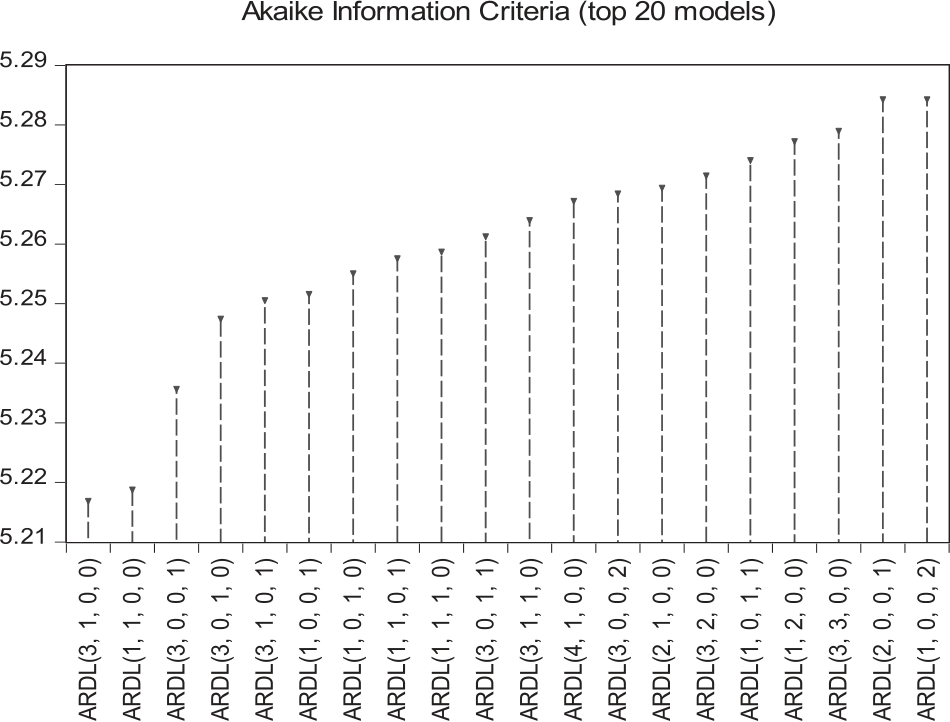
The most appropriate model is selected through the smallest value (3, 1, 0, 0) as part of the AIC criterion in Figure 6. The result of the boundary test is implemented to specify the long-run nexus among the variables and the diagnostic test findings of the analysis are provided in Table 8 within the context of this model which is suggested by Pesaran et al. (2001), and Narayan (2005) [50-51].
The F statistical value, which indicates the presence of a co-integration nexus among the variables, is calculated as 5.21. When this result is met with the lower and upper Table critical values, it is confirmed that there is a long-run linkage among the series at the 0.05 significance level. Besides, there is no autocorrelation or multiple linear correlation problems within the context of the diagnostic statistics in the model. The coefficient value of the long-run linkage is determined in the model which is given at Table 8.
The long-term ARDL findings are presented in Table 9; If GDP increases by 1 percent, CO2 emissions increases by 0.3678%. A 1 percent increase in road freight increases CO2 emissions by 0.1646. Furthermore, A 1 percent increase in trade openness increases CO2 emissions by 0.2572. ARDL results ascertain that the main elements of CO2 emissions are changed in GDP, road freight and trade openness at a 1% significance level for Türkiye in the short-term. Table 10 summarizes the short-run ARDL results for the ECM model.
Table 8.
ARDL model bounds test results for Türkiye.
| ARDL Bounds Test | (3, 1, 0, 0) | ||
|---|---|---|---|
| F-Stat Val | 5.21 | ||
| Pesaran et. al (2001) Crit Val. | %10 | %5 | %1 |
| Lower Level | 4.19 | 4.87 | 6.34 |
| Upper Level | 5.06 | 5.85 | 7.52 |
| Narayan (2005) Crit Val. | %10 | %5 | %1 |
| Lower Level | 3.64 | 5.19 | 7.22 |
Table 9.
Long-term ARDL results for Türkiye.
Finally, according to Table 10, error correction method is conceived to attain short-term adjustment. In the short-run, approximately 92% of shocks in GDP, road freight and trade openness are considered within a period of time and the system is re-established in the long-run.
As a result, the empirical findings obtained in this article exactly coincide with the results obtained by Galvan et al. (2022). Their study demonstrates that trade and economic growth affect carbon emissions in high-income countries and that there is a long-term relationship between them. Similarly, Karedla et al. (2021) reveal the long-term relationship among the variables in terms of CO2 which is consistent with this paper’s findings. In this context, researchers have suggested increasing the level of education and studies, collecting taxes, increasing research funds and R&D investments as a solution. It is obvious that this problem can be solved by adhering to the green deal action plan in Türkiye as well [52-53].
Results and Discussion
In conclusion, all empirical evidence including ARDL, FMOLS, DOLS, CCR, Phillips-Ouliaris, Engle-Granger co-integration tests prove a long-term relationship between trucking, economic growth, trade openness and CO2 emissions from 1985 to 2021 in Türkiye. Considering the results obtained from the impulse-response and variance decomposition analyzes, it is seen that trade openness cause more carbon emissions compared to truck transportation and economic growth. Moreover, the results of impulse-response and variance decomposition tests are consistent with the findings of multivariate regression analysis. The increase in the number of technological products that can come through the widening of trade openness will contribute to the country’s energy efficiency policies by encouraging lower cost energy production and use. Thus, carbon emissions will naturally enter a downward trend. Especially considering the increasing interest in renewable energy production and consumption today, the expansion of commercial connections with countries specializing in this field is likely to reduce the country’s dependence in terms of foreign products such as oil and natural gas. Trade openness is also an important resource for transferring advanced technologies such as energy-efficient products. According to the results obtained, it is seen that there is a feedback effect between the trade openness and CO2 emissions. Trade openness also affects economic growth by encouraging industrialization. Economic growth will also lead to an increase in energy demand. Similarly, insufficient energy supply will hinder economic growth by affecting exports and imports, and as a result, energy consumption will decrease. In this way, the “Green Deal Action Plan” will be a roadmap that is compatible with the transformation policies taking place in the world economy, especially in the EU, that encourages green investments, contributes to the transformation of global value chains, and thus supports value-added production.
Table 10.
Short term ARDL results and error correction model for Türkiye.
Within the scope of the Green Deal Action Plan, the steps should be taken in a wide range of areas such as combating climate change, green finance, EU border carbon regulation, a green and circular economy, clean, economical and safe energy supply, sustainable agriculture, sustainable smart transportation and diplomacy, and the success of the Action Plan, which includes the priority actions to be implemented, will be possible through effective cooperation and mutual information activities among all relevant institutions and organizations, the private sector and other relevant stakeholders, and the active participation of all stakeholders in the process.
On the other hand, although according to results of this work, trade openness is the independent variable that most affects carbon emissions, another priority area in transportation is the reduction of emissions in road transportation, which has the largest share in greenhouse gas emissions. The steps to be taken at the global level in this field will accelerate the spread of hybrid and electric vehicles all over the world. The market share of electric vehicles is increasing day by day with the widespread use of electric vehicle technologies in recent years and many countries in the world turning to this new technology. With the interest in electric vehicles, it is observed that battery systems compatible with vehicles, engine systems, especially charging station systems have been developed, thus new market areas have emerged. Establishing the necessary infrastructure to achieve this transition is of great importance, and for this purpose, strategy development and planning activities for the development of electric vehicle and charging infrastructure should be aimed to be carried out to reduce carbon emissions. One of the areas that affects both climate change and air quality is transportation. Although fewer emissions are produced with constantly developing vehicle and engine technologies, the increase in the number of vehicles cannot make this decrease visible. In this respect, the transition to electrification in transportation seen in the world is also followed closely in Türkiye, and work should be continued rapidly on the transition of vehicles used for logistics and agricultural purposes to electric, as well as domestic passenger vehicles such as TOGG.
Conclusion
The results of the study, prove a long-term relationship between trucking, economic growth, trade openness and CO2 emissions from 1985 to 2021 in Türkiye. Considering the results obtained from the impulse-response and variance decomposition analyzes, it is seen that trade openness cause more carbon emissions compared to truck transportation and economic growth. Moreover, the results of impulse-response and variance decomposition tests are consistent with the findings of multivariate regression analysis.
In order to increase the environmental quality in Türkiye, primarily environmental awareness should be developed. It is important to revise trade, finance and growth policies. In order to protect environmental quality, the policy makers should act in accordance with sustainable development goals and guide policies in this way. The use of renewable resources such as natural gas, solar and wind energy should be preferred instead of fossil fuels such as coal and oil, which cause CO2 emissions. In order to reduce CO2 emissions, new methods should be developed and implemented in the field of industry. Thus, the green deal action plan can achieve the stated objectives.
The Turkish government’s planned actions include studying the effects on energy-intensive and resource-intensive sectors. In addition, it is aimed to determine the country’s road map or activities that include the steps to be taken by relevant institutions and organizations and non-governmental organizations in order to support the reduction of greenhouse gas emissions in priority manufacturing industry sectors that may be subject to border carbon regulation. On the other hand, one of the tools used by countries to reduce their greenhouse gas emissions is the implementation of an effective carbon pricing mechanism. In line with the targets raised in the fight against climate change in the world, an increasing number of countries are implementing national carbon pricing mechanisms. There are currently 61 national carbon pricing mechanisms implemented or planned to be implemented in the world, 31 of which are emission trading systems and 30 of which are carbon taxes. In addition, it is important to carry out studies on certification and reporting in Türkiye within the framework of the methodology to be determined by the EU, especially in order to eliminate additional bureaucratic and financial obstacles that businesses may encounter in the face of a possible border carbon regulation of the EU, and to develop the monitoring system of greenhouse gas emissions from industry. Besides, the actions to be implemented under the “Green and Circular Economy” title of the Action Plan will also support the reduction of greenhouse gas emissions in relevant sectors.
It is necessary to have a retainable environmental policy in order to ensure sustainable economic development. In this context, there is great benefit in Türkiye by implementing policies to reduce environmental pollution. In particular, it is necessary to reduce fossil fuel consumption in energy consumption, to focus on sectors which will pollute the environment less when carrying out bilateral trade relations, and to implement financial policies that are effective in terms of environmental quality. On the other hand, this study could only be tested for a short period in terms of the green deal action plan due to regional data constraintments. If this manuscript is considered in terms of research directions, when a sufficient data set is available for comprehensive empirical studies, it can be conducted that examine both periodic differences, reveal regional differences and test the green deal action plan in the future works.

