

Introduction
Food security is the cornerstone of the sustainable development of a country, and ensuring sufficient arable land is crucial for achieving this. However, owing to socio-economic development since the 1990s, the proportion of grain cultivation has decreased. In contrast, the number of cultivation areas for fruits, vegetables, and other economic crops has increased, indicating a substantial shift in the acreage and distribution of grain cultivation. In 2022, it was proposed that fertile farmland be dedicated to grain cultivation, as stated in the “Various economic crops shall not compete with grain for land” policy, to further ensure national food security. Therefore, optimizing the grain planting structure based on accurate knowledge of regional grain cultivation areas and distribution patterns is necessary. Stabilizing grain cultivation according to local conditions to form advantageous planting belts or planting areas will help enhance grain productivity and increase farmers’ income.
Traditionally, statistical surveys of cultivated land areas and their distribution have used administrative divisions as units requiring substantial human, material, and financial resources. These statistics are easily influenced by anthropogenic factors, have slow updates, and fail to reflect spatial heterogeneity within an administrative division. In contrast, remote sensing offers advantages such as large coverage, objectivity, timeliness, real-time dynamics, high efficiency, and labor-saving capabilities. As a result, it can provide timely information related to farmland and agriculture for management departments and has been widely utilized in agricultural production management. Significant progress has been made in crop classification, growth monitoring, yield estimation, and disaster assessment. Using remote sensing to quickly and accurately grasp spatial distribution information for grain can provide valuable data for decision-making processes, such as adjustments in agricultural planting structures, precision fertilization, the selection of agrarian production modes and farming methods, and the layout and upgrading of agricultural infrastructure. Such decision-making is essential in social and economic development and ensuring food security [1].
Crop identification serves as the foundation for identifying the spatial distribution of crops. The three primary types of data sources applied in crop identification are Synthetic Aperture Radar (SAR), Synthetic Aperture Radar (SAR) fused with optical data, and optical remote sensing data [2, 3]. SAR is not affected by meteorological factors such as clouds and rain and can recognize structural features on the crop surface; however, it is time-consuming and costly, thereby limiting its application in research. Current crop classification and extraction remain primarily based on optical satellites [4]. With the development and application of remote sensing information technology, the accuracy of crop classification and extraction has improved; hence, the application of multi-source multi-temporal remote sensing data and time series remote sensing data has become popular in research. The spatial recognition methods applied in winter wheat and summer corn include the following three categories: first is to select suitable spectral features or vegetation indices combined with machine learning models for classification and extraction. For example, Junior et al. utilized data mining techniques and artificial neural networks to classify maize and soybean with similar phenology [5], while Liu et al. used random forests to extract the spatial distribution of soybeans and corn [6]. Second, time series curves are constructed and combined with a priori phenological knowledge to recognize the phenological curves of classified objects, while similarity judgment is performed to extract target crops [7-8]. For example, Dong et al. used Sentinel2A/B data to fit the standardized characteristic curve of winter wheat and extracted wheat planting areas in three different latitudinal regions using the phenology-time-weighted dynamic distance to determine the thresholds [9]. Guan et al. and Belgiu et al. utilized the dynamic temporal distance similarity for crop classification [10, 11], while Li et al. improved the fit of winter wheat remote sensing monitoring area to statistical data and strengthened the application effect by constructing a new similarity metric and optimizing the threshold value [12]. Third, new indicators were constructed through key phenological periods. For example, Tao et al. extracted winter wheat using the differences in EVI of sowing and tillering stages in the pre-wintering period of winter wheat [13], while Qiu et al. constructed a difference index by the vegetation difference before and after winter wheat tasseling [14]. Qu et al. constructed a wheat extraction index using the Landsat NDVI of the four key climatic periods in wheat [15], introduced the factor of climatic keypoints in the similarity metric, and constructed a composite index of curve similarity and keypoint similarity [16]. Since vegetation indices are closely related to phenology, indices such as the Normalized Differential Vegetation Index (NDVI) [17, 18], Enhanced Vegetation Index (EVI) [19], and Leaf Area Index [20] have been successfully applied in the extraction and analysis of vegetation phenology. Most studies combine time-series data and phenology analysis in their research methodology. High time resolution is required when using time-series data to extract phenological curves for crop growth. Currently, data sources used for time-series construction mainly include Moderate Resolution Imaging Spectroradiometer (MODIS) data, Sentinel and Landsat satellite data provided by the American Earth Observing System, environmental satellites, and high-resolution data from the Chinese Earth Observing System. MODIS data, captured by the MODIS sensor installed on the Terra and Aqua satellites, offer time resolutions of 1-2 days but have a maximum spatial resolution of 250 m, which limits their application in small- and medium-scale areas [21]. The launch and use of the Sentinel and Landsat satellites, Chinese environmental satellites, and high-resolution coefficient satellites have significantly improved the spatial and temporal resolutions of remote sensing data. Many researchers have attempted to use these high-resolution image data for grain classification and spatial extraction [9, 22-24]. However, the data used for extracting grains’ phenological curves are not guaranteed to be unaffected by weather conditions such as clouds, fog, and rain, which can result in poor applicability. In some studies, MODIS data have been combined with mixed pixel decomposition for grain identification at the county level [25], but the mixed pixel decomposition technique requires further exploration. Previous studies have also combined MODIS with data, such as Sentinel-2\Landsat, to realize crop classification and extraction in small-scale areas [26-27]. To address the above challenges, this study combined the high temporal resolution of MODIS with the high spatial resolution of Sentinel-2 to improve the accuracy of spatial identification of grain crop cropping structures in small watersheds.
Several studies currently focus on extracting large-scale crop areas, such as wheat, corn, and rice, using the multiple crop index for regional divisions. Most previous studies on crop rotation are based on the regional division of the replanting index [28, 29] or judged in conjunction with the replanting index [30, 31]. However, fewer studies are available for the extraction of wheat–corn rotation areas. Yuncheng City in Shanxi Province, a primary region for high-quality wheat production, primarily employs winter wheat and summer corn rotations for its grain cultivation systems. In recent years, with the acceleration of socioeconomic development and urbanization, the decrease in arable land and adjustments to planting structures have significantly reduced the planting areas used for wheat-corn rotation. To ensure that farmland remains fertile and grain cultivation and yields are maintained, monitoring the spatial distribution of regional wheat and corn planting is crucial for guaranteeing the supply of high-quality grain. Accurate and efficient acquisition of wheat and corn acreage and spatial distribution, combined with growth monitoring, disaster assessments, and yield estimations, is essential for further improving production and optimizing farmland ecology while ensuring food security.
The goal of this paper is to improve the accuracy of grain cultivation extraction at a small watershed scale applying high temporal resolution data and high spatial resolution images. The key is to use MODIS to identify key phenological periods and use Sentinel-2 for key period threshold determination and spatial extraction.
Data and Processing
Research Area
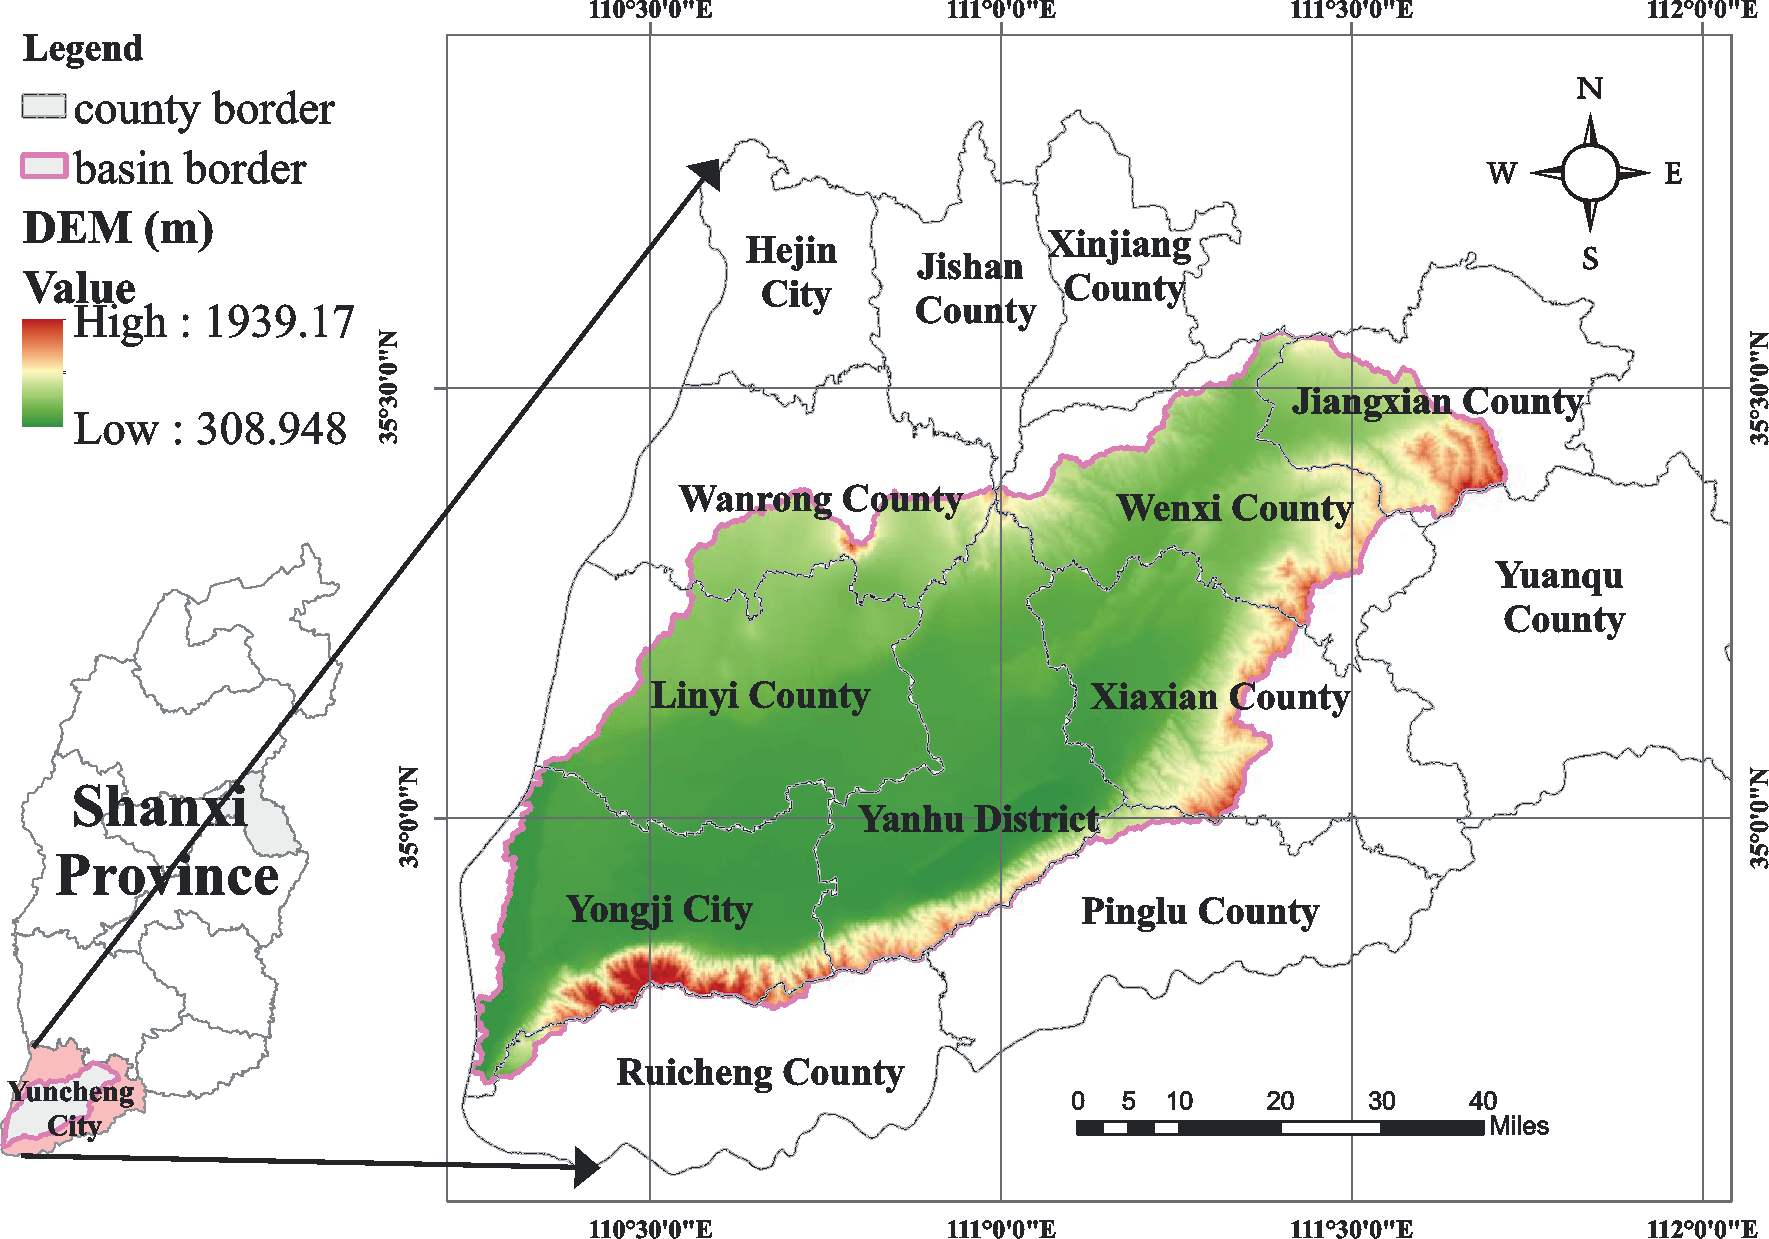
The Sushui River Basin, located east of the middle reaches of the Yellow River Basin, in the Yuncheng Basin, southern Shanxi Province, China (Fig. 1). It covers a total area of 5,774 km², with 57% of it being arable land. This region is an important food production area in Shanxi Province. The basin experiences a temperate semi-arid continental monsoon climate, with an average annual rainfall of 563 mm, an average temperature of 13.6ºC, and a frost-free period of 207 days. Generally, winter wheat is planted in mid-October of the previous year and harvested in early June of the following year after going through the tillering, overwintering, jointing, and heading stages. Summer corn is planted immediately after the wheat harvest in early June, and after a growing period of 100-120 days, it is harvested in early October. Two peak growth periods, one for wheat and the other for corn, occur during the entire crop rotation period.
Remote Sensing Data
MODIS data was used to construct time-series curves, utilizing the 16-day synthetic NDVI data from MOD13Q1 (version 6) provided by the National Aeronautics and Space Administration. The time phases were 145 days (6 months) in 2020 and 289 days (10 months) in 2021 (https://doi.org/10.5067/ MODIS/MOD13Q1.006). Data clipping and coordinate conversion to WGS 1984 were performed using the United States Geological Survey’s MODIS Reprojection Tool.
Sentinel-2 data were selected based on the study requirements. Four image sets with less than 8% cloud cover within Yuncheng city limits were chosen for the critical sowing and growth periods of wheat and corn: June 25 and August 28, 2019, and October 17-24 and December 17, 2020. All data were obtained from the PIE-Engine Remote Sensing Computing Cloud Service Platform (https://engine.piesat.cn/engine-studio/). NDVI images from different periods were processed using PIE-Basic for waveband processing.
Sample Point Data
The sample points used in this study primarily consisted of 250-m pure pixel high-definition points and ground sample points. The pure pixel sample points were obtained by overlaying a 250-m grid and Sentinel-2 images, which included 75 arable land areas, 20 orchards, 20 forests, 10 watersheds, and 15 construction land areas. These were mainly used to extract time-series curves of major land cover types in the study area, enabling the analysis of phenological characteristics and differences between winter wheat and summer corn rotation lands and other cover types.
From March to June 2022, 39 ground sample points were collected for accuracy verification. This included 23 winter wheat and summer corn rotation points and 16 other types. The samples were collected by visiting farmers and observing the fields in person.
Other Data
The vector map of the administrative division of Yuncheng City used in this study was obtained from the Bureau of Natural Resources of Yuncheng City, Shanxi Province. The extent of the watershed was obtained using a hydrological analysis tool from the Geospatial Data Cloud website of the Computer Network Information Center of the Chinese Academy of Sciences (www.gscloud.cn) based on Shuttle Radar Topography Mission (SRTM) digital elevation model data with a resolution of 30 m in ArcGIS 10.3.
Methodology
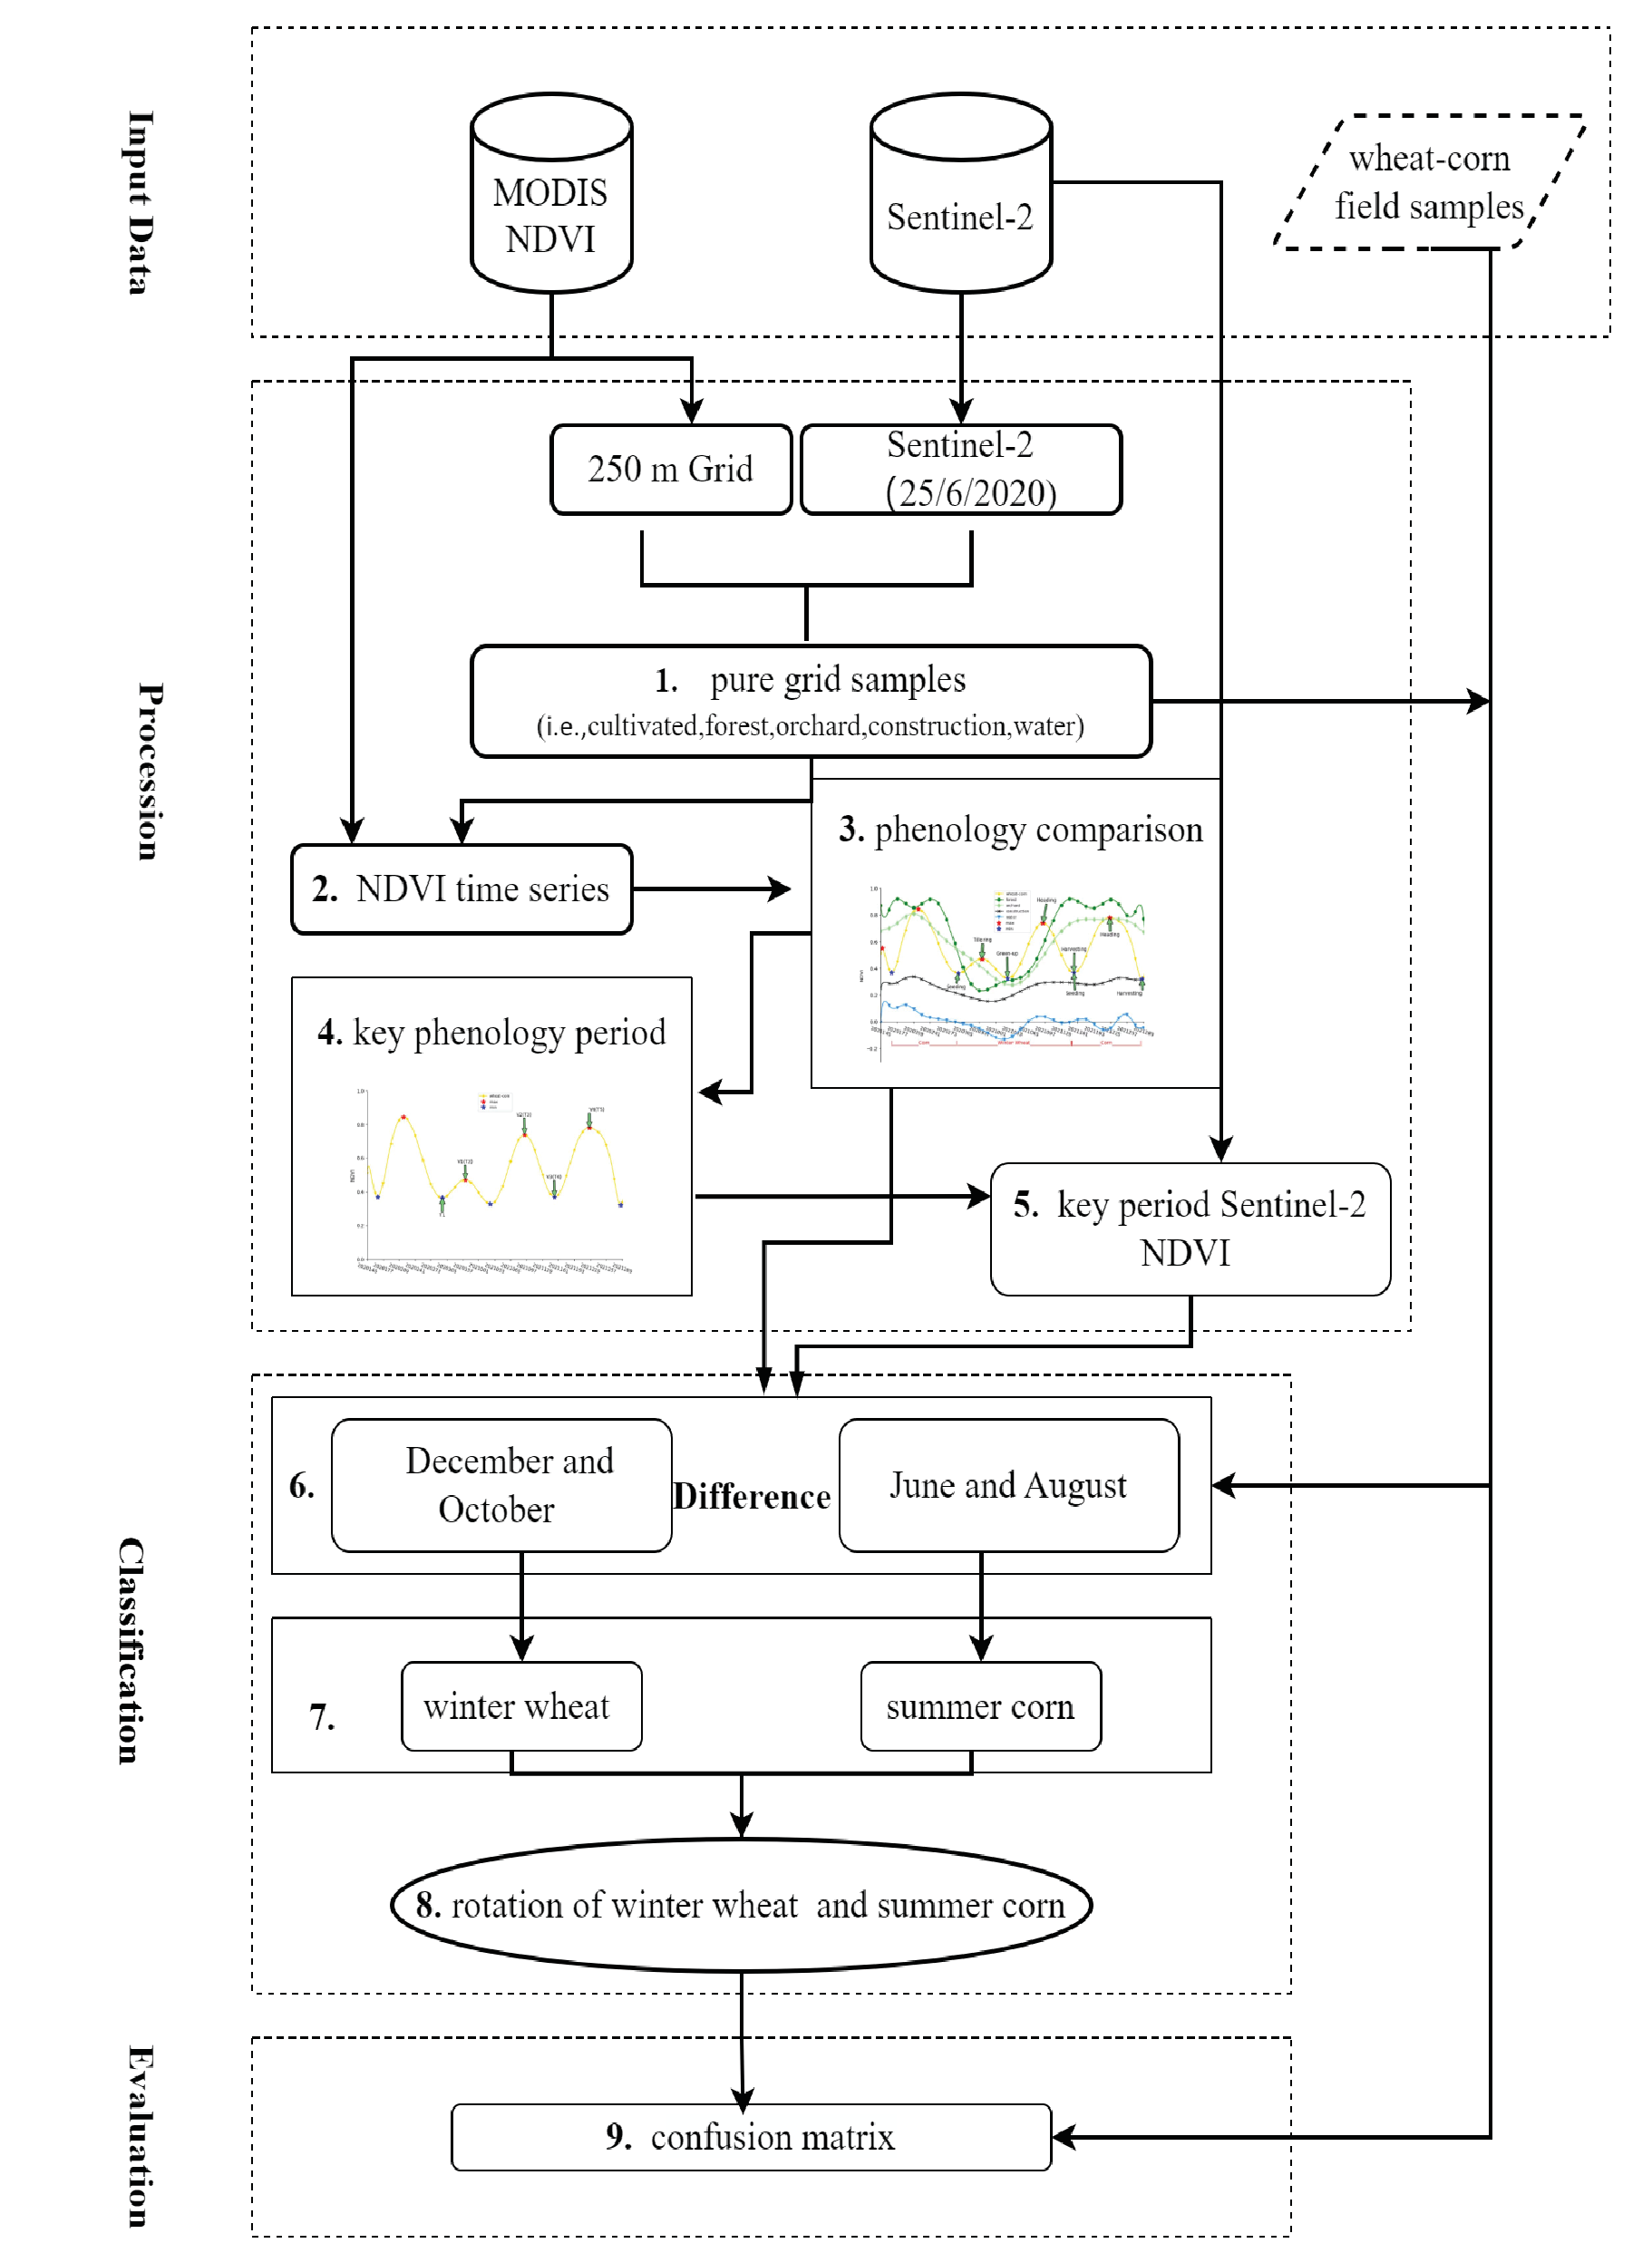
This study consists of three primary steps illustrated in Fig. 2. First, the key phenological stages for the winter wheat and summer corn rotation areas were determined by comparing the phenological differences between the curves of various cover types. This was achieved after finding pure pixels of different land use types in the studied area under MODIS 250-m grid conditions, with which the time-series phenological curves were constructed. Next, the NDVI difference values were calculated using Sentinel-2 images of the key phenological stages, and these difference values were extracted. Moreover, the NDVI difference thresholds for wheat and corn planting areas were calculated using the field sample data. Lastly, the planting areas of winter wheat and summer corn were extracted from the high spatial resolution image by using the established thresholds. The spatial distributions of winter wheat and summer corn rotation lands were determined by intersecting the planting areas for winter wheat and summer corn using ArcGIS10.3.
Determination of Key Phenological Stages
Acquisition of MODIS Pure Pixels
MODIS has a maximum spatial resolution of 250 m. The 250-m MODIS grid was overlaid on the high-resolution Sentinel-2 images for June 2020 using an adapted method from Zhang et al. [13]. The pure pixel points of the main coverage types were selected . Pure pixels indicate that only one cover type exists within the pixel range, which enables the accurate extraction of the phenology curves of different cover types in the next step. The image in Fig. 3 is of the Sentinel-2 type and is taken from the PIE-Engine Remote Sensing Computing Cloud Service Platform.
Construction of Time-Series Curves and Reference Curves
NDVI is a widely used indicator in vegetation phenology research as it can effectively reflect crop growth patterns. For this study, synthetic MODIS data was selected for a 16-day interval during the growth cycle of winter wheat and summer corn, spanning from late May 2020 to mid-October 2021. NDVI values were used to construct time-series curves of pure pixel points for different land cover types, including arable lands, forests, orchards, construction lands, and water areas. Savitzky-Golay [14, 15] filtering was applied to remove noise, and anomalous curves were removed by considering the phenological laws of vegetation changes in each land cover type in the study area.
The shortest Euclidean distance (Eq. 1) was adopted to determine the reference curves for each land cover type. Considering the phenological laws of winter wheat and summer corn, the curves for cultivated lands that conformed to these laws were selected as the basis for selecting reference curves before the reference curves of winter wheat and summer corn were determined.
where D (X,Y) represents the distance between any two curves X and Y in a cover type and Xi and Yi are the corresponding NDVI values on the two curves at time point i.
All the operations described above were performed using Python3.7.0.
Key Phenological Stage Difference Indicators and Thresholds
Using the phenological reference curve of winter wheat and summer corn rotation lands (Fig. 3), the max–min judgment method (Eq. 2) [4] was employed to identify the corresponding peak and valley phenological stages. By comparing the NDVI phenological values of winter wheat and summer corn rotation lands with those of woodland, orchards, build-up lands, and water areas, significant differences in the phenological stages of the growth cycle of winter wheat and summer corn were observed, as compared to those of other land cover types. Based on this analysis, difference indicators for the key phenological stages were determined.
(2)
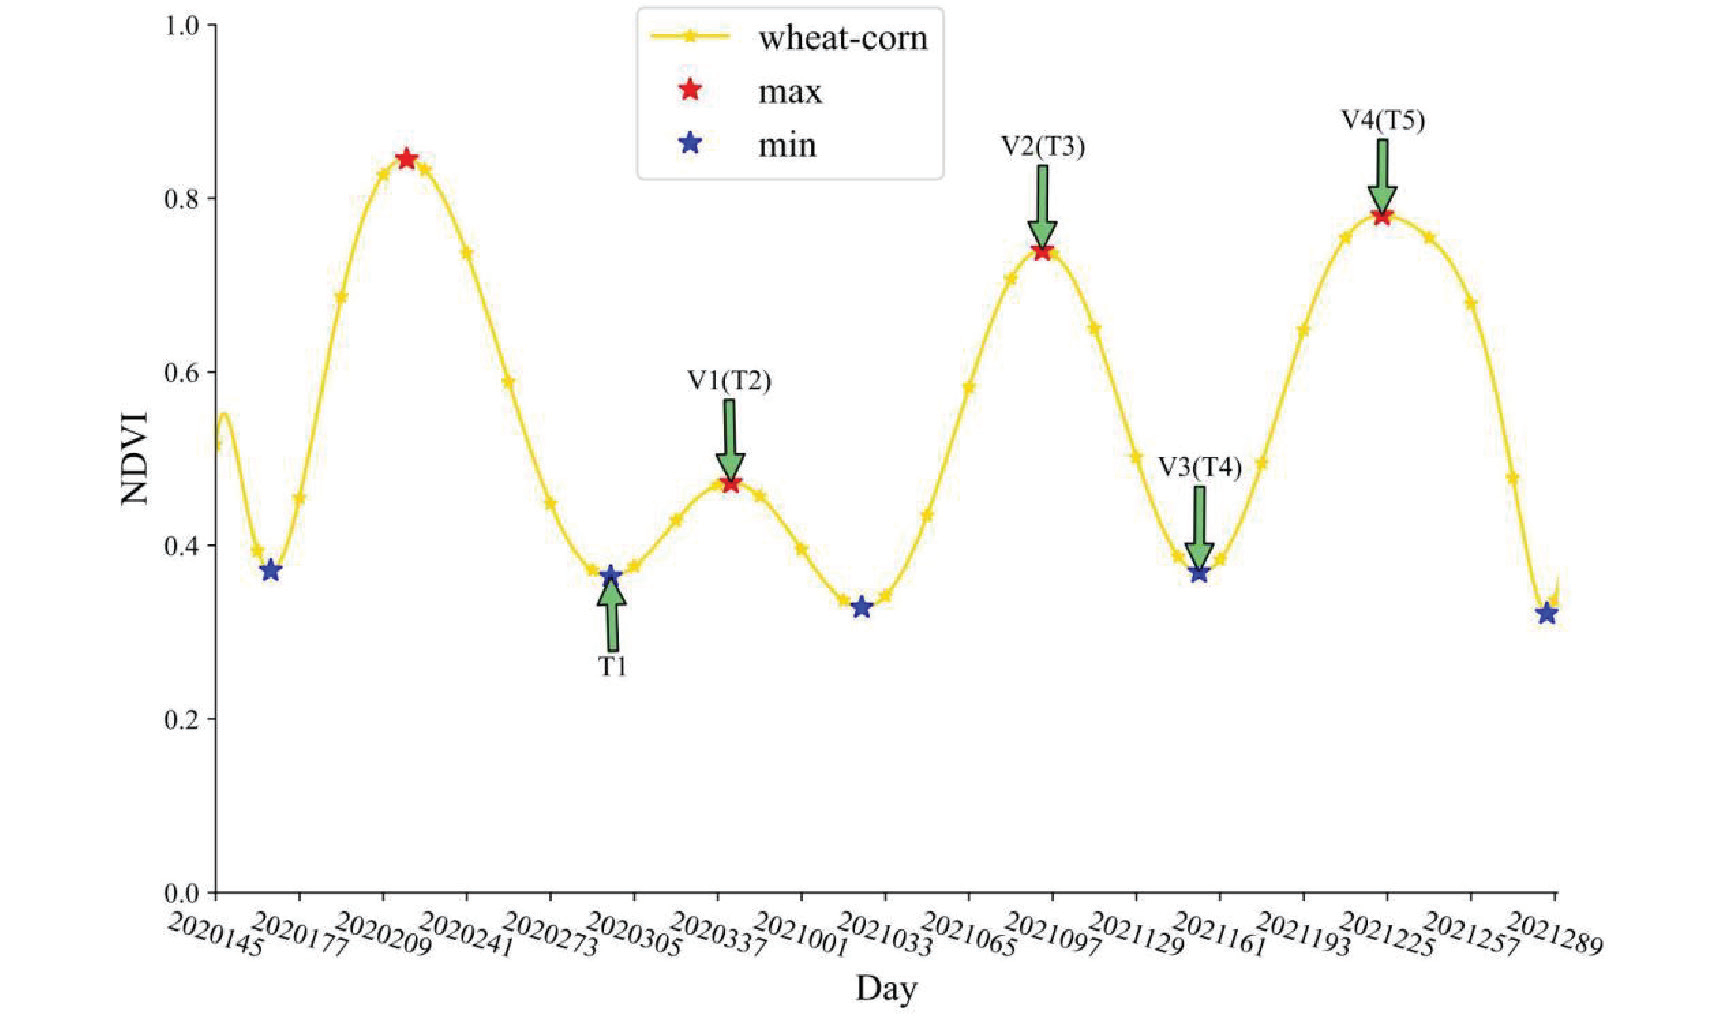
where NDVITi is the time corresponding to the key phenological stage, and NDVIi is the NDVI value for each period beginning from Day 289 in 2020 to Day 289 in 2021 in order of 1, 2, 3, ..., 24.
To obtain NDVI images of each phenological stage, the Sentinel-2 images of key phenological stages were processed using the banding algorithm tool (Eq. 3) in PIE-Basic remote sensing image processing software. The NDVI difference values for the key phenological stages of winter wheat and summer corn rotation lands were extracted from the pure pixel points after calculating the differences in NDVI for the corresponding indices of the phenological stages using geographic algebra in ArcGIS.
where NDVI is the normalized differential vegetation index and ρNIR and ρR represent the wavelengths of near-infrared waves and red light, respectively.
Extraction of Winter Wheat and Summer Corn Rotation Land
The extraction of winter wheat-summer corn rotation field is mainly through the following steps:
1. Key phenological period NDVI differences for wheat and corn were computed using map algebra in ArcGIS 10.3.
2. Difference values of NDVI for key phenological periods were extracted using pure image pixel points.
3. Extraction thresholds were established for winter wheat and summer corn.
4. The reclassification tool was employed to extract winter wheat and summer corn planting areas based on the difference index thresholds for key phenological periods.
5. Using reclassification and map algebra operations, the areas of winter wheat-summer corn rotation planting were determined.
The determination of threshold value is key to crop extraction. Herein, the Monte Carlo cross-validation method [15] was used to obtain the extraction thresholds of winter wheat and summer corn. Monte-Carlo cross validation (MCCV) determines the thresholds by randomly and repeatedly selecting samples and testing and selecting the value corresponding to the highest test precision as the best threshold [34]. In this study, we first classified the pure image points into two categories of wheat-corn rotation points and non-wheat-corn rotation points according to the characteristic curve law, then determined the classification thresholds of winter wheat, summer corn, and other sample points using MCCV.
Reasonable Assessment
The reasonable assessment consists of two parts: one is the separability test of categorical indicators. The Box plot and Spectral Difference Index (SDI) was used to determine whether the NDVI difference values of the wheat and corn sample sites in the key seasonal period were considerably separated from the NDVI difference values of the corresponding periods of the other land categories (i.e., water, forest, fruit trees, and construction land). The Box plot [15] uses five values such as maximum, minimum, interquartile range, median, and mean to compare the differences between different objects of the same indicator. The SDI [15] is a measure of variability using the ratio of the absolute value of the difference between the means of two types of data to the sum of the variances; SDI < 1 indicates that the difference is not significant, 1≤SDI<3 indicates that the difference is relatively easy to distinguish, and SDI≥3 indicates that the difference is significant. The other part is to use field sample points to test the accuracy. Field sample points were obtained through field survey combined with villagers’ interviews in 2022. A total of 39 validation points for points in long-term wheat-corn rotation and other cropping systems from 2017 to 2022 were validated using the confusion matrix in ENVI5.3.
Table 1.
Spectral discrimination index (SDI) between winter wheat, summer corn and other land use types.
Results
Analysis of Key Phenological Stages in Winter Wheat and Summer Corn Rotation Lands
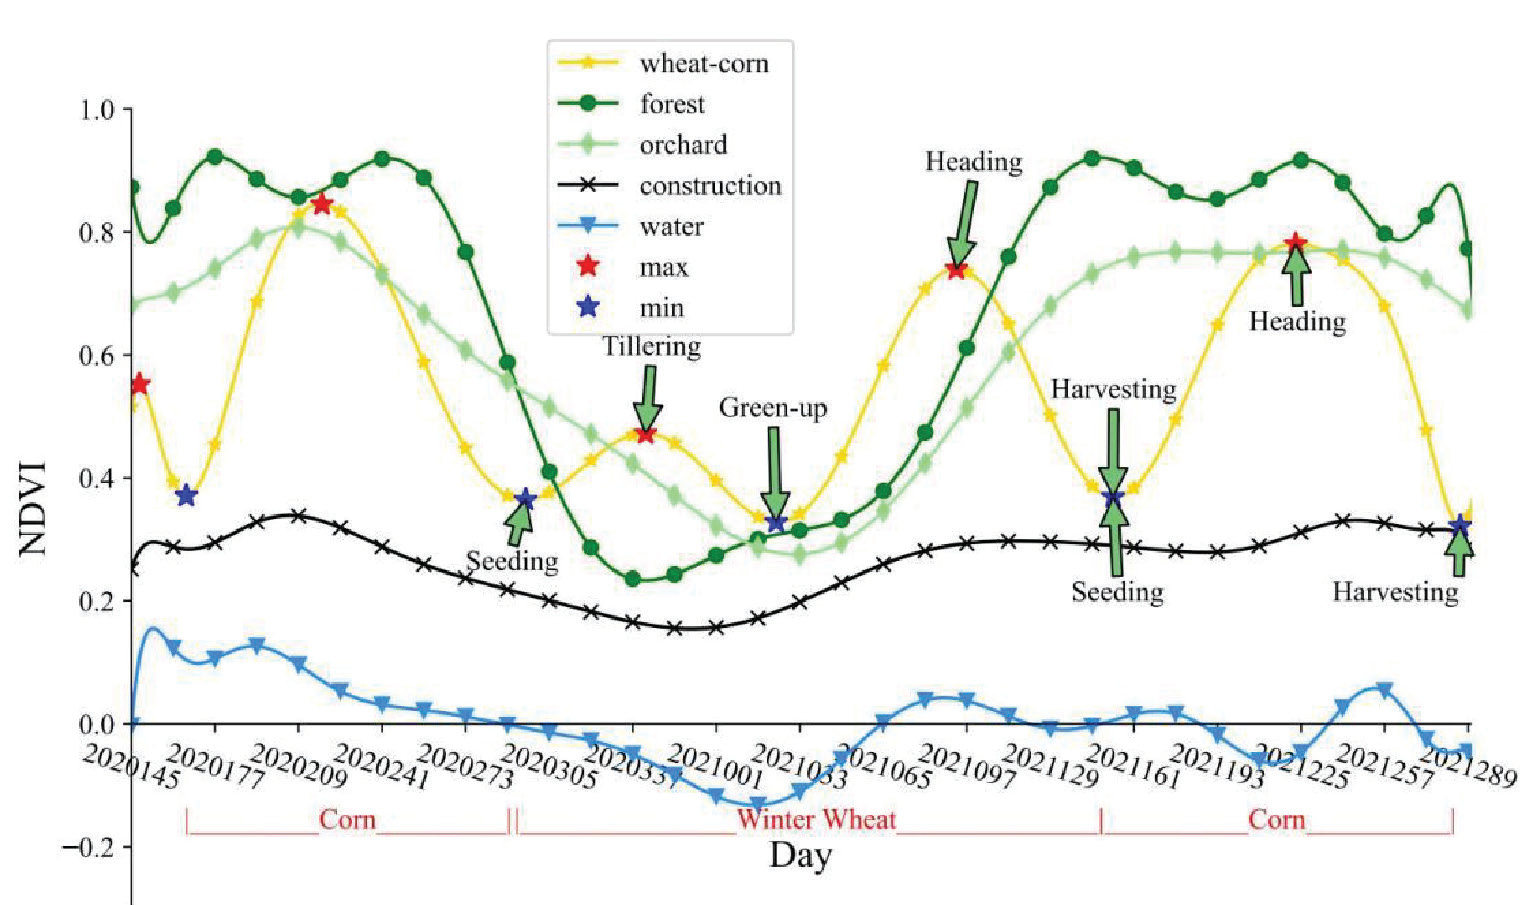
Fig. 4 shows that the vegetation index patterns of different cover types exhibited different change characteristics over time. Buildings dominated construction lands, although a small amount of green vegetation was present; therefore, they showed only small fluctuations within a year, with all values being less than 0.4. In contrast, the watershed NDVI values fluctuated from –0.2 to 0.2. The fluctuation directions of orchards and forests were the same, although the rate of the greening of orchards was lower than that of forests. The highest values of forests were all higher than those of orchards, whereas the duration of high values of forests was longer than that of orchards.
A small number of herbs were mainly distributed in the dry areas of mountainous hills. Because of the scattered distribution, pure pixel data at 250 m were not collected; however, in the extraction of Sentinel-2 images with a spatial resolution of 10 m, the winter wheat and summer corn rotation lands were affected. After the field survey, we found that the study area was mostly planted with Astragalus sp., Polygala tenuifolia, Radix bupleuri, and Rehmannia glutinosa perennial vegetation, and their intra-annual variation patterns were similar to those of forests.
Winter wheat and summer corn had three wave peaks during their intra-annual rotation. Winter wheat had a small wave peak during the seedling emergence and tillering stages after sowing. Wheat and corn both reached wave peaks at the heading stage and had apparent wave valleys at the harvesting stage, a noticeable feature distinguishing winter wheat and summer corn rotation lands from other cover types.
Analysis of Key Phenological Difference Indicators in Winter Wheat and Summer Corn Rotation Lands
The MODIS pure pixel NDVI time-series curves showed that the NDVI value of the wheat and corn harvesting period (valley) coincided with that of the construction lands. The peak of wheat tillering coincided with the decreasing NDVI of orchards and forests in the withering stage. In contrast, the value of wheat at the heading stage (valley) coincided with the NDVI values of orchards and forests during the rising stage. The value of corn at the tasseling stage (valley) might coincide with the NDVI values of orchards and forests. Therefore, the NDVI or peak and valley values at a certain stage cannot be used alone as a distinguishing feature index. The peak valley phenological characteristics of winter wheat and summer corn rotation lands should be used together for identification. Previous studies used timeseries curves to simultaneously identify peak and valley characteristics [30]. By comparison, it was found that only the NDVI of wheat land showed an increasing trend from wheat planting to seedling emergence, while the NDVI of orchards, forests, construction lands, and water areas showed a decreasing trend. Thus, the NDVI difference between the peak of wheat tillering and the valley of planting could be used as a distinguishing indicator for identifying wheat planting areas. From the wheat seedling establishment (valley) to heading (peak), orchards and forests also turned green and grew, and the rising trend of wheat lands, orchards, and forests at this stage was the same, making it difficult to distinguish between them. Between wheat heading (peak) and harvesting (valley), the NDVI values of wheat lands showed a decreasing trend, while those of orchards and forests continued to rise and maintain high values and those of construction lands and water areas remained stable. This can also be used as an important indicator for wheat identification. Between corn planting (valley) and tasseling (peak), the NDVI showed an increasing trend, while the NDVI values of orchards, forests, construction lands, and watersheds remained stable. Therefore, this peak-valley difference can be a key indicator for corn identification.
This study’s crop rotation lands were extracted separately using multi-temporal remote sensing data. Wheat planting (valley) and tillering (peak) difference indicators, as well as corn planting (valley) and tasseling (peak) difference indicators, were used simultaneously as important indicators for identifying wheat and corn areas, respectively. Based on the reference curves for winter wheat and summer corn rotation lands and the time-series data of pure pixel points, the sowing stage of winter wheat in the Sushui River Basin occurred on Days 289-305 (in late October), the tillering stage occurred on Days 337-353 (in mid-December), the harvesting of winter wheat and sowing of summer corn occurred on Day 161 (mid-June), and the tasseling stage of summer corn occurred on Day 225 (in mid-August). Overall, phenological differences in the Sushui River Basin occurred within a week.
Spatial Extraction Thresholds for Winter Wheat and Summer Corn
According to the MCCV rules, 30% of the pure image element points identified in 2.3 were randomly selected as sample points for threshold determination as previously described [15]. Of these, 75% were training samples and 25% were validation samples. To reduce the possibility of not being randomly selected, the number of iterations was set to 100. The final extraction threshold for wheat was 0 and the key phenological period difference index greater than 0 was wheat. The extraction threshold for corn fields was 0.38, while those with a key climatic period difference index greater than 0.38 were corn. The process was done using Matlab 2019.
Reasonable Assessment
Separability Assessment
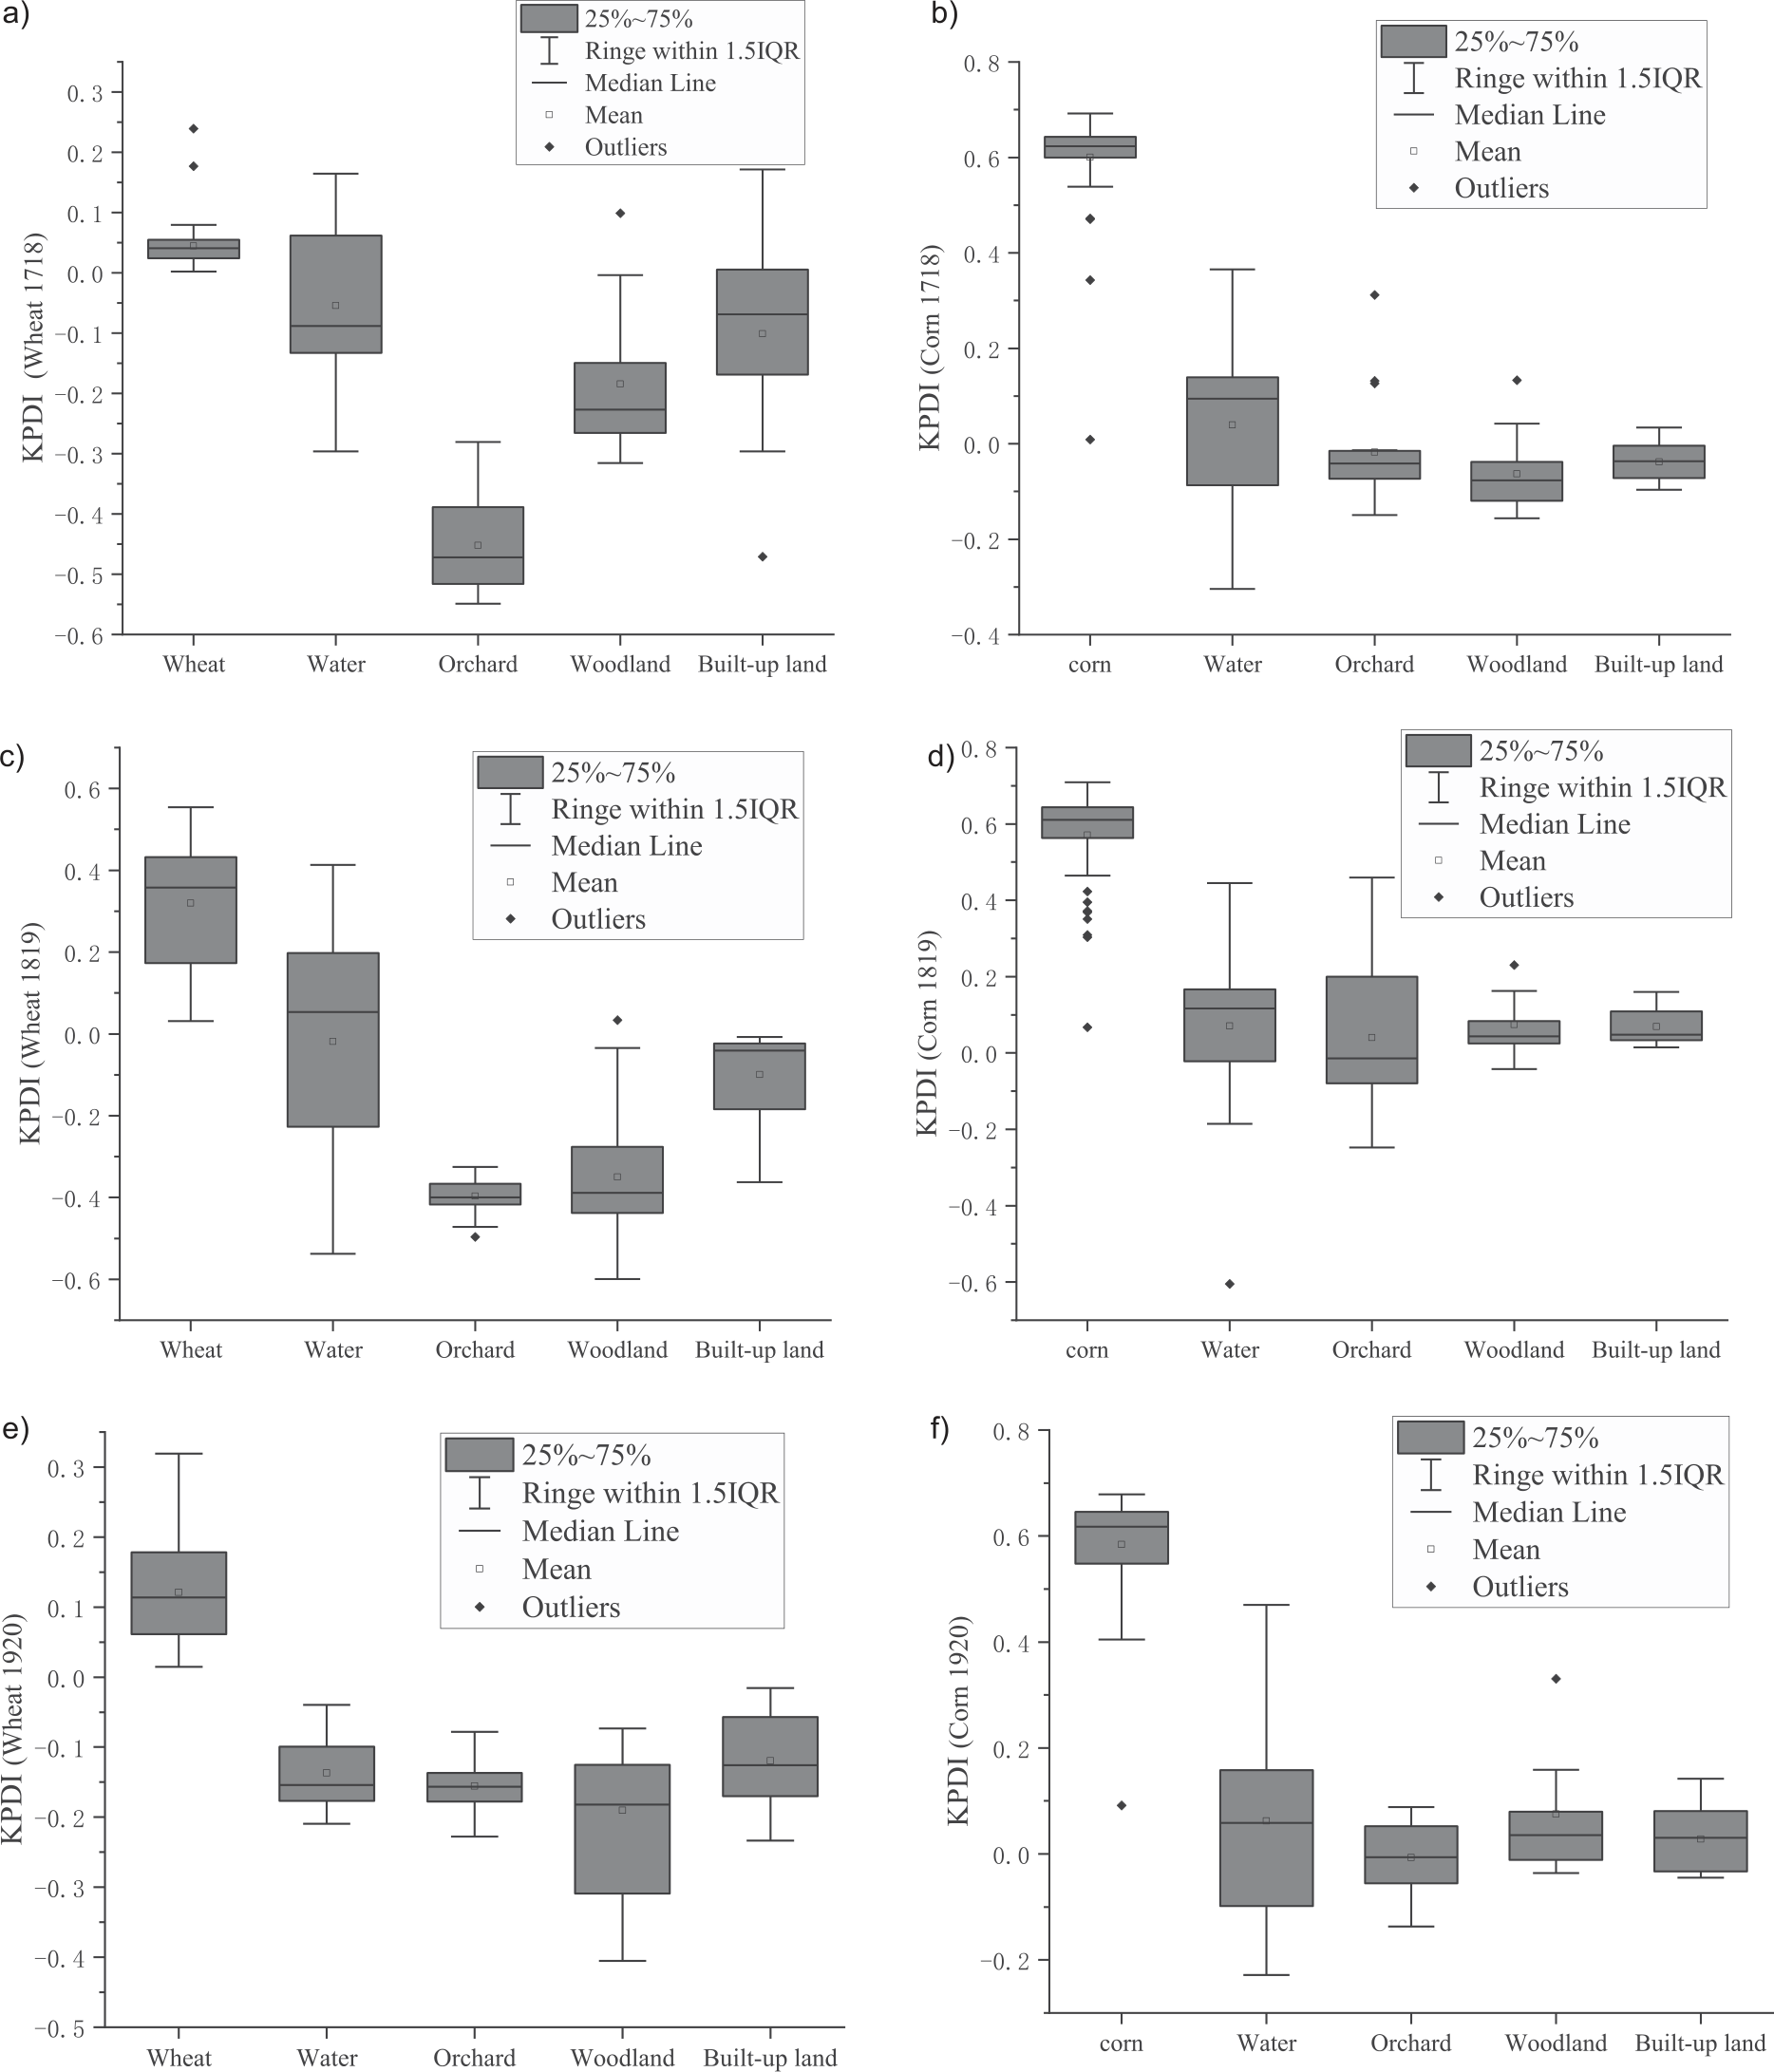
Fig. 5(a, c, and e) shows that the key climatic difference indices of winter wheat were very well separated from orchards and forests. During 2017-2018 (Fig. 5a), although the median and mean values of winter wheat were much higher than those of waters and built-up land, it overlapped with the whisker line of built-up land and the IQR of waters. Therefore, the separation was not very well. During 2018-2019 (Fig. 5c), except for a small overlap with waters at the whisker line, a large difference with other land use types was observed with better separation effect. During 2019 (Fig. 5e), the wheat had a large difference with other land use types with better separation effect, while during 2019-2020, winter wheat had no overlap with other land use types, and the separation effect was very good. The corn key phenological period difference index for the three years showed good separation from other land use types in the median, mean, and interquartile ranges (Fig. 5(b, d, f)), indicating that the use of this index to categorize corn can be achieved in the Sushui River Basin with good results.
The results of the analysis of the SDI were consistent with the line box plot. The key phenological difference index (KPDI) for wheat had a spectral separation index with watersheds and built-up land in 2017-2018 of <1. This indicates poor separation between these two land use types. The separation with the watershed was poor in 2018-2019. The SDI with other land use types was >1 in all three wheat cropping periods, showing strong separation. Corn had a strong separation effect with other land use types with an SDI>1 in all periods. The Box plot and SDI analysis suggested that the separation effect of the KPDI of wheat would cause some of the vegetation in the waters and built-up land to be mixed; however, corn had a considerable separation effect with other types of soil use. This study referred to the extraction of winter wheat-summer corn rotation land, when the separately extracted wheat and corn land was superimposed for intersection, the waters and construction land that are mixed in were determined, and a better extraction effect could be achieved.
Fig. 5.
Box plots of key climate difference indicators for winter wheat and summer maize versus other land classes (where a, b are for 2017-2018, c, d are for 2018-2019, and e, f are for 2019-2020. a, c, and e are box plots of wheat and other land classes, b, d, and f are box plots of corn and other land classes).
Accuracy Verification
After the confusion matrix verification of the maps and the 39 ground sample points, the user accuracy of the spatial extraction of wheat-corn rotation land was obtained as 95%, 88.89%, and 86.96% for the years 2017-2018, 2018-2019, and 2019-2020, respectively. The corresponding kappa coefficients were 74.24%, 54.47%, and 68.21%, respectively (Table 2).
Discussion
Rationalization of the Selection of Key Phenological Periods and KPDI
In this study, we selected four key phenological periods and constructed two phenological difference indices, i.e., KPDI. After extracting winter wheat and summer corn using the two KPDIs, the winter wheat-summer corn crop rotation was obtained through spatial overlaying. The four key phenological stages were winter wheat planting stage, tillering stage, summer corn planting stage, and tasseling stage. From Fig. 4, it can be seen that the NDVI of wheat is in an increasing state during the time period from sowing to tillering, while the NDVI of the other land classes is in a decreasing state, which is a significant difference. Therefore the identification of wheat utilizes the key climatic differences between wheat sowing and tillering as an indicator.The specificity of NDVI growth from planting to tillering period of winter wheat has been applied in spatial extraction of winter wheat [2, 15-16, 35]. The identification of summer corn mostly uses the combination of spectral features and models [5, 36-37]; also, the phenological features of summer corn growth cycle are utilized [27, 38]. In this study, the planting period and the tasseling period were selected as key periods. Similarly, it can be seen from Fig. 4 that in the wheat harvest season in the rotational land NDVI dropped to the lowest value, while NDVI in the other land classes had risen to a smooth height. At this time of sowing corn to the tasseling stage, the NDVI of corn showed a rapid rising trend, which formed a significant difference from the steady state of other land classes. Both Box plots and SDI indicated that the use of these two key phenological period difference indices to identify summer corn in the Sushui River Basin showed good spectral separation (Fig. 5 and Table 1). Although the KPDI for winter wheat produced a small amount of overlap with water and built-up land in the Box plot and SDI analyses. However, using a combination of the two key phenological difference indices, the waters and construction land mixed with winter wheat were successfully filtered, and the winter wheat-summer corn rotation land was accurately extracted. The combination of the two key climatic period difference indices follows the spatial mapping approach outlined by Amin [39], which involves superimposing summer and winter crops. This approach aligns with the methodology described by Qu et al. [15], which combines two difference indices through multiplication.
Table 2.
Confusion matrix accuracy verification.
The accuracy validation (Table 2) showed that the user accuracy of spatial extraction of winter wheat-summer corn crop rotations for the three years of 2017-2018, 2018-2019, and 2019-2020 utilizing this method reached 95%, 88.89%, and 86.96%, respectively. High-precision (10 m) spatial mapping of crops in small watersheds (small scale) was realized. This shows that the method of utilizing the combination of four key phenological periods and two key phenological difference indices to identify winter wheat-summer corn rotation land has a certain research basis and can achieve a certain degree of accuracy. The selection of the key phenological period difference indexes is reasonable.
Application of the Method
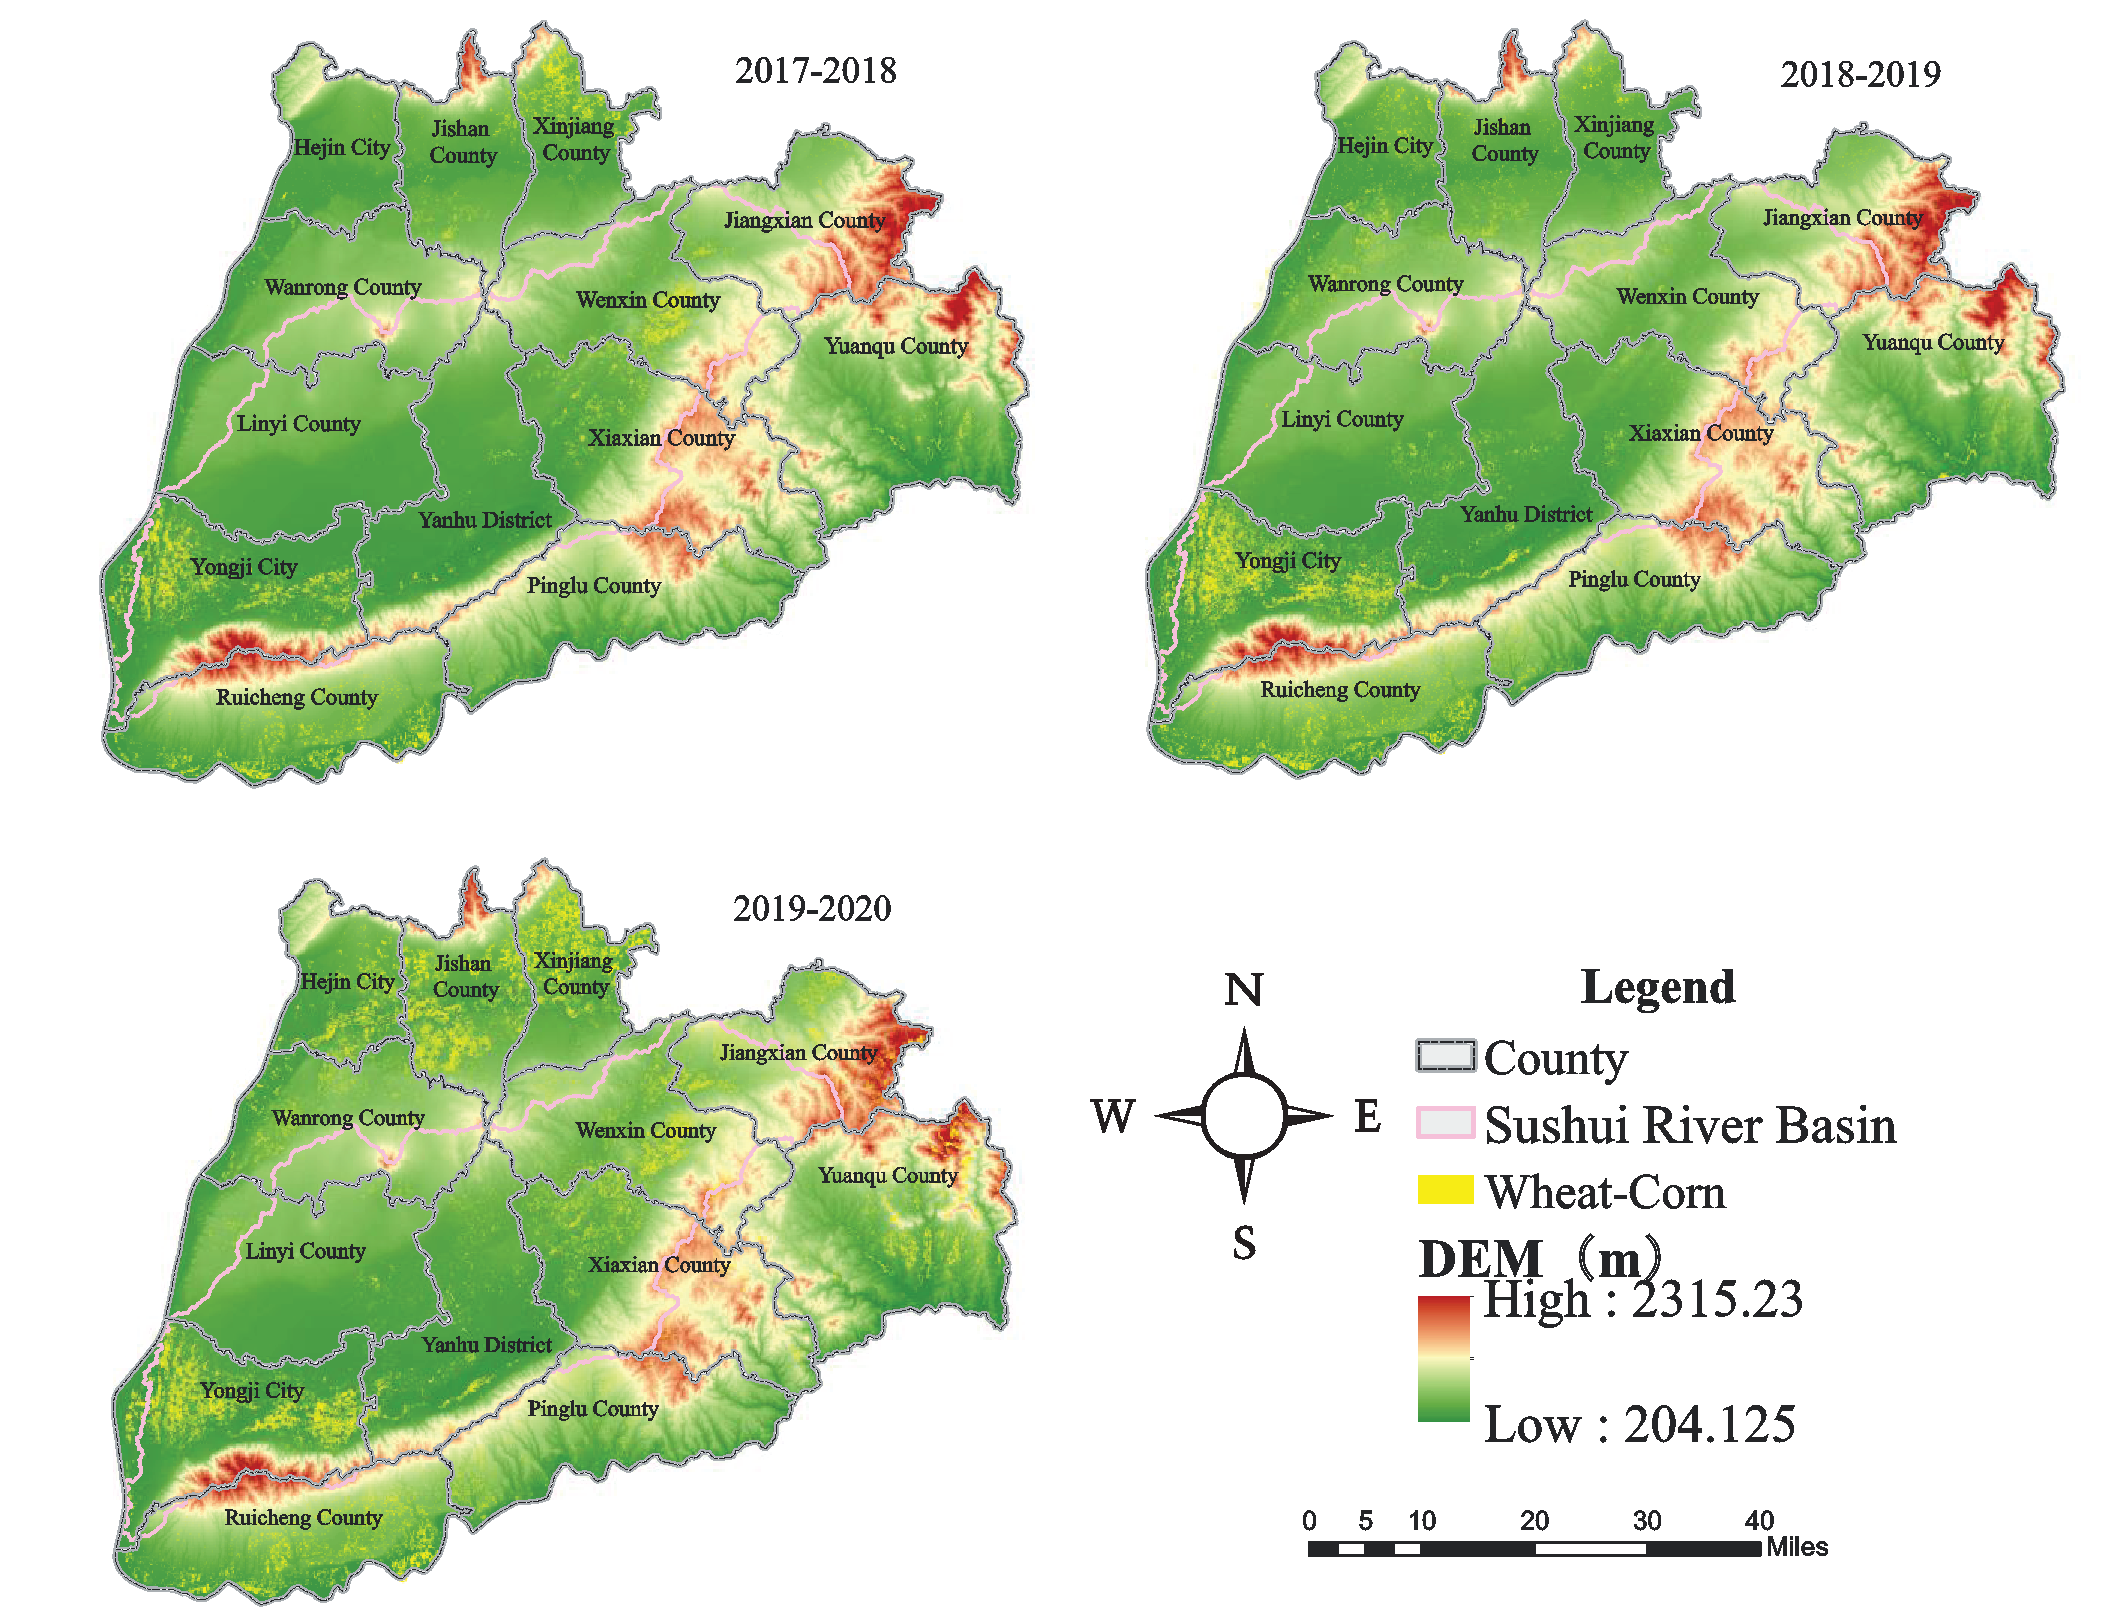
The thresholds of key climatic period difference indices in the study were determined using MCCV; by setting 100 iterations, the identification thresholds of winter wheat and summer maize were obtained as 0 and 0.38, respectively. Applying the thresholds to the years 2017-2018, 2018-2019, and 2019-2020 (Fig.6), better results were achieved (Table 2). This indicates that the key phenological period difference indicators and thresholds can be directly applied in the same region. If the application area is in the same phenological zone as the Sushui River Basin, the threshold recognition can also be directly applied. Qu et al. studied three regions with different latitudes and found that their winter wheat recognition through indicators constructed from four key phenological periods produced large regional differences [15]. Luo et al. used a partitioned study in the establishment of the phenological data of the three major crops in China and achieved a better phenological extraction effect [20]. Therefore, when applied to different phenological zones, thresholds cannot be used directly but must be used in full with the method of this study, based on the determination of phenological curves and key phenological periods. If the range of the application area is large and with large phenological differences, it is necessary to carry out phenological zoning of the study area before using it separately.
Advantages of the Methodology
In this study, we constructed two KPDI using four key phenological periods during the growing period of winter wheat-summer corn, combined the two indices using the overlapping of winter wheat and summer corn after extracting them separately, and finally obtained the rotational land of winter wheat-summer corn. The method has two advantages: first, it considers the overall phenological characteristics of winter wheat-summer corn and the local characteristics of the key phenological period differences, focusing on the application of the local differences. Second, the method is relatively simple and easy to apply. The development of modern agriculture requires the support of remote sensing information, but local agricultural planning and management personnel have limited knowledge of remote sensing and require simple-to-operate methods. Our findings suggest that the accuracy of crop classification and extraction is increasing, but the spatial and temporal fusion of the data concerned [26], the processing and application of aperture radar data [4, 38], all of which require very specialized remote sensing knowledge, and the analysis and processing are relatively complex and require professional training to be applied correctly, which is not conducive to the application of the data in the planning and management of modern agriculture. Compared with Qu et al. [16] who constructed a winter wheat identification index using the multiplication of key phenological period difference indices, the user accuracy of winter wheat-summer corn identification in this study reached a minimum of 86.96%, slightly higher than the user accuracy of 86.03% of Qu et al. for wheat identification in Beijing. The results after calculation using Qu et al.’s F-score [16] showed that, except for 2018-2019, which was 78.05%, the remaining two periods were greater than 85%, slightly lower than the results of Qu et al; therefore, it can be concluded that the theoretical basis of the method is reasonable, simple, and easy to operate, which is conducive to the application in agricultural management.
Shortcomings and Prospects
This method has some limitations. First, the pure image element points recognized by indoor images have certain errors; therefore, field sample points should be collected in the study area by land class, especially land of medicinal herbs and vegetables not involved in this study, to more accurately distinguish and extract the difference thresholds. Second, the extraction accuracy was influenced by the shape and size of the plots; the spatial resolution of the Sentinel-2 image was 10 m, which could recognize the smallest unit with a minimum size of 10 m × 10 m on the ground, but not easily recognize it if the plots were divided in long strips with width below 10 m and the crop cultivation types of the adjacent plots are different. Future studies should analyze the application of this method in higher resolution images. Third, this method is limited by the type of crop cultivation. Crops in the Sushui River Basin mainly include winter wheat, summer maize, medicinal herbs, vegetables, melons fruits. It is easy to distinguish winter wheat from summer maize in terms of climatic changes. Diversified crop rotation has been proposed in conservation tillage research to be beneficial to the sustainability of soil organic carbon and fertility [40]. A winter wheat-summer maize/soybean cropping pattern may form in the winter wheat-summer corn rotation pattern [41]; therefore, further research is needed on simple and easy-to-operate methods to differentiate maize and soybean for agricultural cropping planning and food security.
Conclusion
In this study, we combined MODIS data and Sentinel-2 imagery to propose a method for the identification of winter wheat and summer corn rotational planting areas by KPDI. This method is relatively simple and easy to operate. The separability test and the mixing matrix accuracy validation showed that the method could be utilized to extract wheat-corn rotation planting areas in the Sushui River Basin to achieve a high level of accuracy. This method is more suitable for areas with similar phenology and planting structures at the same latitude. However, there are some limitations in the use of the method, and special attention should be paid to the selection of pure image meta-points. When there are different crops of the same phenological period, further identification is needed.
The method was used to extract the winter wheat and summer corn planting areas in the Sushui River Basin during 2017-2018, 2018-2019, and 2019-2020, demonstrating that the method could be applied to different years under the premise that the climatic conditions remain unchanged with limited changes in the phenological period years to extract winter wheat summer corn planting areas. Future research should collect several field sample points to improve the identification accuracy for regional planting planning and food security.

