

Introduction
Soil microorganisms are rich in species, including bacteria, fungi, actinomyces, algae, and protozoa [1]. Soil microorganisms can be considered indicators of soil health due to their pivotal roles in the biogeochemical cycle and the degradation of pollutants in terrestrial ecosystems. The environmental factors that affect soil microorganisms can be grouped into two main categories. One category of direct influencing factors is soil moisture (M), along with temperature, pH, soil metal content, and organic matter content. The remaining factors are indirect, including latitude, elevation, climate, soil texture, vegetation type, and depth [2, 3]. Among the factors that can be used to predict bacterial richness and community composition is pH. While some studies have indicated that bacteria richness is relatively high in soil with a pH range of 4 to 5, the majority of studies have demonstrated that soil with a pH range of 6 to 8 exhibits the highest bacterial abundance and the lowest acidity [4] [5]. Climatic conditions such as drought and precipitation may result in alterations to soil nutrients and plant composition, which could subsequently impact the diversity of bacterial communities in the soil [6].
Plant communities can affect microbial diversity by changing temperature [7]. For example, there are differences in the composition of bacterial communities in soil with different vegetation types in the Greater Khingan Mountains [8]. Altitude can affect the microbial community by changing soil temperature, plant type, water content, and nutrients. For example, the soil autotrophic microbial community on the Qinghai–Tibet Plateau varies significantly with altitude [9]. The soil properties also greatly affect the diversity of the soil bacterial community [10]. Moreover, environmental factors of soil are important determinants of bacterial community structure [11]. Further research is needed to investigate the combined effects of multiple factors on soil microbial community diversity.
The studied pharmaceutical factory mainly produces Chinese and Western medicine for research and development, which includes the production of beta-lactam and tetracycline antibiotics. Long-term production activities in pharmaceutical factories may cause some antibiotic and heavy metal contamination of the surrounding environment. The concentration of antibiotics in the soil in the vicinity of a pharmaceutical factory was below the detection level. However, antibiotic resistance genes (ARGs) were enriched in the soil near the factory [12]. The production process of pharmaceuticals in a factory may result in the spatial distribution of metals in the surrounding topsoil [13]. Antibiotics exist widely in the environment to increase the abundance of ARGs in the soil [14]. From a microbial perspective, antibiotics exert a range of effects on soil communities. These include alterations to enzyme activity and the capacity to metabolize carbon sources, as well as shifts in the overall abundance and relative distribution of microbial species [15]. ARGs and bacterial communities in soil can interact with each other. Kevin et al. found that the soil of Cedar Creek grasslands had more microbial diversity than that of Kellogg soil, which was less abundant in ARGs. The associated ARGs also change with increased soil bacterial diversity [16].
Metals will eventually be deposited as low-solubility compounds in the soil. The combination of toxic metals can combine with essential metabolites and result in the formation of precipitates or chelates, which in turn can lead to the inactivation of cell enzymes. This has the potential to affect the structure and functional diversity of the soil microbial community and, consequently, to reduce soil microbial diversity [17]. Heavy metals are present in soil in a number of different forms, including free metal ions, interchangeable metal ions, soluble metal complexes, and metals bound in other compounds. The different forms lead to varying levels of bioavailability, which in turn result in differing effects on bacterial communities [18]. For example, the presence of zinc oxide (nZnO) in soil decreases the richness and abundance of species in soil [19]. The diversity of the microbial community in soil that has been contaminated by chromium for an extended period of time has also diminished. The presence of lead pollution has been observed to diminish the activity of soil microorganisms. Furthermore, the Shannon and Simpson indices of soil microorganisms were found to be significantly diminished in the area affected by lead pollution [20]. The function and composition of soil microbial communities are subject to variation in response to changes in copper content within the soil [21]. The impact of different metals on bacterial communities in soil varies considerably.
Additionally, soil microbes are known to be remarkably diverse. A comprehensive understanding of the composition and function of soil microbial communities is essential for accurately predicting the future environmental conditions of soil ecosystems [22]. Nevertheless, a considerable number of soil microbes remain uncultured and unanalyzed using conventional methods. The previous methods for culture analysis of soil microbial diversity include the traditional culture method and pyrosequencing method, all of which have certain limitations. The continuous advancement of analytical techniques has led to an increasing interest in 16S rRNA sequencing methods for the analysis of soil microbial communities. To date, only a limited number of studies have been conducted on the diversity of bacterial communities in the soil surrounding the pharmaceutical factory and the factors that influence this diversity. The majority of current researchers are investigating the impact of antibiotic and resistance gene migration in soils near livestock and poultry factories and hospitals on soil microbial communities. To date, only one published study has addressed the impact of pharmaceutical factories on the soil microbial community in the surrounding area. In this paper, we analyzed 16S rRNA gene sequencing and macrogenomic sequencing. A soil near a pharmaceutical factory that has been producing antibiotics for many years was used as a study site by investigating soil chemical properties, bacterial community structure, antibiotic concentration, ARG distribution, and the relationship between these parameters. The intention was to investigate the effect of long-term production activities in the pharmaceutical factory on the bacterial community structure.
Materials and Methods
Soil Sample Collection
The pharmaceutical plant in North China is located in the mid-latitude region, a warm monsoon zone continental climate. The climate is suitable, with four distinct seasons: sufficient light, abundant rainfall, summer prevailing southeast wind, an annual average temperature of 14.1℃, an extreme maximum temperature of 36.5℃, a minimum temperature of -11.1℃, an annual precipitation of 849 mm, and a frost-free period of more than 200 days. The factory covers 150,000 km2 and is mainly engaged in Chinese and Western medicine research and development. The pharmaceutical factory faces the river on the north, west, and south, surrounded by lush vegetation.
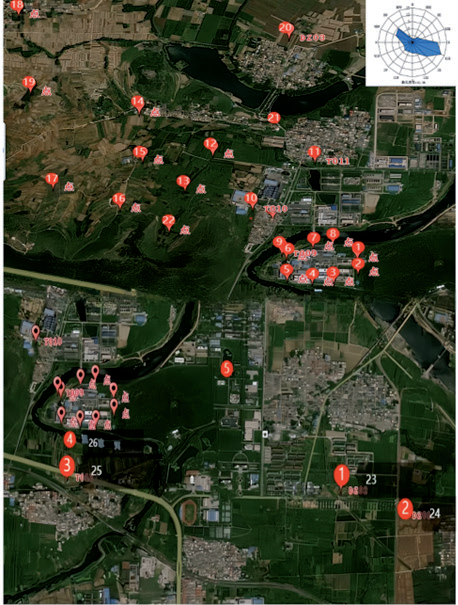
In accordance with the prevailing local wind direction, the pharmaceutical factory was established as the central point of reference, with the local year-round dominant wind direction serving as the primary axis for the random deployment of points and the formation of groups along the upwind and downwind directions of the dominant wind direction. A total of three soil sampling groups were established, designated as Group C (upwind of the pharmaceutical factory), Group A (by the pharmaceutical factory), and Group B (downwind of the pharmaceutical factory). In these three sampling areas, the surface soil at a depth of 0-2m was sampled using the five-point sampling method. A total of 33 soil samples were collected, comprising 15 samples from Group A, 15 from Group B, and 3 from Group C. The soil samples were divided into two parts. The soil samples were divided into two portions; one was placed in a sampling bag and the other in a brown glass sampling bottle. Both samples were then transported back under blue ice at a temperature of -10ºC. The soil samples were divided into three portions. One was designated for 16S rRNA V4 region sequencing and macro-genome sequencing, the second for antibiotic determination, and the third was divided into two smaller portions after the removal of debris, dead leaves, plastics, animal remains, and other foreign materials that were clearly distinguishable from the soil. One portion was employed for the determination of soil moisture content, while another was air-dried in a natural room, ground, and passed through a nylon sieve of 10 mesh, 60 mesh, and 100 mesh. The sieved soil samples were then placed in a kraft bag for storage and labeled for reserve use. The specific sampling layout is illustrated in Fig. 1.
Environmental Factor Determination
Soil physical and chemical properties and metal content, including pH, soil organic matter (SOM), phosphorus (P), potassium (K), oxidation-reduction potential (Eh), copper (Cu), nickel (Ni), lead (Pb), chromium (Cr), and zinc (Zn), were determined to understand the physical and chemical properties of soil samples. Eh is measured in the field. Each sampling point delimits a square area where the middle point is selected. Next, the Eh table is inserted, and the reading is obtained with a stable count repeated three times. Soil pH (HJ 962–2018) was measured using the potentiometric method, which is the ratio of soil to water (2.5:1 in our samples). The pH composite electrode was immersed in the soil suspension, and the reading was obtained when the pH meter was stable [23]. SOM using the scorch reduction method (HJ 761–2015). The dry samples, which are sieved through a 0.25 mm aperture, are burned in a muffle furnace and dried in an electric desiccator until they are of constant weight. The before and after weights were measured. Soil organic matter was measured by the change in weight before and after. Cu, Ni, Pb, and Cr in soil, the soil was first subjected to fully automated digestion. The digested soil was then quantified by inductively coupled plasma atomic emission spectrometry (ICP-AES) and inductively coupled plasma mass spectrometry (ICP-MS).
The antibiotics in the soil were extracted using solid-phase extraction, high-performance liquid mass spectrometry, and tandem mass spectrometry. Two groups of nine antibiotics were selected for soil residue testing: tetracyclines and β-lactams. Soil samples were subjected to ultrasound-assisted extraction with acetonitrile and McIlvaine buffer, followed by solid-phase extraction using a SAX-HLB column for enrichment and purification. Target antibiotic compounds in the extracts were quantified using high-performance liquid chromatography-tandem mass spectrometry (HPLC-MS/MS). All samples were analyzed in strict adherence to a quality assurance and quality control program. Concentrations below the detection limit were considered as zero during statistical analysis [24].
16S rRNA and Metagenomic Sequencing
Metagenomic sequencing studies of complex microbial communities were performed by building metagenomic assembly genomes [25]. The 16S rRNA amplicon technique is critical for studying microbial community composition and diversity in environmental samples. It mainly selects one or several variation regions, designs universal primers in the region’s conserved region for PCR amplification, and then conducts sequencing analysis and strain identification on the region’s highly variable region [26, 27]. In this study, the diversity of bacterial communities in soil was analyzed by Qille2 analysis with the help of the Novozymes platform, with 6G sequencing data and a 16sV4 amplification region to analyze the diversity of bacterial communities in soil. The soil was sequenced and analyzed using macrogenome sequencing with the help of the NOHZ platform.
Data Processing and Analysis
The 16S rRNA sequencing data were analyzed with an R-package script [28]. The 10 high-ranking relative abundance map data, an alpha index, β matrix, and linear discriminant analysis data were obtained, and the unweighted unifrac distance from PCoA was plotted. The α diversity index, soil physicochemical properties, and metal data measured using ICP-AES (Thermo Fisher Scientific Company) and ICP-MS (Thermo Perkin-Elmer Company) were expressed as mean±standard deviation. A one-way analysis of variance was used for comparison. The values were considered to be different when P<0.05. One-way ANOVA using IBM SPSS Statistics (https:// www.ibm.com). The relative abundance plot data in the gates were processed and mapped using Origin 2022 software (http://www.originlab.com/2022). Linear discriminant analysis data were processed using the website www.ehbio.com. In this study, metagenomic data were processed through the Novo Cloud platform (https://magic.novogene.com). The sample plots were drawn using Arc Gis10.8 (https://desktop.arcgis. com) and Bigemap GIS Office (www.bigemap.com). The RDA was analyzed using CANOCO 5.0 software (http://canoco5.com), and the linear relationship between the relevant factors was also examined in Microsoft Excel (http://www.microsoft.com/zn-cn/microsoft-365/ excel).
Results
Soil Chemical Properties and Metal
The results of the descriptive statistical analysis of the soil physicochemical properties in the soils surrounding the pharmaceutical factory are presented in Table 1, which provides a summary of the physicochemical properties of each soil sample group. The mean soil organic matter (SOM), phosphorus (P), potassium (K), and oxidation reduction potential (Eh) of the samples from each soil group in the surface soil around the pharmaceutical factory ranged from 7.08 to 17.51 g/kg, 0.37 to 0.57 g/kg, 1.3% to 1.9%, and 246 to 325 mV, respectively. The soil samples from the three groups exhibited neutral pH values, with an average ranging from 7.21 to 7. The pH value of the soil in the downwind soil group of the pharmaceutical factory (Group B) was significantly higher than that of the upwind soil group of the pharmaceutical factory (Group C). Additionally, the organic matter content of the soil by the pharmaceutical factory was higher than that of the other two groups of soils. The phosphorus content of the soil in the downwind soil group was higher than that of the other two groups, with the exception of the remaining indexes, which exhibited no significant difference between the three groups of soil samples. This indicated that the values of K and Eh at each point were relatively stable and that the soil chemical properties were essentially similar. In conclusion, it can be stated that the operation and production of the pharmaceutical factory may have exerted an influence on the pH, soil organic matter (SOM), and phosphorus (P) content of the soil.
Table 1.
presents the results of the analysis of the physical and chemical properties of the soil samples, as well as the assessment of various environmental factors and the determination of their significant correlation between and within the groups. The analysis revealed a statistically significant difference (p<0.05) in the pH and P values of the soil samples from groups B and C. Conversely, the results indicated that there was no statistically significant difference (p<0.05) in the pH and W values.
| Soil Sample Group | A | B | C |
|---|---|---|---|
| pH | 7.56±0.23ab | 7.61±0.27a | 7.45±0.24b |
| SOM (g/kg) | 14.40±2.75a | 9.60±2.52b | 9.65±1.23b |
| P (g/kg) | 2.09±0.28a | 1.59±0.32b | 1.39±0.46a |
| K (%) | 1.6±0.1a | 1.6±0.3a | 1.8±0.1a |
| Eh (mv) | 269±23a | 273±28a | 297±28a |
Fig. 2 illustrates the descriptive statistics of heavy metals in the soil surrounding the pharmaceutical factory. The concentration range of chromium (Cr) in the surface soil adjacent to the pharmaceutical factory was 79.36±14.8 mg/kg, while the concentration of copper (Cu) was 24.6±4.0 mg/kg, nickel (Ni) 34.7±9.2 mg/kg, zinc (Zn) 71±15 mg/kg, and lead (Pb) 26.33±3.55 mg/kg. These values were recorded in the surface soil downwind of the pharmaceutical factory I. The concentration range of lead (Pb) was found to be 26.33±3.55 mg/kg. The concentration range of lead (Pb) was found to be 26.33±3.55 mg/kg. In the surface soil located downwind of the pharmaceutical factory, the concentration range of chromium (Cr) was found to be 84.79±13.63 mg/kg, while the concentration of copper (Cu) was 26.9±5.8 mg/kg, nickel (Ni) was 37.7±11.4 mg/kg, and zinc (Zn) was 76±23 mg/kg. In the surface soil upwind of the plant, the concentration of chromium (Cr) was found to range from 79.377±22.52 mg/kg, while copper (Cu) exhibited a concentration of 23.5±5.8 mg/kg, and nickel (Ni) demonstrated a concentration of 40.7±14. The concentration of zinc (Zn) was 4 mg/kg, while lead (Pb) concentrations ranged from 27.6±5.2 mg/kg. The metal content of the three groups of soil samples exhibited no significant difference, indicating that the metal content is relatively stable at all sites. The preliminary indication is that the operation and production of the pharmaceutical factory do not have a significant impact on the metal content of the surrounding soils.
Antibiotics and Resistance Genes in Soil
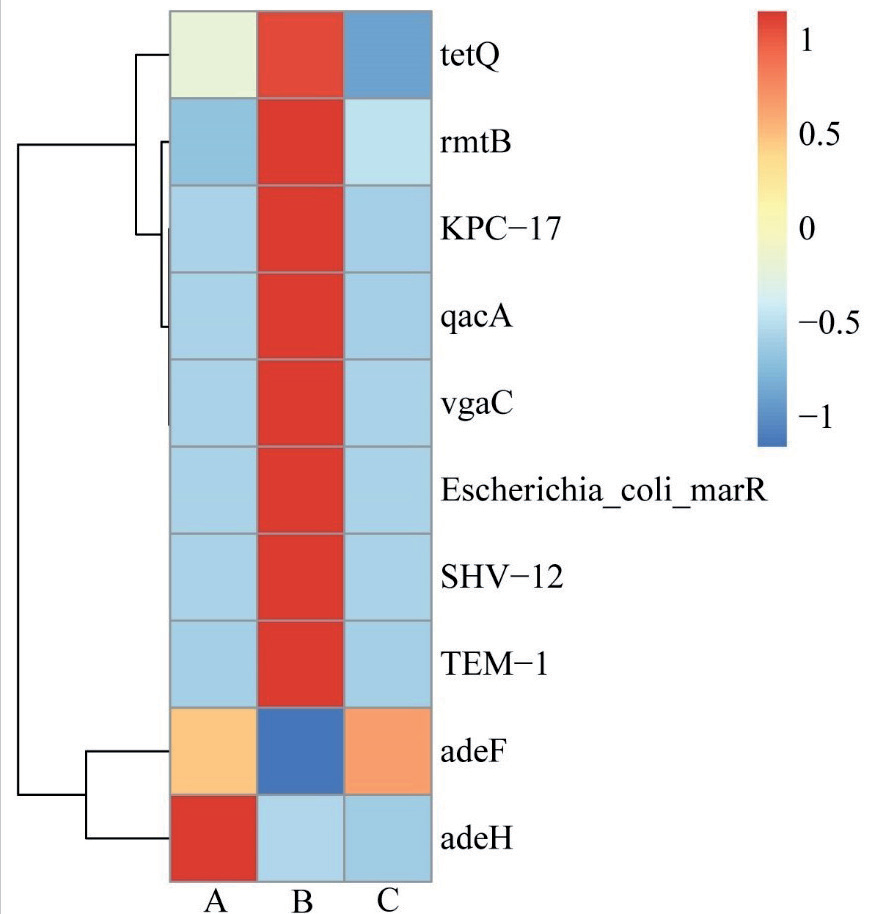
In the soil around the pharmaceutical factory studied in this investigation, we focused on the detection of β-lactam, fluoroquinolone, and tetracycline antibiotics in the soil according to the type of drugs produced by the pharmaceutical factory. The results are presented in Table 2. The antibiotic concentrations found in the three sets of soil samples around the pharmaceutical factory were all below the detection limit. ARGs were present at some frequency in all three groups of soil samples from the pharmaceutical factory investigated in this study. The top ten abundances of resistance genes obtained by the macro-genomic assay are shown in Fig. 3 and Fig. 4. ARGs were mostly clustered in the soil samples downwind of the pharmaceutical factory, and most of them were adeF, SHV_12, tetQ, qacA, vgaC, TEM_1, rmtB, Escherichia_coli_marR, KPC_17, and adeH. The ARGs in the soil samples upwind of the factory were adeF, SHV_12, tetQ, qacA, vgaC, TEM_1, rmtB, Escherichia_coli_marR, KPC_17, and adeH. The ARGs in the soil samples were adeF, tetQ, qacA, and rmtB. The ARGs in the pharmacy-side soil samples were adeF, tetQ, qacA, KPC_17, and adeH. Of these, adeF had the highest abundance in the soil samples upwind of the pharmaceutical factory and the lowest abundance in the soil samples downwind of the pharmaceutical factory. Considering that vgaC and TEM_1 were not present in the soil samples from the soil groups upwind and at the edge of the pharmaceutical factory, but vgaC and TEM_1 were enriched in the soil samples downwind of the pharmaceutical factory, this was considered to be the influence of other production and living activities. AdeH was only present in soil samples from the soil groups at the edge and downwind of the pharmaceutical factory, and it was also found in soil samples from the soil groups downwind of the pharmaceutical factory.
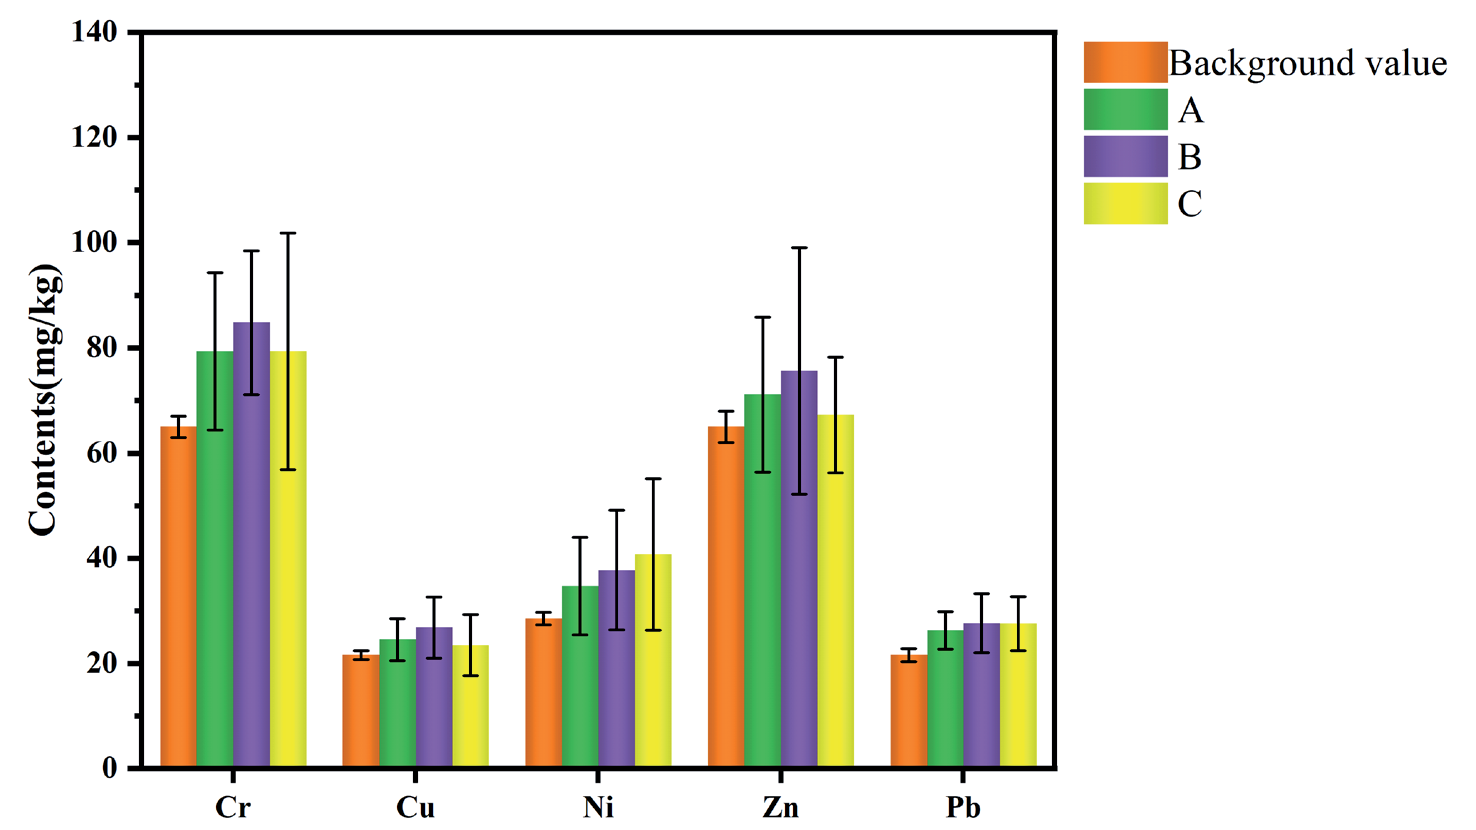
Table 2.
Antibiotic content in soil around pharmaceutical factories.
Soil Bacterial Community Diversity
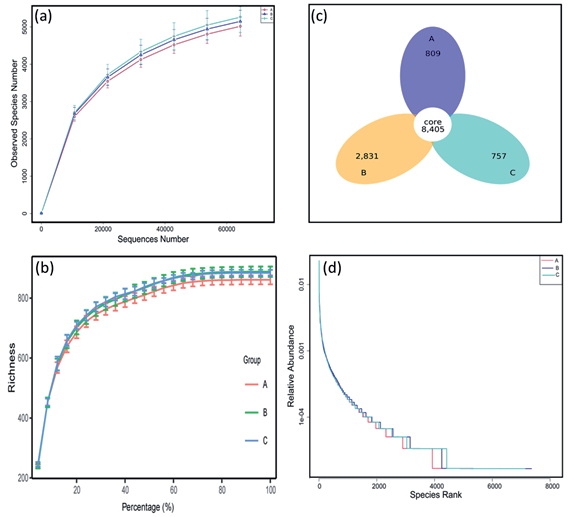
In Fig. 5a) and b) above, the slopes of the dilution curves for the soil samples in groups A, B, and C from the pharmaceutical factory were still large at a sequencing volume of 6,000, suggesting that new species may emerge as sampling continues. However, when combined with Fig. 5 below, as the level of sequencing increases, the end of the curve for each sample has flattened. This suggests that the diversity of the microbial community is unlikely to change much as the amount of sequencing is increased. The amount of sequencing is sufficient to adequately count the diversity of the microbial community.
As shown in Fig. 5c), there were 17403 ASVs in the three groups of soil samples, of which 8405 were common ASVs, 809 ASVs were unique to group A (soil sample group at the edge of the pharmaceutical factory), 2831 ASVs were unique to group B (soil sample group downwind of the pharmaceutical factory), and 757 ASVs were unique to group C (soil sample group upwind of the pharmaceutical factory). The number of endemic ASVs is much lower than the number of shared ASVs in each soil sample group, so there is little difference in microbial species diversity between the sample groups. The alpha diversity index and its variability results further confirm this conclusion.
Fig. 3.
ARO clustering heatmap for pharmaceutical companies, with sample information in the horizontal direction; functional annotation information in the vertical direction; the clustering tree on the left side of the figure is the functional clustering tree; the values corresponding to the heatmap in the middle are the Z-values obtained by normalising the relative abundance of the functions in each row.
In Fig. 6, the difference in alpha diversity index between the three soil sample groups of the pharmaceutical factory was not significant. The difference in diversity among the soil samples around the pharmaceutical factory was not significant. The Shannon and Simpson indices showed that the diversity of the bacterial community was lowest in the soil of the soil group at the edge of the pharmaceutical factory. The chao1 index showed that the abundance of bacterial communities in the soil group downwind of the pharmaceutical factory > the abundance of bacteria in the soil group upwind of the pharmaceutical factory > the abundance of bacterial species in the soil group at the edge of the pharmaceutical factory. Abundance of the bacterial community in the soil group near the pharmaceutical factory. The good coverage of the soil samples in all three groups of the pharmaceutical factory was over 98%, indicating that the actual flora in each group was fully covered. With reference to Fig. 5d), the downwind soil group of Shandong Pharmaceutical Factory had the most uniform distribution of soil species.
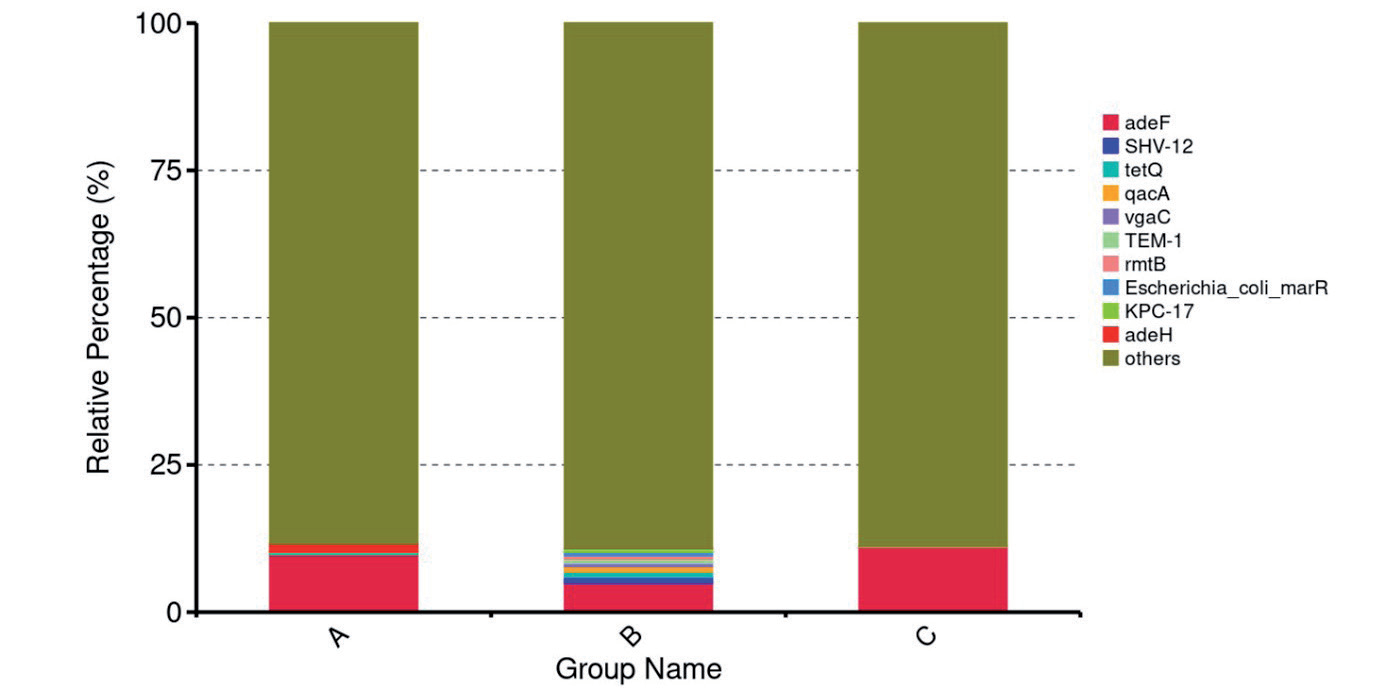
Fig. 5.
a) and b) Dilution curve, which is flat and saturated, reflecting a reasonable amount of sequencing and sufficient coverage of most soil microorganisms, with the possibility of some rare species being included; c) is the venn diagram of soil samples; d) is the clustering curves of soil classes around the pharmaceutical factory.
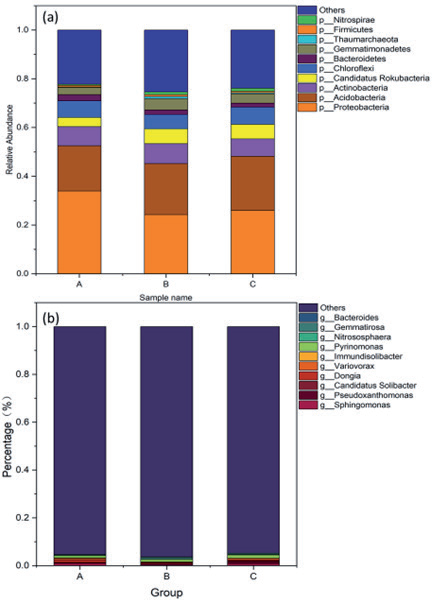
At the phylum level, the relative abundance of the first ten species is shown in Fig. 7a). The bacterial groups identified in this study include Proteobacteria, Acidobacteria, Actinobacteria, Bacteroidetes, Gemmatimonadetes, Firmicutes, Candidatus Rokubacteria, Thaumarchaeota, Nitrospirae, and Chloroflexi. The results demonstrated that Proteobacteria, Acidobacteria, and Actinobacteria were the dominant bacterial groups in the soil group located at the edge of the pharmaceutical factory, the soil group situated upwind of the pharmaceutical factory, and the soil group located downwind of the pharmaceutical factory. The relative proportion of Proteobacteria in soil samples from the vicinity of the pharmaceutical factory was the largest among all soil groups, while it was the smallest in soil samples from locations upwind of the factory. The Acidobacteria phylum exhibited the highest relative percentage of soil samples in the downwind soil group soil samples of the pharmaceutical factory and the lowest relative percentage of soil samples in the soil group soil samples of the side of the pharmaceutical factory. The Actinobacteria phylum exhibited the highest percentage in the downwind soil group soil samples at the drug plant and the lowest percentage of soil samples in the upwind soil group soil samples at the drug plant. Fig. 7b) illustrates the relative abundance plot of the nine most prevalent genera at the genus level in the vicinity of the pharmaceutical factory. Collectively, these nine genera represent between 4.7% and 5.2% of the total number of genera. The majority of the identified genera accounted for less than 1% of the total composition, indicating that the bacterial communities in the investigated soils were both abundant and evenly distributed. The two most prevalent genera across all three soil sample groups were Sphingomonas and Pyrinomonas. Furthermore, the soil samples from the soil group at the edge of the pharmaceutical factory exhibited a relatively high abundance of the genus Dongia within the α-Ascomycetes, the soil from the soil group downwind of the pharmaceutical factory demonstrated a relatively high abundance of the genus Candidatus Solibacter, and the soil from the soil group upwind of the pharmaceutical factory exhibited a relatively high abundance of the genus Sphingomonas.
Fig. 6.
Alpha diversity index map of soils around the pharmaceutical factory. a) shannon index, b) Simpson index, c) Chao1 index, d) Goods coverage index.
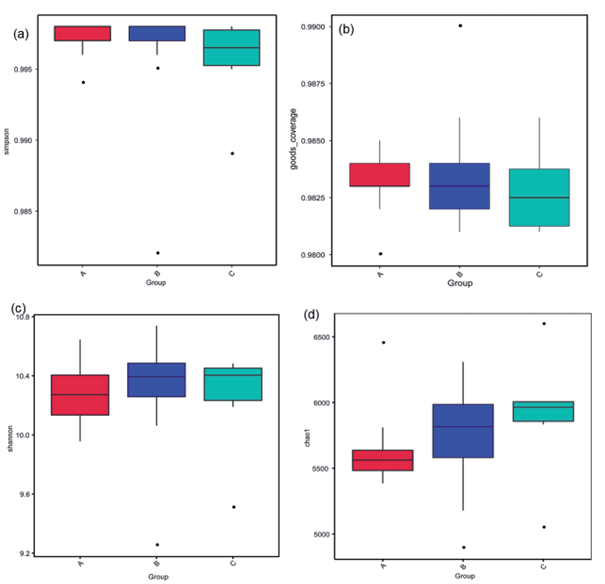
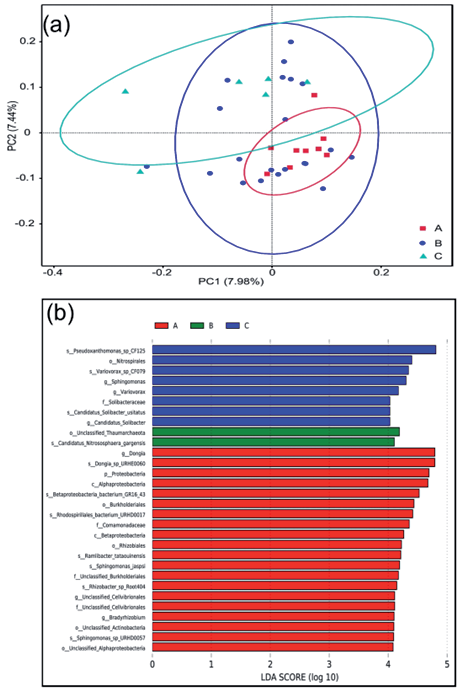
Table 3 illustrates a notable discrepancy between the pharmacy side soil samples and the pharmacy upwind soil samples, as well as between the pharmacy upwind soil samples and the pharmacy downwind soil samples. Despite this, the difference between the pharmacy upwind soil samples and the pharmacy downwind soil samples did not reach statistical significance, aligning with the findings depicted in Fig. 6. The R-value obtained from the Anosim analysis between the three groups of samples was greater than 0, indicating that the grouping of the samples was meaningful and that the difference between the groups was greater than the difference within the groups. The data from the soil samples collected at varying distances from the pharmaceutical factory and the soil samples from the factory premises were subjected to principal coordinate axis analysis (PCoA) based on unweighted Unifrac distance. The results pertaining to the factory are presented in Fig. 8a), which demonstrates that all replicate samples of soil from the upwind group exhibit robust clustering. The second principal coordinate axis of PCo2 unambiguously distinguishes soil samples from the soil group located adjacent to the pharmaceutical factory from those from the soil group situated upwind of the pharmaceutical factory. The second principal axis of PCo2 is effective in differentiating the soil samples from the pharmacy side soil group from those from the pharmacy upwind soil group. The species composition of some soil samples from the edge of the pharmaceutical factory and some soil samples from the downwind area exhibited comparable community structures within their respective groups. However, the degree of similarity between these groups was notable. A similar pattern was observed in some of the soil samples from the downwind soil group. This may be attributed to the fact that the manufacturing activities of the pharmaceutical factory exert a more pronounced influence on the microbial community composition of the soils in close proximity to the plant while exerting a comparatively lesser impact on the soils situated downwind of the factory.
Table 3.
Analysis of differences between groups of pharmaceutical Anosim.
| Group | A & B | A & C | B & C |
|---|---|---|---|
| R | 0.06 | 0.465 | 0.188 |
| P | 0.004 | 0.26 | 0.11 |
Table 4.
Metal test analysis of the effect of environmental factors on the abundance of bacteria in soils around the pharmacy.
The LDA threshold was set to 4.0. A LEfSe analysis was conducted on three groups of soil samples, comprising two samples from the pharmacy side, two from the pharmacy downwind, and two from the pharmacy upwind. The results are presented in Fig. 8b). A total of 30 bacterial branches exhibited significant differences across all soil samples. Twenty bacterial branches were found to be more abundant in the soil from the pharmaceutical factory site, with the majority belonging to the Ascomycetes class. Two bacterial branches were found to be enriched in the soil located downwind of the pharmaceutical factory, with Archaea representing the predominant group. Eight bacterial branches were found to be enriched in the soil located upwind of the pharmaceutical factory, with Acidobacteria representing the most prominent group. In conclusion, the biomarker for the soil group in proximity to the pharmaceutical factory was Proteobacteria, while the biomarker for the soil upwind of the pharmaceutical factory was Acidobacteria.
Correlation Analysis between Environmental Factors and Microbial Community Diversity
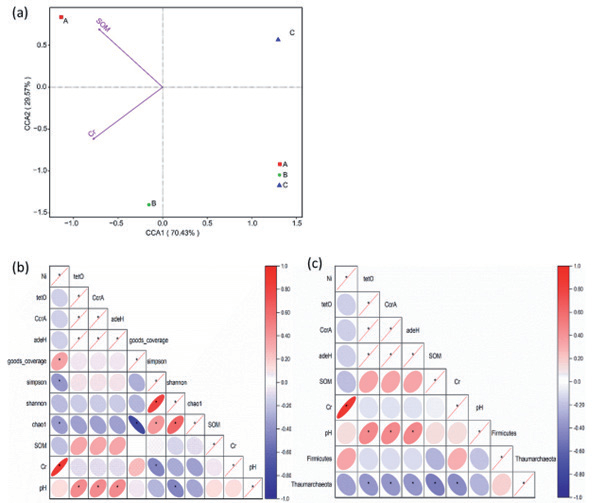
Of the environmental factors measured in this study, CCA analyses demonstrated that soil Cr and SOM levels were the two environmental factors with the greatest impact on the distribution of microbial species in the surface soil in the vicinity of the pharmaceutical factory (Fig. 9a)). The horizontal coordinate contributed 70.43% to the variation in the composition of the community in each soil sample, and the vertical coordinate contributed 29.57% to the variation in the composition of the community in each soil sample. Fig. 9b) illustrates the correlation between specific environmental factors and microbial species richness in the pharmaceutical factory. As illustrated in the figure, there is no discernible correlation between the abundance of antibiotic resistance genes in the soil and the number of observed communities. Additionally, pH has been identified as a factor influencing soil microbial community richness. Fig. 9c) illustrates the correlation between the typical environmental factors and the differential bacterial abundance in the soil of the pharmaceutical factory. It can be observed that the presence of antibiotic resistance genes in the soil exhibits a notable negative correlation with Thaumarchaeota. There is a positive correlation between Ni and Cr and Thaumarchaeota. As demonstrated in Table 4, the abundance of soil flora in all soil samples from the pharmaceutical factory was found to be significantly influenced by six factors: Pb, Ni, Cr, Cu, CcrA, and soil pH. In contrast, the abundance of other antibiotic resistance genes in the soil was not found to have a significant effect on soil flora abundance. However, the Mantel test analysis revealed a different picture. The ten most abundant ARGs, namely adeF, tetQ, qacA, CcrA, KPC17, PmrF, UhPT, tetO, oqxA, and acrD, exert a significant influence on the distribution of bacterial communities. In addition to the effect of antibiotic resistance gene abundance, the concentration of Cu, Ni, Cr, Zn, and Pb in the soil also exerted a significant influence on the distribution of bacterial communities in the soil surrounding the pharmaceutical factory.
Fig.7.
Relative abundance plot. a) depicts the relative abundance (n%) of the ten most prevalent phylum in the three sets of soil samples, b) depicts the relative abundance (n%) of the ten most prevalent genus in the three sets of soil samples, with the remaining figures indicating that the proportion of gates is insufficient to yield meaningful results.
Discussion
The pharmaceutical industry produces a considerable quantity of antibiotics on an annual basis, including tetracyclines and beta-lactams. This manufacturing process has been observed to impact the soil quality in the surrounding areas, potentially leading to the formation of a reservoir of ARGs. A survey of antibiotic concentrations in soil around pharmaceutical factories by relevant experts revealed that the antibiotic concentrations in the soil samples were below the detection limit. This result is consistent with the survey and research results of our study [12]. Following their introduction to the soil environment, antibiotics may undergo adsorption and subsequent transport from the soil into aqueous environments. Alternatively, they may be taken up by organisms and then degraded. Therefore, soil adsorption may be a contributing factor to the observed low concentration of antibiotics in soil samples. One potential explanation for the low concentration of antibiotics in soil is the influence of soil adsorption and degradation. The adsorption process exerts a pivotal influence on the environmental behavior and concentration of antibiotics in soil [29]. Nevertheless, the adsorption and degradation of antibiotics in the soil are inextricably linked to physicochemical properties, including soil composition, pH, ionic environment, texture, and organic matter [30].
In general, the adsorption coefficient is large under acidic conditions and decreases with increasing pH [31, 32]. The soil in the vicinity of the pharmaceutical factory was observed to be alkaline and demonstrated a low potential for the adsorption of antibiotics. Furthermore, the high level of vegetation coverage in the vicinity of the soil sampling points may be a contributing factor to the relatively low concentration of antibiotics observed in the soil during this survey.
The pharmaceutical factory in question produces β-lactams and tetracyclines, and ARGs for tetracyclines and β-lactam antibiotics are present in lower abundance in the soil located downwind of the factory than in the soil located downwind of the factory. This initial observation may be attributed to the influence of the pharmaceutical factory on the soil downwind or, alternatively, to the horizontal transfer of ARGs. It has been demonstrated that antibiotics do not have a significant inductive effect on bacteria’s growth. In contrast, pathogenic bacteria can also acquire resistance through horizontal gene transfer (HGT), with mobile gene elements (MGEs) playing a pivotal role in influencing the development of resistance in soil bacteria [33, 34]. Similarly, the presence of tetQ, a gene encoding resistance to tetracycline-like compounds, was identified in the soil samples. No factories producing tetracyclines or sources of contamination were identified in the vicinity. Nevertheless, the considerable prevalence of several of these transposons (e.g., tnpA-02, tnpA-04, and IS613) indicates that the tetracycline ARGs identified in this soil may have been acquired through HGT [35].
Fig.8.
a) The PCoA graph is based on an unweighted Unifrac distance, with dots of varying shapes and colours representing samples from disparate locations. b) A LEfSe analysis of soil microbial abundance in the soil surrounding the pharmaceutical plant (A), soil downwind of the pharmaceutical plant (B), and soil upwind of the pharmaceutical plant (C) was conducted with a threshold of 4.0.
Relevant researchers believe that using the 97% threshold to classify species is rough, and the error may be relatively large [36]. The initial proposal of the 97% clustering threshold in 1994 was based on the limited availability of 16S rRNA sequences. In contrast, the current landscape features a vast array of high-quality 16S rRNA sequences, which has led to the development of algorithms that are highly accurate when calibrated to specific metrics. The optimal identity threshold is approximately 99% for long sequences and approximately 100% for highly variable regions of V4. The Unoise3 method retains sequences with an abundance of at least eight by default, while low-abundance sequences are excluded due to an increased probability of error. The clustering ability of this method is superior to that of the Divisive Amplicon Denoising Algorithm (DADA) [37]. Accordingly, the Unois3 method was employed for the clustering of Amplicon Sequence Variants (ASVs) in the present experiment. The observed sparse curve of all soil samples was saturated, indicating that a reasonable amount of sequencing was conducted and that the majority of soil microorganisms were captured, along with some rare species that may also be included [38]. The relative abundance of Actinobacteria and Verrucomicrobia exhibited an increase from upwind to downwind, in accordance with the dominant wind direction. The predominant phylum responsible for the production of ARGs was Actinobacteria, which aligns with the observation that the ARG species exhibited increased abundance in accordance with the prevailing wind direction [39]. The results of Proteobacteria as the dominant bacteria and Acidobacteria as the secondary predominant bacteria were the same as those of other studies on soil microbial community diversity around pharmaceutical factories [12]. In addition, in other investigations of soil microorganisms in wetlands and farmland, Proteobacteria accounted for the largest proportion compared with other bacteria [40-42]. Additionally, Proteobacteria are functionally rich in morphology and high in physiological and metabolic levels, which is significant for global carbon, nitrogen, and sulfur cycles [43].
Fig. 9.
a) CCA analysis diagram; b) Heat map of Spearman’s correlation analysis between environmental factors and Alpha in pharmaceutical factories (p<0.05); c) Heat map of Spearman’s correlation analysis between environmental factors and differential species in pharmaceutical factories (P<0.05).
No difference was observed in α-diversity. Nevertheless, the pH, species diversity, richness, and evenness of the downwind soil samples exhibited slight increases in comparison to those of the pharmacy and upwind soil samples. This result may be related to the pH factor, as correlation studies have demonstrated a significant effect of pH on microbial α-diversity [44]. While the α-diversity metric indicated that the microbial species present in the three soil samples were similar, the bacterial community structure of microorganisms differed between the soil groups, as evidenced by the PCoA results. The discrepancy in microbial species may be attributed to a number of factors. This conclusion is consistent with the findings of previous researchers in this field [12].
The results of the present investigation are consistent with those of the aforementioned study, with the soil chemical of the fractions exhibiting similarities and the antibiotic concentrations remaining below the detection limit. Despite the pharmaceutical company’s long-term activities having a negligible impact on antibiotic concentrations in the soil and a similarly minimal effect on the structure of the bacterial community, the influence on soil physicochemicals did exert an indirect effect on the bacterial community structure. As previously stated, the predominant species in the soil samples were Acidobacteria and Proteobacteria, in descending order. The discrepancies in the species composition of the soil samples may be attributed to variations in the environmental factors present in the soil surrounding the pharmaceutical factories. To illustrate, the pH of the soil upstream of the pharmaceutical factory was markedly lower than that of the soil downstream. The abundance of Acidobacteria was found to be pH-dependent, with the majority of Acidobacteria exhibiting heightened activity in low pH soils [45]. Furthermore, Eh, K, and Cd impact the abundance of Acidobacteria in soil.
The diversity of soil microorganisms is influenced by soil pH, which exerts a physiological constraint on these organisms and limits the availability of nutrients in the soil [46]. For instance, the richness and diversity of bacterial communities are observed to be diminished in acidic soils when compared to those of neutral and alkaline soils [47]. The quality and quantity of SOM have a strong influence on microbial diversity [48]. For example, the abundance of Proteobacteria in the soil was affected by soil organic matter. The δ-Proteus was abundant in the soil of the long-term application of cow manure and high SOM [49]. The phylum Actinobacteria is primarily associated with SOM. Actinobacteria phyla was positively correlated with SOM because some Actinobacteria can decompose a wide range of SOM in the soil [35]. The impact of Cr on microbial communities is mediated by its diverse forms, including water-soluble, exchangeable, and oxidant-bound species. These forms can influence microbial community structure and function, ultimately leading to a reduction in microbial community abundance [50]. Other metals, such as Pb and Ni, also cause changes in soil microbial communities [51, 52]. The Shannon index demonstrates variability in response to ARGs in soil. A review of previous studies was conducted to illustrate the diversity of ARGs and bacterial communities. The phyla Ascomycota, Mycobacteria, Actinobacteria, and Firmicutes were identified as potential hosts for ARGs [53]. Numerous studies have been conducted to show that changes in ARGs are associated with structural changes in microbial communities [54, 55].
Transformations in microbial communities have the potential to exert significant influences on both the natural environment and public health. In terms of the potential environmental impacts of changes in microbial community structure, soil organic carbon serves as a crucial indicator of soil fertility. The regulation of soil organic carbon storage by soil microbes is influenced by the microbial residual C in terrestrial ecosystems [56]. It has been demonstrated in related studies that the structure of soil microbial communities in tropical forests may exert an influence on the accumulation of microbial residual carbon [57]. Nevertheless, the impact of soil microbial community structure on microbial residual C accumulation remains to be quantified. Furthermore, soil microbiological changes have an impact on ecosystem stability [58]. In order to ascertain the potential impact of changes in microbial communities on public health, microorganisms are capable of degrading volatile organic pollutants, thereby reducing the level of pollutants in the environment and maintaining environmental health [59].
Conclusions
In this investigation, we examined the pharmaceutical properties, metal content, antibiotics, resistance genes, and microorganisms of the soil in the vicinity of the pharmaceutical factory. We also analyzed the impact of the factory’s production activities on the diversity of microbial communities in the surrounding soil using CCA, Spearman, and Mantel test analyses. The results of the α diversity indices indicated that there was no significant change in the diversity and evenness of the soil bacterial community. Meanwhile, the PCoA results indicated that a number of factors may be responsible for the observed differences in bacterial communities between different soil groups. LefSe analyses additionally revealed that the biomarker for the pharmacy-side soil group was the Proteobacteria phylum, while the biomarker for the soil upwind of the pharmacy was the Acidobacterium phylum. Such alterations to microbial communities have the potential to exert an influence on the surrounding environment and public health. Further CCA analyses demonstrated that Cr and soil organic matter (SOM) were the primary environmental factors influencing soil microbial communities. Additionally, Spearman correlation analysis revealed a correlation between antibiotic resistance genes Ni and Cr with Thaumarchaeota. In the analysis of the influence of various factors on the abundance of soil flora, the following were identified as the six most significant: Pb, Ni, Cr, Cu, CcrA, and soil pH. These factors were observed in all soil samples from the pharmaceutical factory. However, in this investigation, the antibiotic concentrations were below the detection limit, making their effect on soil microbial diversity insignificant. However, the ARG clustering heat map indicates that ARG was enriched in the soil in the downwind vicinity of the pharmaceutical factory. This should enhance our comprehension of the influence of prolonged pharmaceutical operations on the soil microbial species. This investigation and research are not without shortcomings. For instance, there is a need for further study on the mechanism of occurrence, migration, and spread of ARGs in soil during long-term production activities of pharmaceutical factories. This should entail determining the MGE in soil. Furthermore, a more comprehensive investigation is required to ascertain the potential factors influencing soil microbiological alterations resulting from long-term pharmaceutical factory operations.

