

Introduction
Carbon emissions have become one of the most significant concerns in the world, as rapid industrialization and development have led to a surge in the level of greenhouse gases in the atmosphere, contributing to global warming. The international community has taken note of this problem and developed several policies and regulations to reduce carbon emissions. The Paris Agreement, for example, aims to limit global warming to below two ºC above pre-industrial levels. At the same time, the EU Emission Trading System and the Kyoto Protocol involve reducing emissions through market mechanisms and other methods. As the world’s largest carbon emitter, China has also taken significant steps to address this issue. In the past decade, China has launched a series of initiatives to reduce carbon emissions, such as implementing renewable energy laws, setting carbon intensity reduction targets, and launching pilot emission trading schemes. These measures are part of China’s broader efforts to promote sustainable development.
The study of carbon emissions and its impact on the environment has become a significant area of research in recent years. Researchers have investigated various factors that affect carbon emissions, such as economic growth, energy consumption, and population, and analyzed the spatial and temporal patterns of carbon emissions. These studies have revealed the urgent need for policymakers and stakeholders to take action to mitigate the effects of carbon emissions. The importance of researching carbon emissions is evident, given the global concern for the environment and the significant impacts of greenhouse gases on public health, the economy, and ecosystems. In particular, understanding the spatial and temporal dynamics of carbon emissions and the effectiveness of various policies and regulations is critical to developing effective mitigation strategies and promoting sustainable development.
However, amidst the implementation of these policies, economic policy uncertainty has become an increasingly significant factor affecting carbon emission intensity, particularly in developing countries like China, where previous studies have shown that economic policy uncertainty leads to more significant carbon emissions. Global concerns about economic policy uncertainty (EPU) have escalated in recent years. In addition, the IMF (International Monetary Fund) country report concluded that the EPU was one of the main reasons for the slow economic growth in the past few years. In addition to the economic impact of EPU, it may also have an environmental impact. EPU may encourage producers to adopt traditional and environmentally unfriendly production methods, which will increase CO2 emissions. In addition, the EPU may affect consumption and investment, thus reducing carbon dioxide emissions. Therefore, we should explore the relationship between EPU and carbon emissions to propose relevant policies.
At the same time, the uncertainty of economic policies will significantly impact the carbon emissions of various countries. Economic policy uncertainty refers to the fact that as subjects of economic behavior, they cannot accurately understand whether, when, and how policymakers change existing economic policies. The external policy environment of enterprise operation is closely related to economic policy uncertainty. The changed external policy environment will lead to changes in the operation strategies of enterprises, which in turn will affect the regional total carbon emissions. Therefore, we deeply study whether economic policy uncertainty can affect carbon emission intensity and further analyze the effect and spatial spillover effect on carbon emission intensity.
Against the backdrop of the rapid transformation of the global economy, economic policy uncertainty (EPU) has permeated many areas of economic development and environmental sustainability in various countries and regions. In particular, the role of economic policy uncertainty has become increasingly prominent in controlling and reducing carbon emission intensity. Over the years, the Chinese government has been actively promoting economic development, but at the same time, it is also facing pressure for environmental protection and sustainable development. In order to steer its economic transformation, the Chinese government has implemented a series of policy measures, including structural adjustment of energy consumption, environmental governance, and carbon emission reduction. For example, China released the Climate Change Adaptation and Mitigation Action Program (2020-2030) in 2015, which aims to reduce the carbon emission intensity per unit of gross domestic product (GDP). According to data released by the National Bureau of Statistics (NBS), between 2004 and 2017, China’s carbon intensity decreased from 2.91 tons of carbon dioxide equivalent (CO2e) per 10,000 yuan of GDP to 1.99 tons of CO2e. However, China still faces an unstable economic policy environment, which makes the relationship between the path of economic development and carbon intensity complex and uncertain.
Furthermore, the relationship between economic development and carbon intensity is also greatly concerned globally. According to the International Energy Agency (IEA), as of 2020, the global carbon intensity due to greenhouse gas emissions will be 36.8 kg CO2 equivalent per dollar of GDP. There are differences between economic policy uncertainty and carbon intensity in different countries and regions. For example, the European Union has developed several carbon reduction policies to reduce carbon intensity to below $100 per unit of GDP. However, some developing countries face the challenge of economic policy uncertainty and increasing carbon intensity during their economic growth.
Theoretically, understanding the impact of economic policy uncertainty on carbon emissions is necessary to ensure the living environment and living standards of the people, and it is also the only way to achieve high-quality development of the national economy. Controlling greenhouse gases within a certain level is not only conducive to the development of a green economy in each country but also to the sustainable development of the global economy. This paper further expands the research field of economic policy uncertainty. It enriches the theory of a low-carbon economy, which will provide some theoretical significance for formulating reasonable emission reduction measures and developing the economy more sustainably.
From a practical point of view, clarifying the impact of economic policy uncertainty on the development of carbon emissions can help decision-makers to formulate policies to reduce carbon emissions and, at the same time, better evaluate and further adjust the implementation effect of policies to promote the construction of global green economy better and better promote the sustainable development and high-quality development of the global economy. At the same time, using sample data to analyze different regions, different regions can pay attention to their carbon emissions and rationally plan their emission reduction measures according to the relevant policies of neighboring countries to contribute to the green development of the global environment.
The following are the marginal contributions of our study:
(1) Regarding research methodology, we adopted a spatial econometric model to study the dynamic impact of economic policy uncertainty on regional carbon emission intensity. This approach takes into account geospatial interactions and spatial autocorrelation and can more accurately analyze the mechanism of the impact of carbon emissions between regions. The model allows for exploring the spatial association between economic policy uncertainty and carbon emissions and quantitatively assessing the extent of its impact. Unlike studies focusing only on spatial effects, we use effect decomposition to calculate direct and indirect effects, analyze whether such effects change over time, and study spatial-temporal effects.
(2) As for the content of the study, we conducted a detailed study and comparative analysis of economic policy uncertainty and carbon emission intensity in different regions of China. The study considers data from 30 provinces and focuses on the evolution from 2004 to 2017. The paper analyzes the data for this period and reveals the differences and instability in economic policy uncertainty and carbon emission intensity in different regions. It provides an essential reference for regional development and environmental policies.
(3) We explored the relationship between environmentally sustainable development and economic policies from the perspective of the impact of economic policy uncertainty on regional carbon emission intensity. Through an in-depth study of the mechanism of economic policy uncertainty on carbon emissions, the paper reveals the spatial transmission effect of economic policy uncertainty and the spatial clustering effect of local carbon emission intensity, which broadens the understanding of environmental economics and regional development. Meanwhile, we also put forward policy suggestions to cope with economic policy uncertainty in light of the differences between different regions, which is of practical significance to enhance the stability of regional carbon emission intensity.
The remainder of the paper is arranged as follows, and Section 2 reviews the literature and research assumptions. Section 3 describes the research design, including the model setting and variable selection process. Section 4 summarizes the empirical regression analysis process, including a benchmark regression, spatial autocorrelation of carbon emission intensity, spatial econometric model selection and regression results, heterogeneity analysis, and robustness tests. Section 5 shows the conclusions and makes corresponding comments.
Literature Review and Hypothesis Development
The Impact and Consequences of Economic Policy Uncertainty
Uncertainty about economic policy can be traced back as far as 1921. Knight strictly distinguished between uncertainty and risk and proposed that uncertainty refers to the risk that individuals or enterprises cannot accurately predict future gains and losses in economic activities [1]. Bloom et al. pointed out that, on the one hand, uncertainty is a vague concept. It reflects the uncertainty in the minds of consumers, managers, and decision-makers about the possible future. On the other hand, it is also a broad concept, which includes the uncertainty of macroeconomic indicators such as GDP growth and micro-level fluctuations such as corporate growth rate [2]. At the same time, non-economic events such as war and climate change are also considered uncertain. Gulen and Ion defined it as the inability of economic agents to accurately predict whether, when, and by what means the government will change existing economic policies [3]. Rao et al. proposed that the uncertainty of economic policies is caused by the uncertainty of the government’s future direction and implementation intensity, which are closely related to economic and social development and the production and operation of enterprises [4]. Based on the above research results, this paper defines the uncertainty of economic policies as the uncertainty of the time when the economic policies issued by the government will be issued, the direction of the policies and the intensity of their implementation, etc., which results in the economic subjects not being able to judge precisely the direction and trend of the future policy development, which is a hidden factor affecting the macroeconomic development.
From a macro perspective, most studies show that the uncertainty of economic policies will negatively affect macroeconomic indicators. Jin et al. conducted research using the factor-augmented vector autoregressive model. The empirical test shows that by reducing the expectation of economic entities for the future market, the uncertainty will harm macroeconomic indicators, including GDP, exchange rate, inflation, consumption, investment, exports, and house prices. Among them, the exchange rate and inflation were the most affected [5]. Jin and Zhang regressed the macroeconomic variables with the uncertainty index of four policies: finance, currency, trade, exchange rate, and capital account. Empirical research shows that the impact of uncertainty on economic output is significantly harmful [6].
From the micro perspective, enterprises’ investment behavior, cash holdings, and innovation are the main research objects in the existing literature. Bloom et al. proposed that when the investment is irreversible, the increase in uncertainty will lead to a significant decrease in the response of enterprises’ investment behavior to any stimulus policies [2]. Chen and Wang believe that the increase in capital cost and the reduction of the marginal rate of return are the two main ways to reduce the investment enthusiasm of enterprises under uncertainty [7]. Xu and Dong, based on the double difference propensity score matching model test, found that the negative impact of policy uncertainty on the investment decisions of private enterprises is more prominent [8]. Gulen and Ion pointed out that economic policy uncertainty hinders capital investment at this stage by increasing the return on deferred investment [9]. Rao et al. Considering that uncertainty will lead to a decrease in investment willingness on the one hand, and a more cautious investment attitude towards market expectations, on the other hand, will also improve investment efficiency [4].
The Influencing Factors of Carbon Emission Intensity
Current studies on the factors influencing carbon emissions are broadly categorized into the following areas: economic development and population growth, energy structure, industrial structure, technological level, level of financial development, policies, and regulations. Economic activities and industrial development are the primary sources of carbon emissions. Major economic sectors such as industry, transportation, energy production, and construction usually involve large amounts of energy consumption and combustion processes, thus releasing large amounts of greenhouse gases such as carbon dioxide. Population growth and changes in consumption behavior also affect carbon emission levels. A growing population increases the demand for energy and goods, which may lead to more carbon emissions. Moreover, changes in people’s propensity to consume, their mode of transportation, and their lifestyles all impact carbon emissions.
Energy structure plays a decisive role in carbon emission intensity. Different energy sources have different carbon emission factors; fossil fuels usually have high carbon emission factors, while renewable energy sources usually have low carbon emission. Therefore, transforming the energy mix is crucial for reducing carbon emissions. Optimization of energy consumption structure suppresses carbon emissions. Soytas and Sari suggest that increasing the share of clean energy in the energy consumption structure is a critical way to reduce carbon emissions from the manufacturing sector in Turkey [10]. Wang et al. used the scenario prediction method and Markov chain model to verify the carbon emission reduction effect of energy consumption structure optimization under various combination scenarios and found that the carbon emission intensity decreases to different degrees under all scenarios, which indicates that the optimization of the energy consumption structure has a particular potential to contribute to the achievement of carbon emission reduction targets [11].
Optimization of industrial structure is a critical way to reduce carbon emissions, and the results of Hammond and Brännlund et al. show that industrial upgrading of the manufacturing industry can significantly reduce carbon dioxide emissions and can play an essential role in achieving carbon emission reduction [12, 13]. Liu et al. constructed a PVAR model, and the analysis results show that the two-way interaction between industrial structure upgrading and carbon emission efficiency has basically been formed in the eastern region of China, while the coordinated development between the three variables has not yet been realized in the central and western regions [14].
Advanced technology and efficient energy utilization can reduce carbon emission intensity. Technological innovation can improve the efficiency of production and energy utilization and reduce carbon emissions per unit of output or consumption. For example, adopting energy-saving technologies, energy management systems, and cleaner production methods can reduce carbon dioxide emissions. Yang Lisha et al. pointed out from both theoretical and empirical analysis that technological progress is a significant contributing factor to achieving carbon emission reduction in China [15]. Yin He et al. argued that low-carbon technological progress ultimately promotes the realization of carbon emission reduction by promoting new energy research and development, optimizing energy structure, and reducing energy consumption intensity. In addition, by introducing economic level, energy structure, urbanization level, and other factors as threshold variables into the model, it can be found that there is also a specific threshold effect on the carbon emission reduction effect of low-carbon technological progress [16].
Financial development will affect carbon emissions. Katircioglu and Taspinar suggest that the government set long-term financial development and energy conservation and emission reduction goals and exert the carbon mitigation effect of financial development in the long term [17]. Based on the enterprise level, have pointed out that financial development reduces the cost of enterprise financing, and the expansion of reproduction by enterprises will increase energy consumption and raise carbon emissions [18-20].
Government policies and regulations have a significant impact on carbon emissions. Governments can influence the level of carbon emissions by formulating and implementing carbon pricing mechanisms, energy efficiency standards, greenhouse gas emission limitation policies, and measures to support the development of clean energy. The strength and effectiveness of policies and regulations play a crucial role in reducing carbon emissions. Deng investigates through spatial Durbin modeling that the strength of environmental regulations reduces carbon emissions, and the development of green finance similarly reduces carbon emissions and improves environmental sustainability [21].
Research on the Impact of Economic Policy Uncertainty on Carbon Emission Intensity
The research on the impact of economic policy uncertainty on carbon emissions is a little extensive at present. Jiang et al. estimated the relationship between EPU and carbon emissions for the first time using industry-level carbon emissions data in the United States. They believe that EPU can affect emissions through two channels: changes in environmental governance and damage to corporate performance. Through the first channel, enterprises will reduce their efforts to reduce emissions; through the second channel, a company’s emissions performance may be ambiguous: low emissions due to poor performance or high emissions due to a shift to cheaper but more polluting fuels. They found that the US EPU affects the uncertainty of carbon emissions and has a positive impact on the growth of carbon emissions at the tail of the emission growth distribution [9]. Adedoyin and Zakari used annual data from 1985 to 2017 to study the UK’s energy consumption and emissions framework. Research shows that the EKC hypothesis holds: low EPU will reduce the growth of carbon dioxide emissions in the short term, while the long-term effect is positive. They believe a higher EPU will hinder the company’s investment and economic growth, thus reducing environmental concerns. In a depressed environment, the industry will compensate for the low turnover rate by switching to cheaper energy for production. However, as time passes, as these industries increase their revenues, they may switch to cleaner energy for production, thereby reducing emissions [22].
Pirgaip and Dinçergök investigated the causal relationship between economic policy uncertainty (EPU) and energy consumption and carbon emissions in G7 countries and also explored the one-way causal relationship between energy consumption to carbon dioxide emissions. Based on the overall survey results, it is strongly recommended that the Group of Seven countries formulate policies to reduce energy consumption and carbon dioxide emissions according to the recent climate mission, considering the negative impact of EPU on energy conservation [23]. The study by Adams et al. the World Uncertainty Index is used to analyze the long-term relationship between economic policy uncertainty and energy consumption in countries with high geopolitical risk from 1996-2017. The results show that energy consumption and economic growth contribute to carbon dioxide emissions [24]. In addition, there is a significant correlation between economic uncertainty and carbon dioxide emissions in the long run. Based on the analysis of the panel noncausal test method by Dumitrescu and Hurlin, it is shown that there is a two-way relationship between carbon dioxide emissions and energy consumption, economic policy uncertainty and carbon dioxide emissions, economic growth, and carbon dioxide emissions [25]. Yu et al. estimated the impact of EPU on the carbon emission intensity of manufacturing enterprises using unbalanced panel data of enterprises and the newly-built provincial EPU index in China. They further tested channels through which EPU could affect the company’s emission intensity, including innovative channels, the share of fossil fuels in the total energy consumption channel, and energy intensity channels. The results show that manufacturers prefer to use cheap and dirty fossil fuels to cope with the growing EPU [26].
Based on social and political theory, Gray et al. mentioned in the article corporate social reporting CSR the data in the CSR report indicate the significant changes in social disclosure behavior during the whole period. The article’s explanation of these trends is inevitably speculative, and further research is needed on this vertical basis. In particular, corporate social responsibility is, at best, a marginal activity in corporate practice [27]. Social and environmental performance remains a relatively low priority for companies. Researchers have to ask the following questions: firstly, can the importance of corporate social responsibility be raised by paying more attention to such marginal activities? Secondly, whether this will provide an opportunity for the development of “anti-hegemony.” Social and political theory points out that enterprises will display appropriate information when facing external pressure from those interested in them. From this theory, we know that releasing information about carbon emissions will enable enterprises to show the outside world that they have good carbon emission performance. At the same time, it also meets the transparency requirements of other relevant parties.
Based on the fundamental option theory, Stewart Myers pointed out that the benefits generated by the cash flows are closely related to the use of current assets and the choice of future investment opportunities for an investment plan. This means that the company can obtain a new right in the future: to buy or sell its own physical goods or investment opportunities at a fixed price. Therefore, it can evaluate the investment in physical goods by evaluating general options. As the actual commodity is the object of the rights and obligations of both parties, the option is a real option [28]. Abel and Eberly used a news-based policy uncertainty index to demonstrate a strong negative correlation between corporate-level capital investment and the overall level of uncertainty, which is related to future policy and regulatory outcomes [29]. Policy uncertainty can inhibit corporate investment by causing a precautionary delay caused by the irreversibility of investment. When the investment cannot be reversed, the investment plan owned by the economic entity is regarded as the resources it owns, which is the view of fundamental option theory. When the EPU rises, the value of the options owned will be increased first, and the net benefits generated by “waiting” will be increased simultaneously. However, with a further increase in the value of the options, the economic entities will have higher marginal investment costs, and the net benefits of investment will then decrease.
Based on the signaling theory, Stiglitz observed that some people want to convey information. In contrast, others do not want to convey information, but “in either case, the fact that actions convey information will lead people to change their behavior, which is why information defects have such far-reaching impact.” The signal transmission theory provides a unique, practical, and verifiable point of view for social choice under imperfect information. If companies publish more information about carbon emissions, stakeholders will put less pressure on the environment [30]. For example, if companies or factories release information about carbon emissions and performance in advance, the pressure on the environmental control department will significantly reduce. Signal transmission theory points out that to send the signal of “environmental protection in low-carbon life” to the stakeholders, the senior management of the enterprise actively publishes relevant information, such as carbon emissions and carbon performance, so that investors can have a better assessment of the enterprise and have some influence on the decision-making of investors. Enterprises adopt high-energy consumption and low-cost production methods to reverse the expected downward net income trend due to EPU. At the same time, due to the lack of information disclosure, investors will maintain confidence in the investment in energy-intensive production. According to these theories, EPU will affect the economic entity’s external business environment, affecting the economic entity’s external business environment and the economic entity’s decision-making. At the same time, carbon emissions are closely related to the production decisions of microeconomic entities.
With the increase of EPU, the government’s attention on environmental governance will be shifted and reduced, and the implementation of some environmental protection policies will be adversely affected. For example, withdrawing the United States from the Paris Agreement will increase the EPU, which may affect the state government’s determination to reduce carbon emissions. Besides, EPU may damage the enterprise’s overall economic condition and performance. On the one hand, reduce economic demand for energy consumption and then reduce carbon emissions. On the other hand, due to the poor economic situation, businesses and residents may choose to use traditional and cheaper energy sources, such as coal and oil, which may produce more carbon emissions. In addition, facing the high EPU, enterprises can expect the government to relax the requirements on environmental governance, which may cause enterprises to make less effort to control carbon emissions.
Based on the above literature analysis, we put forward hypothesis H1: the increase of economic policy uncertainty will increase the regional carbon emission intensity, and the impact of economic policy uncertainty on carbon emission intensity has a spatial spillover effect.
Models and Variables
Data and Variables
Due to the availability and completeness of the data, we selected the data of 30 provincial-level regions except for Hong Kong, Macao, Taiwan, and Tibet from 2004-2017. All variables are derived from the EPS data platform, the WIND data platform, China Statistical Yearbook, China Environment Statistical Yearbook, and provincial statistical yearbooks. All continuous variables were winsorized (up and down 1%).
(1) Dependent variable: carbon emission intensity
The per capita CO2 emissions (metric tons per capita) proxied to carbon emission intensity. Carbon dioxide emission is an indicator of environmental pollution in the present research. CO2 emissions were calculated using the following formula:
where CE represents CO2 emissions; i denotes the different types of energy; Qi means the stand coal consumption of energy i; and Ci is the carbon emissions coeffcient of energy i. 44/12 represents the molar ratio of CO2 to C. The standard coal consumption (SCE) conversion coeffcient and CO2 emission coeffcient for different energy types are displayed in Table 1. The unit of heat conversion to SCE is tSCE/109 kJ; the unit of electricity conversion to CO2 emissions is 104 t C/107 kWh. Source: IPCC (2006).
Table 1.
Factors for different types of energy.
Table 2.
Variable Definitions.
(2) Core independent variable: economic policy uncertainty
The core explanatory variable is economic policy uncertainty (EPU). With reference to Yu et al.'s practice, the index selects the daily newspapers of 30 provinces (municipalities and autonomous regions) in China as the sources of news media reports, determines the basic entries about the uncertainty of economic policies by using the method of manual selection of high-frequency words and manual reading, calculates the proportion of annual target articles in 30 provinces (municipalities and autonomous regions) in economic articles, and then standardizes them to obtain EPU indexes of different provinces (municipalities and autonomous regions) [26].
(3) Control variables
In addition to core variables, we refer to previous relevant studies on the macro level, taking into account various characteristics of the region, including economic development, electricity level, investment level, openness level, consumption level, tax level, and fiscal level [31-33]. So we take a series of control variables into account in the empirical regression (Table 2).
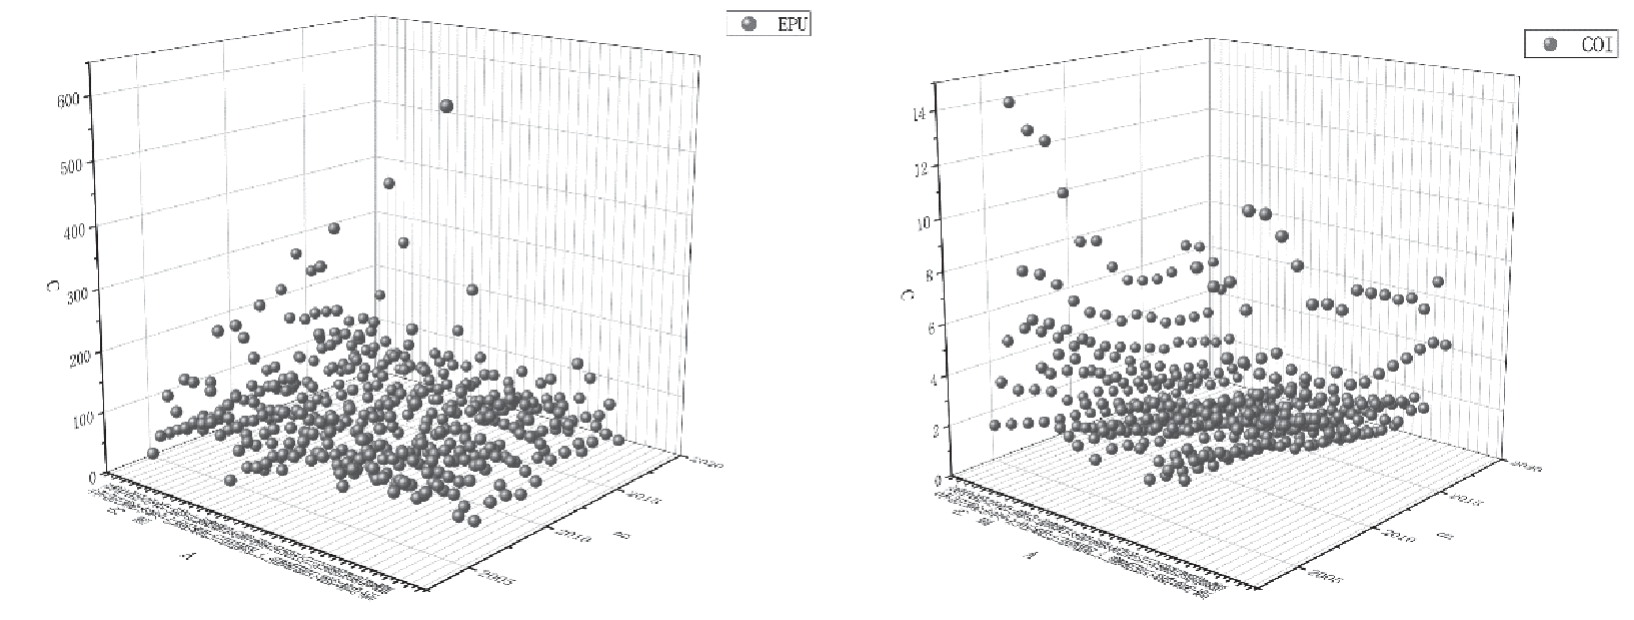
The descriptive statistics of the variables involved in this study are shown in (Table 3). In terms of carbon emission intensity, the average COI of China is 3.153, the maximum value is 11.93, and the minimum value is 0.610, which shows that, on the whole, the carbon dioxide emission intensity varies greatly among provinces in China. In addition, from the perspective of economic policy uncertainty, the average value of EPU is 4.473, the maximum value is 5.763, and the minimum value is 3.095, which shows that, on the whole, the economic policy uncertainty of different provinces in China varies greatly.
From the control variables, the average, maximum and minimum values of the economic development level (LNGDP) are 9.203, 11.22 and 6.372, respectively. It can be seen that the overall difference is small and the average level is high, indicating that the economies of various regions in China are still developing rapidly. The average value, maximum value and minimum value of ELEC are 1441, 5430 and 121.7, respectively, and there are some differences among different regions. The average, maximum and minimum value of investment level (INV) are 8.796, 10.79 and 5.930, respectively, and there are still some differences among regions. The average, maximum and minimum value of import and export level (OPEN) are 0.242, 2.087 and -1.765, respectively, which means that there are still great differences in the openness of provinces. The average, maximum and minimum value of total regional consumption (TCONS) are 8.816, 18.37 and 5.215, respectively, and the average, maximum and minimum value of RPI are 102, 107.6 and 97.86, respectively. It can be seen that there are some differences in consumption levels among provinces. The mean value, maximum value and minimum value of fiscal decentralization (PFD) are 0.515, 0.955 and 0.148 respectively, which means that there are great differences in fiscal levels among regions. In general, there is no abnormal value affecting the results.
Table 3.
Descriptive statistical analysis.
It can also be seen from the scatter chart that from 2004 to 2017, the uncertainty of economic policies in most provinces is on the rise (Fig. 1).
Model Structure
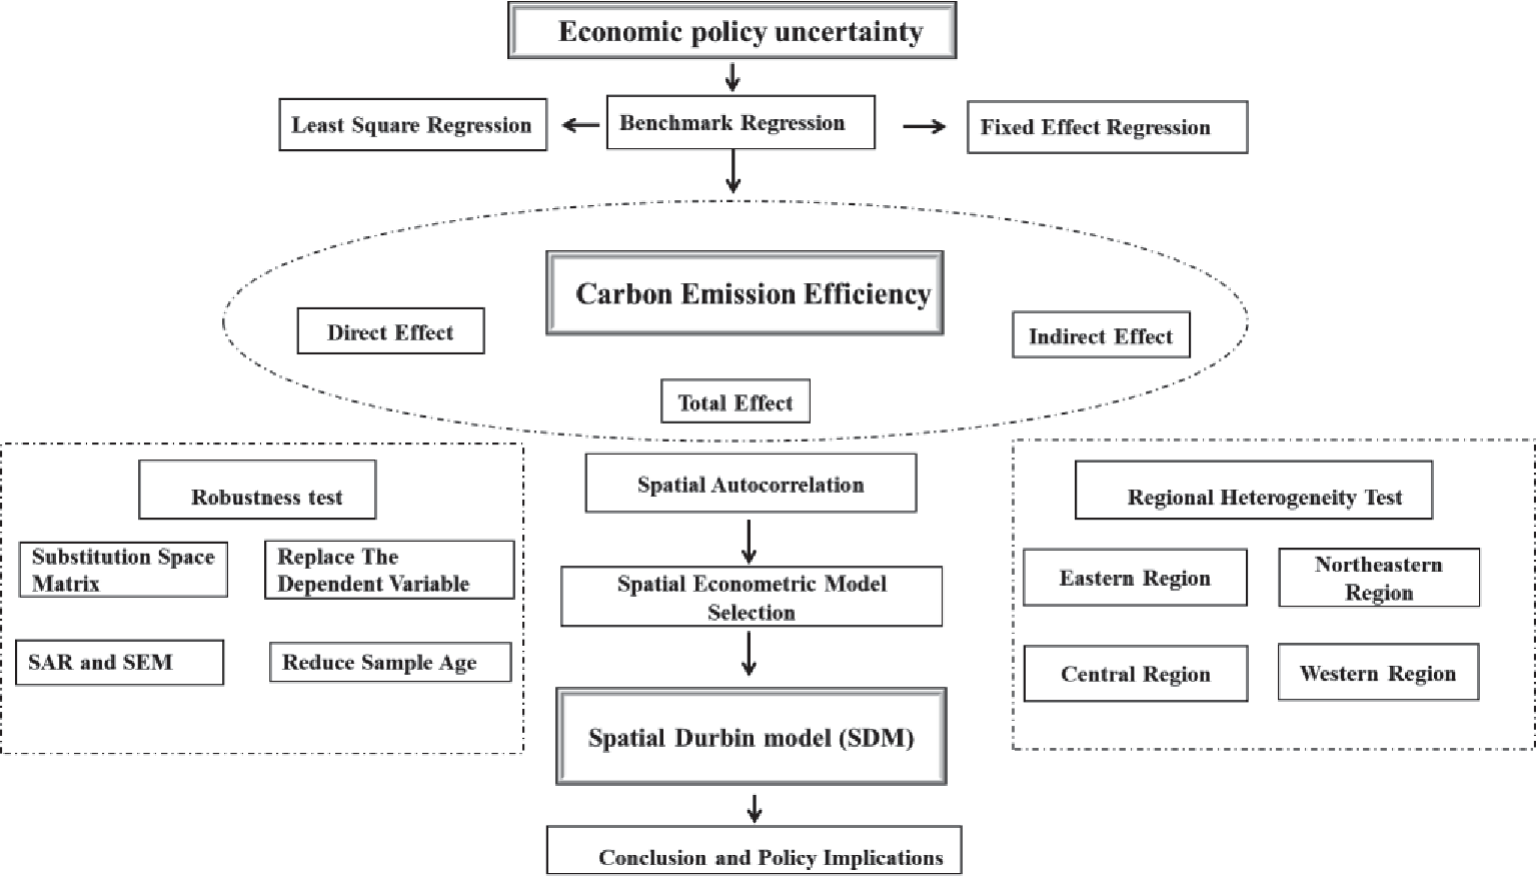
The spatial econometric model has a remarkable effect on the econometric analysis. We apply it to the impact of economic policy uncertainty on carbon emission intensity, and we can better analyze the neighborhood effect and mutual influence of its role. Our research framework of this paper in the materials and methods section is as follows (Fig 2).
First, we construct a standard econometric regression model without considering the spatial effect as a comparison. Its econometric regression model is as shown below:
Where the subscript i is the province with i = 1, 2, …, 30; t is the year with t = 1, 2, …, 16, which are the years from 2004 to 2017; EPUi,t represents economic policy uncertainty in the t year of i province, and Controls is the combination of control variables; λi, νt and εi,t are individual effects, time effects, and random error terms.
Then, the spatial Durbin model (SDM) is represented by the construction formula (4). Among them, EPUi,t represents economic policy uncertainty in the t year of i province, and Controls is the combination of control variables; ρ is the spatial autoregressive coefficient; λi, νt and εi,t are individual effects, time effects, and random error terms; W represents the spatial weight matrix. In this paper, the spatial adjacency matrix is selected to describe the spatial association between regions.
As shown in formula (5), W is a weight matrix expressed by adjacent binary. If the space is adjacent, it takes the value of 1. Otherwise, it takes the value of 0.
Results and Discussion
Benchmark Regression Result
This preliminary regression without considering the spatial effects is presented in Table 4. Columns 1-4 show the results of least square regression and fixed effect regression before and after adding control variables. It can be seen that the coefficient of economic policy uncertainty (EPU), the core explanatory variable, is significantly positive, indicating that economic policy uncertainty will significantly increase regional carbon emission intensity. The role of economic policy uncertainty in promoting carbon emissions has been initially confirmed, and it is valuable to continue to use the spatial measurement for further research.
Spatial Autocorrelation of Carbon Emission Intensity
The Moran’I index of carbon emission intensity space from 2004 to 2017 is shown (Table 5). The global Moran’I carbon emission intensity index is all significantly positive, with a significance level of 1%, indicating that carbon emission intensity will be affected by neighboring areas. Areas with intensity are adjacent to those with high intensity in space. It can also be seen from Moran’s scatter diagram that intensity presents a spatial distribution pattern of high-low-low aggregation (Fig. 3). From the value of the Moran’I index, it is kept between 0.122 and 0.245, which indicates that the positive spatial correlation of carbon emission intensity is relatively stable.
Spatial Econometric Model Selection and Regression Results
It can be seen that the P value rejects the original hypothesis, indicating that the spatial Durbin model (SDM) cannot be simplified into the spatial lag model (SAR). The spatial Durbin model (SDM) cannot be simplified into the spatial error model (SEM), so the spatial Durbin model (SDM) is selected. Furthermore, the p-value of the Hausman result of the spatial lag model is less than 0.1, which rejects the random effect. Therefore, we select the spatial lag model with a fixed product.
Table 4.
Benchmark regression result.
Table 5.
Global Moran’I index of carbon emission intensity.
As the coefficients estimated by the SDM model in Table 7 shows, most variables pass the significance test under the geographical proximity weight matrix. λ is the spatial autoregressive coefficient rho, and the statistical results of β coefficient are in the Main and Wx items in the table. After adding control variables, the spatial autoregressive coefficient is 0.400, which is significant at 1% and positive, indicating that the explained variable COI has a positive spatial spillover effect on itself. According to the statistical β value in Main, the coefficients of EPU are both significant, and the Wx term can better explain the spatial conduction effect than the coefficient of Main. Under Wx, the coefficients of EPU are both significantly positive.
The core explanatory variable, economic policy uncertainty (EPU), has a positive impact on carbon emission intensity of 1% after adding the control variable, indicating that economic policy uncertainty can significantly improve carbon dioxide emission intensity. When the EPU rises, the government will pay more attention to stabilizing economic development and overcoming the adverse effects brought by interest rate and exchange rate fluctuations, which will relax the intensity of environmental supervision. Enterprises tend to pay environmental fines and reduce investment in environmental research and development. The positive impact of EPU will lead to the relaxation of government regulation on the environment, which will ultimately have a positive impact on carbon emissions.
In order to further analyze the impact of economic policy uncertainty on carbon emission intensity, the direct effect, indirect effect and total effect under the spatial dobbin model are analyzed. Direct effect represents the degree of influence of variable X in the region on the interpreted variable Y in the region, total effect represents the degree of influence of variable change of one unit in all regions on the interpreted variable Y in the region, indirect effect equals to total effect minus direct effect, meaning the degree of influence of variable X change of one unit in the surrounding region on the interpreted variable Y in the region. The results show that EPU is significantly positive in direct effect, indirect effect and total effect. It indicates that each unit increase of EPU in this region will lead to an increase of 0.131 units of the interpreted variable COI in this region in direct effect and 0.078 units of the interpreted variable COI in this region in indirect effect. In the total effect, an increase of one unit of EPU in all regions can cause an increase of 0.209 units of the interpreted variable COI in this region. Once again, it is proved that the uncertainty of economic policy has a positive impact on carbon emission intensity, and its impact has spatial spillover effect.
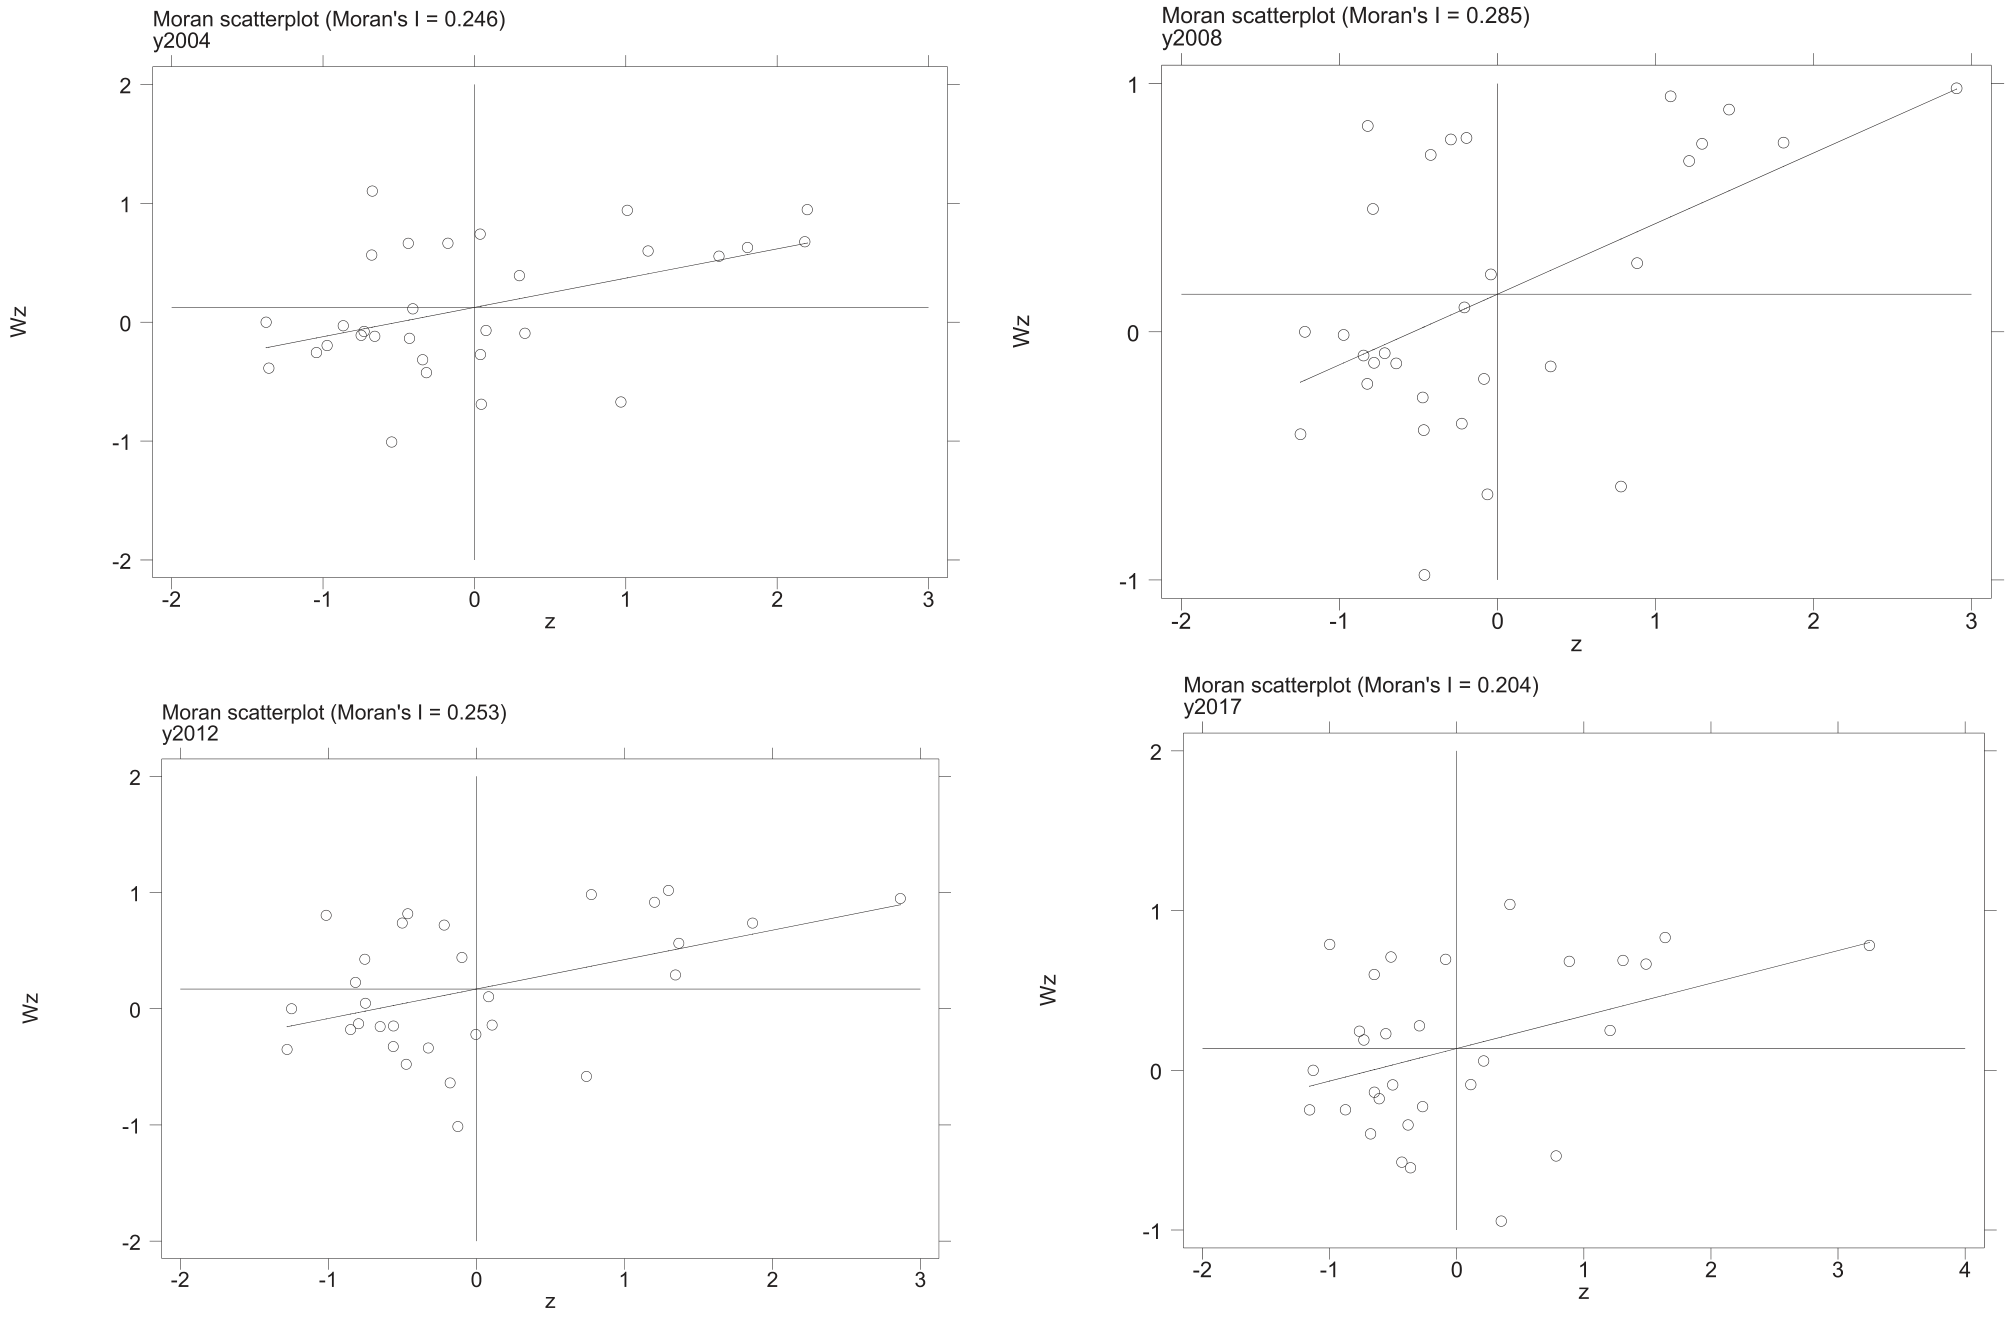
Table 6.
LM test results.
| Variable | Test | Statistic | P |
|---|---|---|---|
| COI | LM (Spatial error) | 52.95 | 0.000*** |
| LM (Spatial lag) | 44.89 | 0.000*** |
Table 7.
Spatial econometric regression results.
Table 8.
Decomposition of spatial effects.
Regional Heterogeneity Test
Due to China’s vast territory, the development of the eastern, northeastern, central, and western regions is not coordinated, and there are significant differences in economy, culture, science, and technology. The analysis results are not representative of the situation in each region. To analyze the impact of economic policy uncertainty on carbon emission intensity in different regions, this part uses the above methods to study different regions of China. The 30 provinces except Hong Kong, Macao, Taiwan, and Tibet, are divided into the eastern, central, western, and northeastern regions.
From the horizontal regression results, the influence coefficient of economic policy uncertainty on carbon dioxide emission intensity in the western region is 0.264, which is significant at the level of 5%, and the coefficient in the northeast is also significantly positive, while the coefficients in the eastern and central regions are not significant. It can be seen that the uncertainty of economic policy plays a great role in improving the carbon emission intensity in the western region, because on the one hand, with the uncertainty of economic policy, the environmental maintenance cost that society needs to bear will be transformed into the environmental protection cost that enterprises bear themselves, which makes enterprises reduce their expenditure on carbon emissions within the prescribed limits, and the relaxation of supervision also makes the carbon emission intensity increase; The eastern region of China has developed economy, a good economic environment and relatively stable regional development, and the impact of economic policy uncertainty is not great. The central region’s industrial structure system and economic development level are slightly lower than those in the eastern region, but it still has its own adjustment ability, so the impact of economic policy uncertainty on carbon emission intensity is not significant. Northeast China, as an old industrial area, has a large heavy industry. There are many state-owned enterprises in the heavy industry base in Northeast China, which are large in scale and shoulder great social responsibilities. It is greatly affected by the uncertainty of economic policies, and it is easy to increase regional carbon emissions under the condition of relaxed supervision.
Table 9.
Regional heterogeneity test.
Table 10.
Substitution space matrix and change the spatial regression model.
Robustness Test
For the robustness of the results, we then change the spatial matrix and introduce the geographic distance weight matrix. From the results (Table 10), we can see that the coefficient of EPU is significantly positive before and after adding control variables, that is, the increase of economic policy uncertainty will increase the intensity of carbon dioxide emissions. Consistent with the above, after adding the control variable, the spatial autoregressive coefficient is 1.771, which is significant at the level of 1% and is positive, indicating that the explained variable COI has a positive spatial spillover effect on itself.
Next, we change the spatial econometric regression method and use spatial lag model (SAR) and spatial error model (SEM) to verify the relationship between economic policy uncertainty and carbon emission intensity again. From Table 10 (3) and (4), the coefficients of EPU are all significantly positive, that is, the increase of economic policy uncertainty will increase carbon dioxide emission intensity.
For the robustness of the results, we then changed the explained variable, taking the regional per capita carbon dioxide emissions (PERCO2) as the explained variable. From the results (Table 11), we can see that the coefficient of EPU is significantly positive before and after adding the control variable, that is, the increase of economic policy uncertainty will enhance the intensity of carbon dioxide emissions. Consistent with the previous article, after adding the control variable, the spatial autoregressive coefficient is 0.586, which is significant at the level of 1%.
Table 11.
Replace the dependent variable and reduce sample age (2004-2014).
Since the introduction of the environmental protection law in 2015 may have an impact on our results, we shortened the sample life and chose the sample from 2004 to 2014 for regression based on the spatial Dobbin model. From Table 11 (3) and (4), the coefficients of EPU are all significantly positive, that is, the increase of economic policy uncertainty will increase the intensity of carbon dioxide emission.
Conclusions
This paper uses a spatial econometric model to evaluate the impact of economic policy uncertainty on carbon emission intensity based on the data from 30 provinces from 2004 to 2017. It considers the dynamic impact of economic policy uncertainty on carbon emission intensity based on fully considering spatial heterogeneity. The main conclusions are as follows: (1) For more than ten years, there have been significant differences and instabilities in economic policy uncertainty and carbon emission intensity in different regions of China. (2) China’s local carbon emission intensity shows an objective spatial aggregation effect, which is significant, spatially auto-correlated and clustered. (3) Based on the national level, economic policy uncertainty will significantly increase the regional carbon emission intensity. Additionally, economic policy uncertainty has a significant positive spatial spillover effect, which may increase carbon emission intensity in neighboring provinces. (4) Based on the provincial level, the impact of economic policy uncertainty on the carbon emission intensity of each region is significantly positive, with the most significant impact on the western region. Based on the above conclusions, the paper proposes policy suggestions to stabilize the regional carbon emission intensity in all directions.
To sum up, the Black Swan event, which caused economic policy uncertainty, is sudden, unpredictable, and destructive and will hurt regional economic growth, especially energy efficiency. To cope with the turbulent changes in the economic environment, reduce the impact of uncertainty on regional total factor energy efficiency, improve the anti-risk ability of regional economic development, and stabilize regional carbon emissions, this paper puts forward countermeasures and suggestions from the following aspects according to the problems found in the study:
First, strengthen the scientificity and feasibility of local economic policy formulation. Economic policy uncertainties vary significantly from region to region. To better cope with this situation, it is recommended that the government should strengthen the capacity and level of local data collection, monitoring, and analysis and establish a comprehensive and accurate data system on local economic conditions and policies to achieve scientific policy formulation and better policy implementation.
Second, develop differentiated and disaggregated environmental policies. In response to the current state of environmental health in different regions, the government is recommended to adopt differentiated and categorized environmental policies to improve the efficiency and quality of environmental management by continuously promoting scientific and technological innovation and industrial transformation and upgrading. In addition, the government should encourage and promote better participation of enterprises and people in environmental protection actions to jointly create an excellent ecological environment.
Third, strengthen the monitoring and regulation of carbon emissions and promote the application of clean energy. In response to the impact of economic policy uncertainty on national carbon emissions, it is necessary to strengthen the monitoring and regulation of carbon emission levels in each region based on national environmental policies, establish a carbon emission market mechanism with clear objectives and effective policies, and further promote the application and promotion of clean energy and low-carbon technologies to reduce carbon emission levels.
Fourth, establish a joint regulatory mechanism for carbon emissions and promote cross-regional environmental cooperation. Considering that economic policy uncertainties may impact cross-regional carbon emissions, the government should strengthen communication and cooperation among regions, establish a nationwide joint carbon emissions regulatory mechanism, promote the sharing and exchange of carbon emissions data, and promote the sustainable development of low-carbon emissions.
Fifth, preferential taxation and financial subsidies should be used to promote the reduction of carbon emission intensity. To reduce the carbon emission intensity of each region, the government can introduce preferential tax policies, financial subsidies for energy conservation and emission reduction, and other measures with clear objectives and effective policies while strengthening cross-sectoral and cross-departmental collaborative governance to achieve harmonious development of environmental protection and economic benefits.
Objective reasons limit our research and still have some shortcomings, so the research outlook is as follows:
1. Due to the limited data for measuring economic uncertainty at the province level in China, we can only obtain and calculate the data up to 2017, and future studies can actively update the data according to the objective situation in China.
2. Our study is at the province level; for China, the individual provinces have significant differences, and the differences between individual cities should be addressed. Therefore, it is of research significance to further analyze the relationship between economic uncertainty and carbon emission intensity at the city level.
3. Based on the spatial Durbin model, further research can also include exogenous shocks and analyze the relationship between the two by studying individual policies.

