

Introduction
With the rapid advancement of the economic and social landscape, Kunming, the provincial capital of Yunnan in southwestern China, located in the central region of the Yunnan-Guizhou Plateau, has entered a phase of accelerated urbanization. According to statistical data, over the past 25 years, Kunming City‘s total population has surged from 4.499 million to 8.6 million, marking an astounding increase of nearly 79.17%. Simultaneously, the urbanization rate has risen from 36.67% to 81.1%, reflecting an impressive growth of almost 121%. This swift urban expansion has resulted in a substantial increase in the built-up area of the city, accompanied by profound alterations in land cover and land use patterns. Consequently, Kunming City is confronted with ecological challenges, including vegetation degradation, water resource constraints, exacerbated desertification, and droughts induced by extreme weather events. Furthermore, a wealth of research indicates that the rapid urbanization process is also giving rise to issues such as soil erosion and the urban heat island effect, exacerbating a series of ecological and environmental problems [1, 2]. These ecological environmental issues will significantly impede the sustainable development of urbanized regions [3]. Therefore, it is of paramount importance to conduct timely monitoring and assessment of the ecological environment quality and its dynamic changes in Kunming City. This approach holds significant implications for achieving regional co-governance and joint protection of the ecological environment [4, 5].
Remote Sensing Technology has emerged as a potent tool for the effective assessment of regional ecological environments, owing to its wide monitoring scope, cost-efficiency, swift data acquisition, and ease of accessibility [6, 7]. As a result, numerous scholars have employed remote sensing to monitor urban heat islands, [8] vegetation coverage, [9-11] net primary productivity of vegetation, [12] leaf area index, [13] and other indicators to assess the state of ecological environment quality. However, due to the complexity of the study area and the diversity of factors influencing ecological indicators, these individual metrics exhibit significant limitations. They can only reflect specific aspects of the ecological environment characteristics and fail to provide a comprehensive portrayal of the overall ecological environment quality in the study area.Utilizing a combination of remote sensing monitoring, the quantification and assessment of the ecological environment status in the study area is more comprehensive, resulting in more objective and accurate evaluation outcomes [14-16]. Scholars both domestically and internationally have conducted extensive research on this subject, proposing various remote sensing monitoring techniques and assessment indicator systems for evaluating the ecological environment [17]. The RSEI (Remote Sensing-based Ecological Index) has garnered recognition from numerous scholars both domestically and internationally, and it stands as one of the most widely applied indices in remote sensing-based ecological environment monitoring. The RSEI was developed by scholar Hanqiu Xu in 2013, amalgamating indicators such as aridity, greenness, wetness, and warmth [18, 19]. RSEI, characterized by its non-arbitrary settings and the capacity to provide a reasonable reflection of regional ecological conditions, along with its visualization capabilities, has found wide-ranging applications [20]. The utilization of the RSEI index enables the rapid realization of ecological environment monitoring and comprehensive quantitative assessment in urbanized areas [21-23]. Presently, research pertaining to the ecological environment quality in Kunming City primarily revolves around ecological environment quality assessment and the analysis of the spatial pattern evolution of the ecological environment [24, 25]. Most of these studies commence from the year 2000 onwards. Nevertheless, there exists a notable dearth of long-term, systematic studies utilizing the RSEI for ecological environment quality monitoring and driving force analysis in Kunming City. Additionally, the research scopes tend to be relatively limited, often confined to smaller areas like the Dianchi Lake basin or specific county-level regions within Kunming City. An apparent gap exists in terms of comprehensive, long-term, and in-depth driving force analysis studies pertaining to the overall ecological environment quality of the entire city. Given the above analysis, this paper harnesses the Google Earth Engine (GEE) platform and leverages Landsat remote sensing imagery spanning from 1995 to 2019. It conducts a long-term dynamic monitoring of Kunming City's ecological environment quality over a 25-year period, scrutinizing its spatiotemporal variation patterns. The study delves into the impact of natural and socio-economic driving factors on changes in ecological environment quality. Ultimately, its objective is to provide scientific underpinning for prioritizing ecological environment quality planning in Kunming City and advancing the cause of sustainable ecological development.
Material and Methods
Study Area
Kunming City (24°23‘-26°22‘N, 102°10‘-103°40‘E), situated in the southwestern region of China, is located in the central part of the Yunnan-Guizhou Plateau, in the eastern part of Yunnan Province (Fig. 1). With an average elevation ranging from 1500 to 2800 meters, the city is surrounded by mountains on three sides, with Dianchi Lake to the south. The overall terrain exhibits higher elevations in the north gradually descending in a stepped manner towards the south. The city spans a maximum width of 140 kilometers from east to west and a maximum length of 220 kilometers from north to south. It is primarily characterized by plateau karst and plateau hill landforms, falling within the category of red soil highland regions. Covering an area of approximately 21,000 square kilometers, Kunming City experiences a subtropical highland monsoon climate, with an average annual temperature of 15ºC and an annual precipitation of 1035 millimeters. As the sole major city in Yunnan Province, Kunming City faces challenges due to its mountainous terrain and limited available land for development. The central urban area has already exceeded its planned population size, highlighting persistent contradictions between resources, environment, population, urban space, and economic development. The city‘s resource and environmental carrying capacity remains low. Certain regions within the city possess unique natural geographical features and exhibit fragile ecological environments. Issues such as soil erosion and desertification persist in some high mountain valleys, arid river valleys, and karst terrain areas. Additionally, extreme weather events, leading to drought and water shortages in certain years, further exacerbate these challenges. Furthermore, severe degradation of ecosystems in designated ecological conservation areas underscores the ongoing importance of ecological environment protection. The city‘s ecological security situation remains exceptionally demanding.
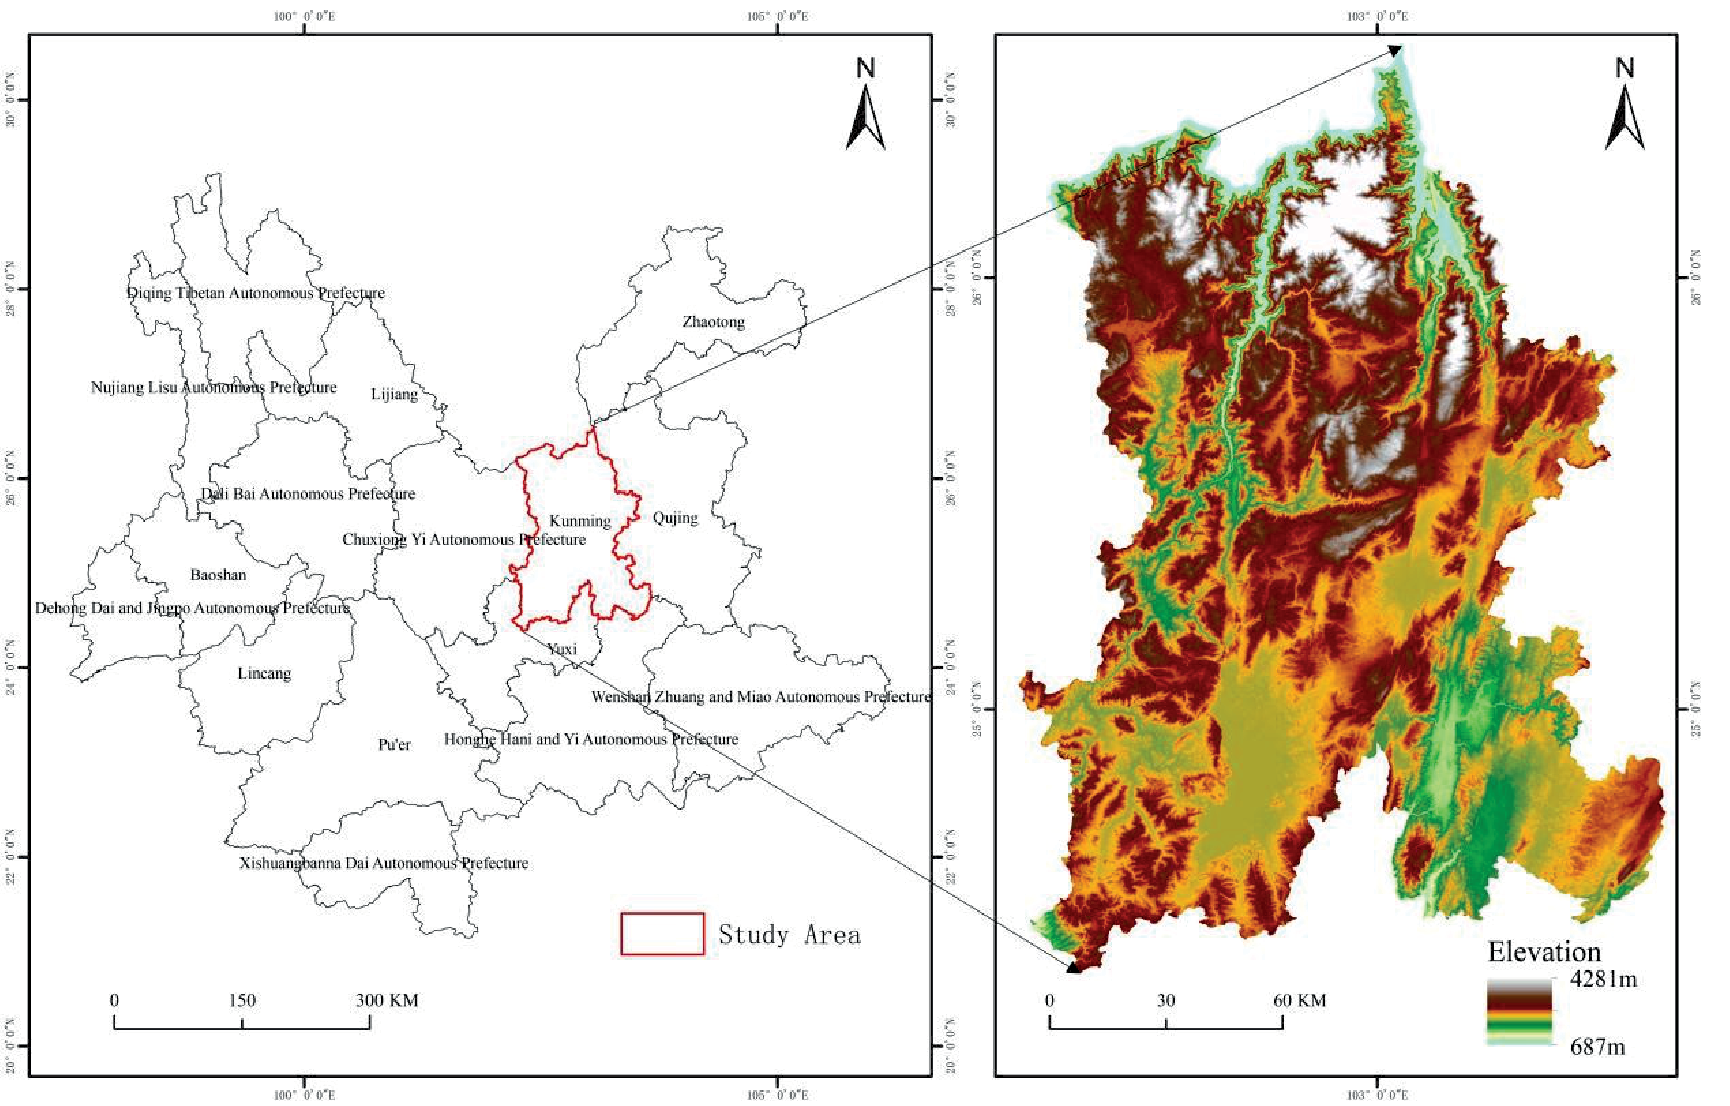
Table 1.
Index Source Description.
Data
The data used in the study mainly included 7 types of research-related data, such as (Table 1), including Landsat 5 and Lansat 8 remote sensing data synthesized from March-October average values in 1995, 2000, 2005, 2010, 2015, and 2019. Imagery, precipitation data, population and GDP data, basic geographic data and SRTM 30m data.
Methodology
Remote Sensing Based Ecological Index
The Remote Sensing-Based Ecological Index (RSEI), introduced by Hanqiu Xu, represents a novel remote sensing ecological index designed for the rapid monitoring and assessment of urban ecological conditions. It primarily encompasses four components: NDVI (Normalized Difference Vegetation Index), WET (Soil Moisture), NDBSI (Normalized Difference Built-Up and Soil Index), and LST (Land Surface Temperature) [18]. The greenness indicator utilized is the Normalized Difference Vegetation Index (NDVI), which effectively captures vegetation growth and vegetation coverage, along with other physical characteristics of vegetation. The moisture indicator (WET) signifies soil moisture and serves as a robust indicator of regional ecological environment quality. The aridity indicator (NDBSI) combines the Imperviousness Built-Up Index (IBI) and the Soil Index (SI), both contributing to surface „dryness.“ Finally, the temperature indicator represents Land Surface Temperature (LST), a critical parameter for studying factors such as drought severity, surface evaporation, ecological elements, and urban heat environments. By integrating these four indicators and assigning weights through Principal Component Analysis (PCA), the initial RSEI value is derived from the first principal component. This value is then subtracted from 1 and normalized to obtain the final RSEI, which is utilized for assessing the ecological environment quality in the study area.
Green Index
NDVI [26] the formula is as follows,
In this context, Landsat 5 TM labels Band 4 as ρNIR and Band 3 as ρRED. As for Landsat 8 OLI, Band 5 is tagged as ρNIR, while Band 4 is also tagged as ρRED.
Humidity Index
WET [27] the formula is as follows,
In this context, and WSWTL5 WSTL8 respectively, denote the humidity indices for Landsat 5 TM and Landsat 8 OLI. For Landsat 5 TM, ρBlue corresponds to Band 1, ρGreen corresponds to Band 2, ρRED corresponds to Band 3, ρNIR corresponds to Band 4, ρSWIR1 corresponds to Band 5, and ρSWIR2 corresponds to Band 7. In the case of Landsat 8 OLI, ρBlue is associated with Band 2, ρGreen is liked to Band 3, ρRED is related to Band 4, ρNIR is indicative of Band 5, ρSWIR1 pertains to Band 6, and ρSWIR2 corresponds to Band 7.
Dryness Index
NDBSI [28] the formula is as follows,
For Landsat 5 TM, ρBlue corresponds to Band 1, ρGreen corresponds to Band 2, ρRED corresponds to Band 3, ρNIR corresponds to Band 4, ρSWIR1 corresponds to Band 5, and ρSWIR2 corresponds to Band 7. In the case of Landsat 8 OLI, ρBlue is associated with Band 2, ρGreen is liked to Band 3, ρRED is related to Band 4, ρNIR is indicative of Band 5, ρSWIR1 pertains to Band 6, and ρSWIR2 corresponds to Band 7.
Heat Index
The heat is the surface temperature derived from the single-window algorithm [29, 30].
Li is the radiation value of the pixel in the infrared band, gain and bias is the gain value and offset value in the thermal infrared band respectively, DN is the gray value of the pixel; TN is the temperature value of the sensor. λ is the center wavelength of the band, ρ = 1.438×10⁻², ε is the surface emissivity. The calibration parameters of K1 and K2, In Landsat 5 TM, K1 = 607.76W/(m2 ∙ um ∙ sr), K2 = 1260.56K, whereas in Landsat 8 OLI, K1 = 744.89W/(m2 ∙ um ∙ sr), K2 = 1321.08K.
RSEI Composite Index [18]
Through the principal component analysis method, the principal components with a large contribution rate of the four indicators are taken out to obtain the initial ecological index RSEI0,
Then get the final index RSEI by normalization,
The RSEI index value is between [0-1], the closer the value is to 1, the better the ecology, otherwise, the worse the ecology.
Standard Deviational Ellipse
SDE (standard deviational ellipse) can accurately reveal the spatial distribution of geographical elements [31]. SDE can well display the spatial distribution of elements, reveal the centrality, directionality and other characteristics of geographical elements [32]. and is widely used in long time series large areas Research on the transformation law of space-time pattern [33]. In this paper, the standard deviation elliptic analysis is used to analyze the spatial evolution trend of the ecological environment quality change in Kunming City in the past 25 years, as well as the change direction and dispersion trend of the center of gravity. The formula is as follows [32].
The center of gravity (X̅ β, Y̅ β) of the standard deviation ellipse is,
The orientation angle θ is,
The x-axis standard deviation σx and the y-axis standard deviation σy are,
Where (xi, yi) is the spatial location of the research object, βi is the weight, and (xi, yi) is the coordinate deviation from the location of each research object to the center of gravity (X̅ β, Y̅ β).
Geodetector
Geodetector [34] is a statistical method used to detect spatial variability and reveal the driving force behind it. The formula is as follows, factor detection
i is the division of the ecological environment quality; Ni and N is the number of units in the i-th division and the whole area, respectively; σi2 and σ2 are the variance of the Y value of the i-th division and the whole area, respectively, and SSW and SST are the sum of variance within the layer (Within Sum of Squares) and Total Sum of Squares. 0≤q≤1, the larger the q value, the stronger the explanatory power of the driving factor x to the ecological environment quality y, and vice versa.
Interactive Detection
Interaction detection is mainly used to identify the interaction between different driving factors, and to evaluate whether the combined effect of driving factors X1 and X2 will increase or weaken the explanatory power of the ecological environment quality Y, or whether the impact of these driving factors on the ecological environment quality is mutual independent.To calculate the q values of the driving factors and on the ecological environment quality Y, q(X1) and q(X2); the q value resulting from the superimposition of driving factors X1 and X2 on q(X1) and q(X2) is calculated employing the following approach, q(X1∩X2). Comparing these three values allows for the identification of five specific interactions, q(X1∩X2)<Min(q(X1), q(X2)), Nonlinear attenuation. Min(q(X1), q(X2))<q(X1∩X2)<Max(q(X1), q(X2)), Single-factor nonlinear attenuation. q(X1∩X2)>Max(q(X1), Dual-factor enhancement. q(X1∩X2) = (q(X1) + (q(X2), Independent. q(X1∩X2)>(q(X1) + (q(X2), Nonlinear enhancement.
Results and Discussion
Spatial-Temporal Evolution of Ecological Environment Quality in Kunming City
Through principal component analysis of the RSEI index in Kunming City over the past 25 years (Table 2), it was found that the contribution rate of the first principal component (PC1) is consistently greater than 60%, integrating most of the indicator features, and it can be used to represent the comprehensive ecological environment quality of the study area. The mean value of RSEI in Kunming City from 1995 to 2019, as well as the normalized components (Fig. 2 and Table 3) indicate a trend of initial growth, followed by a decline, and then subsequent growth over the past 25 years. The mean value increased from 0.49 to 0.57, with an overall average of 0.52. The highest value was observed in 2019, while the lowest value occurred in 2005, indicating that the overall ecological environmental quality is in a moderate state, but the ecological conditions are continuously improving. Analyzing the individual components, NDVI and WET have a positive impact on ecological environmental quality, while LST and NDBSI have a negative impact. The mean NDVI value displays a pattern of initial growth, followed by a decline, and then subsequent growth, indicating an overall increasing trend. The highest value occurred in 2019, while the lowest value was recorded in 1995, signifying a continuous improvement in vegetation coverage levels. Likewise, the mean humidity demonstrates a trend of initial decrease followed by an increase, with its peak value observed in 2019 and the lowest value documented in 2000, suggesting a continual sufficiency of soil moisture. NDVI and WET have both increased by 0.14 and 0.11, respectively, indicating their positive contribution to the improvement of the ecological environment quality. The mean value of LST exhibits a declining-increasing-declining trend, with the highest value observed in 2010 and the lowest in 2019, indicating a continuous decrease in regional temperature.The average value of the bareness index reveals a steady decrease, with the maximum value occurring in 2005 and the minimum in 2019, pointing towards a continual reduction in bare soil. Furthermore, both the LST and NDBSI exhibit respective reductions of 0.24 and 0.13, underscoring their positive influence on the improvement of the ecological environment quality.
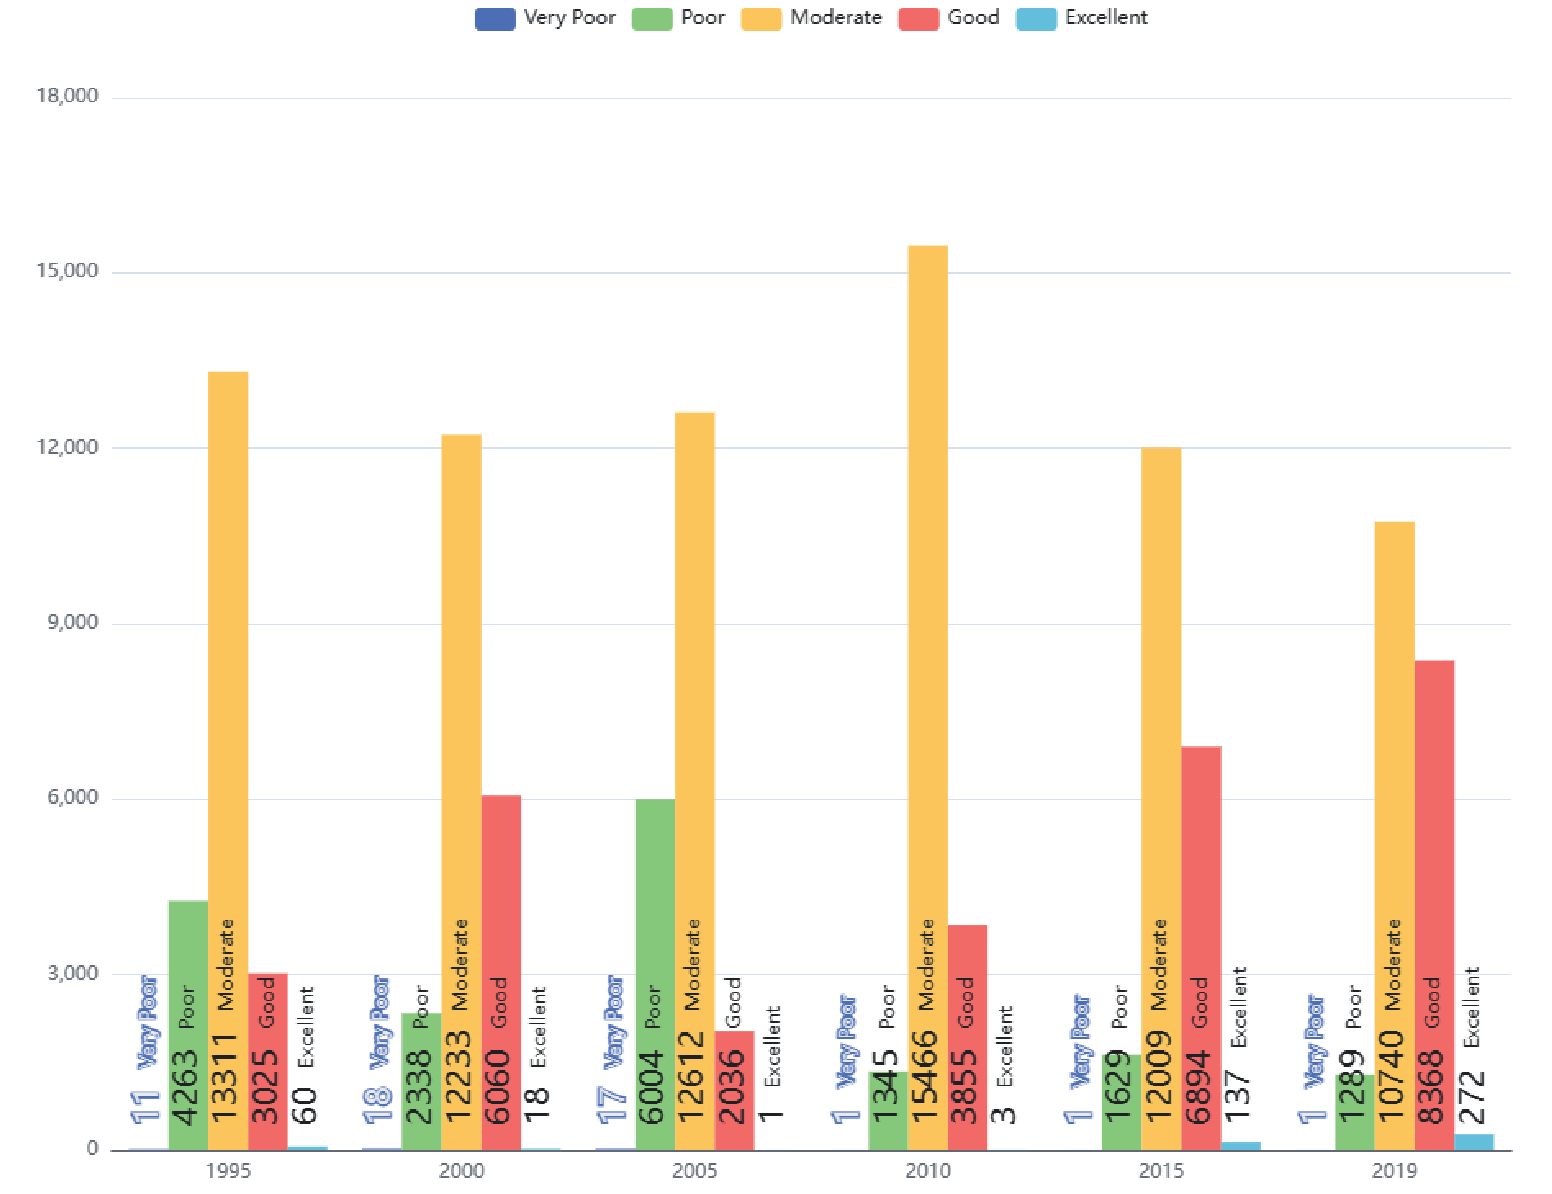
Based on Table 4, it is evident that over the past 25 years, the proportion of Kunming City's area characterized by poor ecological environmental quality has been less than 0.1% of the total area. With the exception of 2019, when it exceeded 1%, the area with excellent ecological conditions has remained below 1% in all other years. These findings suggest a scarcity of both unfavorable and commendable ecological environments within Kunming City. Apart from the years 1995 to 2005, during which the area with poor ecological conditions exceeded 10% of the total area, it remained below 10% from 2010 to 2019. Among these years, 2005 had the highest proportion of poor ecological area, amounting to 29% of the total area. More than 51.9% of Kunming City's total area exhibited moderate ecological conditions or higher, with the peak occurring in 2010 at 74.8% of the area. Except for a comparatively lower proportion in 2005, the area with a good ecological quality exceeded 10% of the total area in all other years, reaching 40.5% in 2019. In terms of ecological quality levels, the area distribution is as follows, moderate ecological area > good ecological area > poor ecological area > very poor ecological area > excellent ecological area.In summary, the overall ecological quality of Kunming City, except for the relatively poor year in 2005, has been largely located in the moderate and good regions in the remaining years. Especially noteworthy is the continuous increase in the area with a good ecological environment since 2005, indicating a sustained improvement in ecological quality.
Table 2.
Principal Component Analysis (PCA) of RSEI index for 25 years in Kunming City.
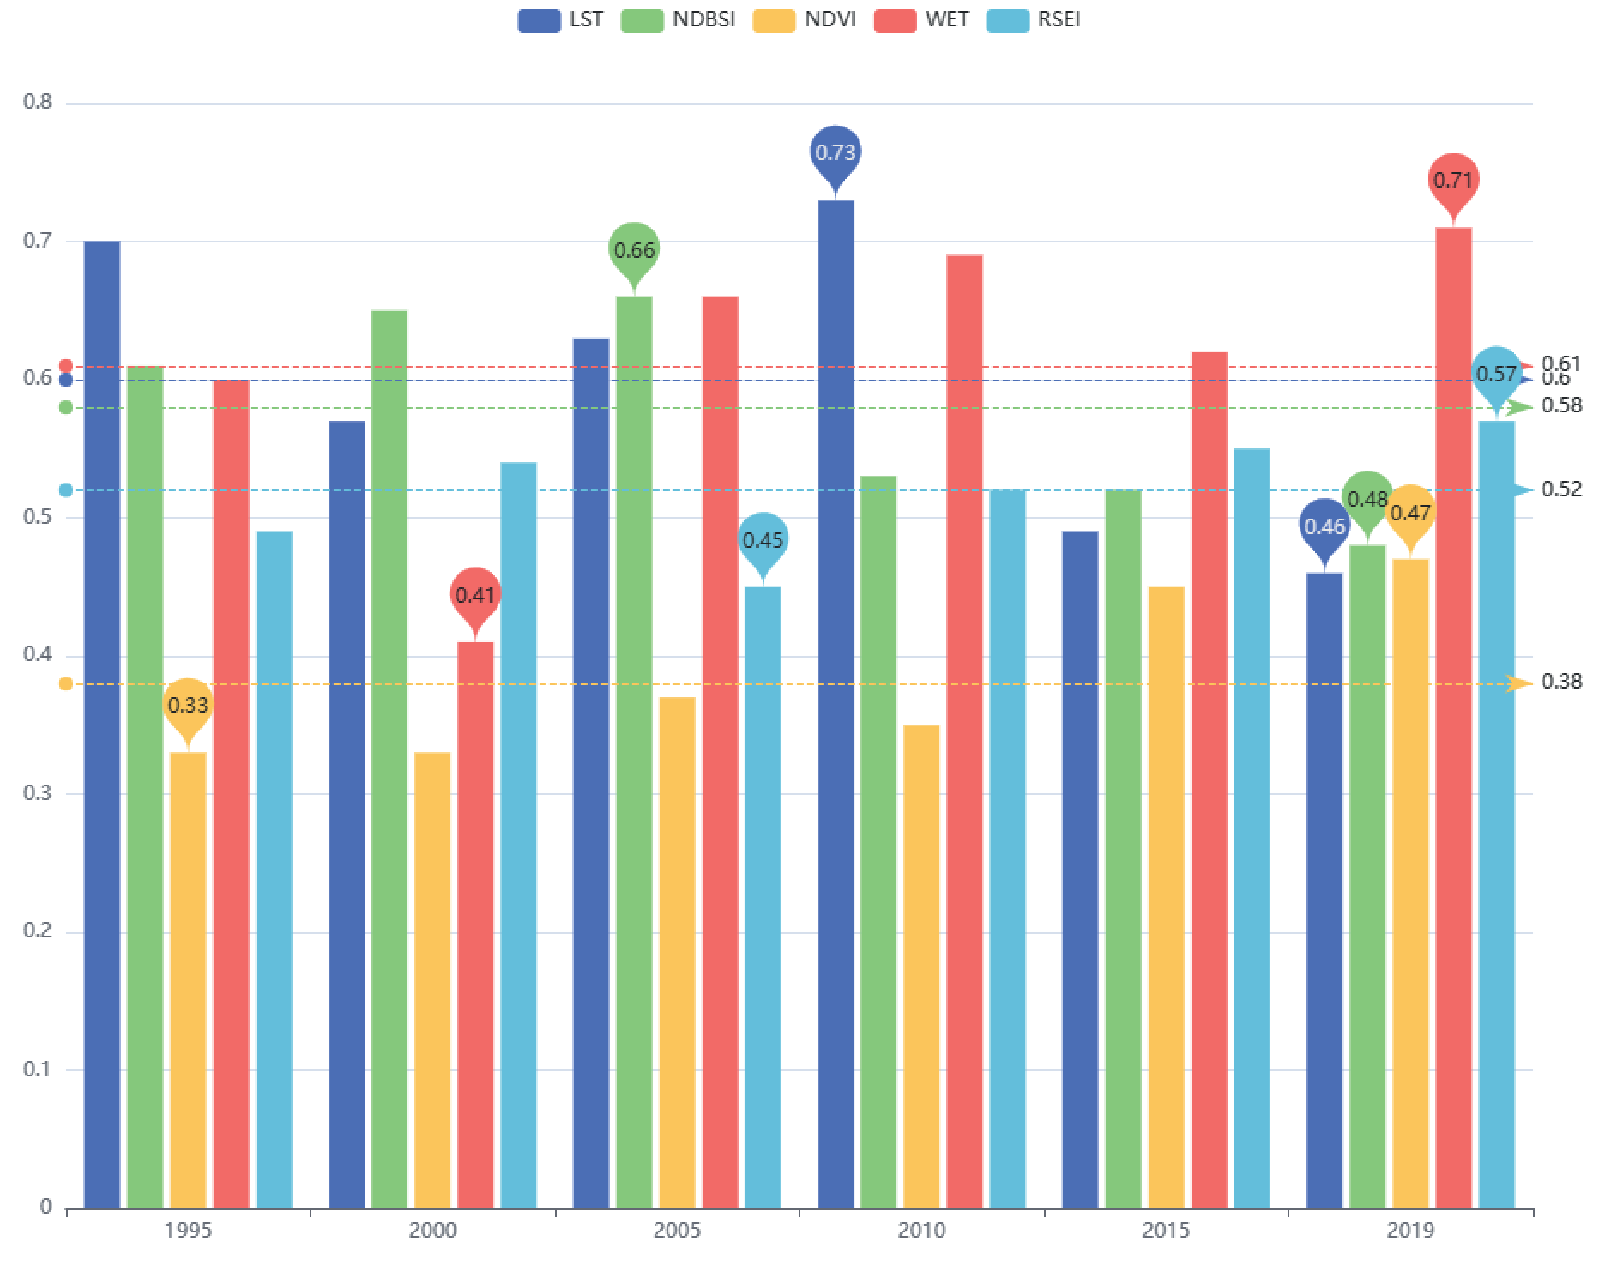
Table 3.
The average RSEI values for Kunming City from 1995 to 2019.
Table 4.
Distribution of ecological environment quality grades in Kunming City.
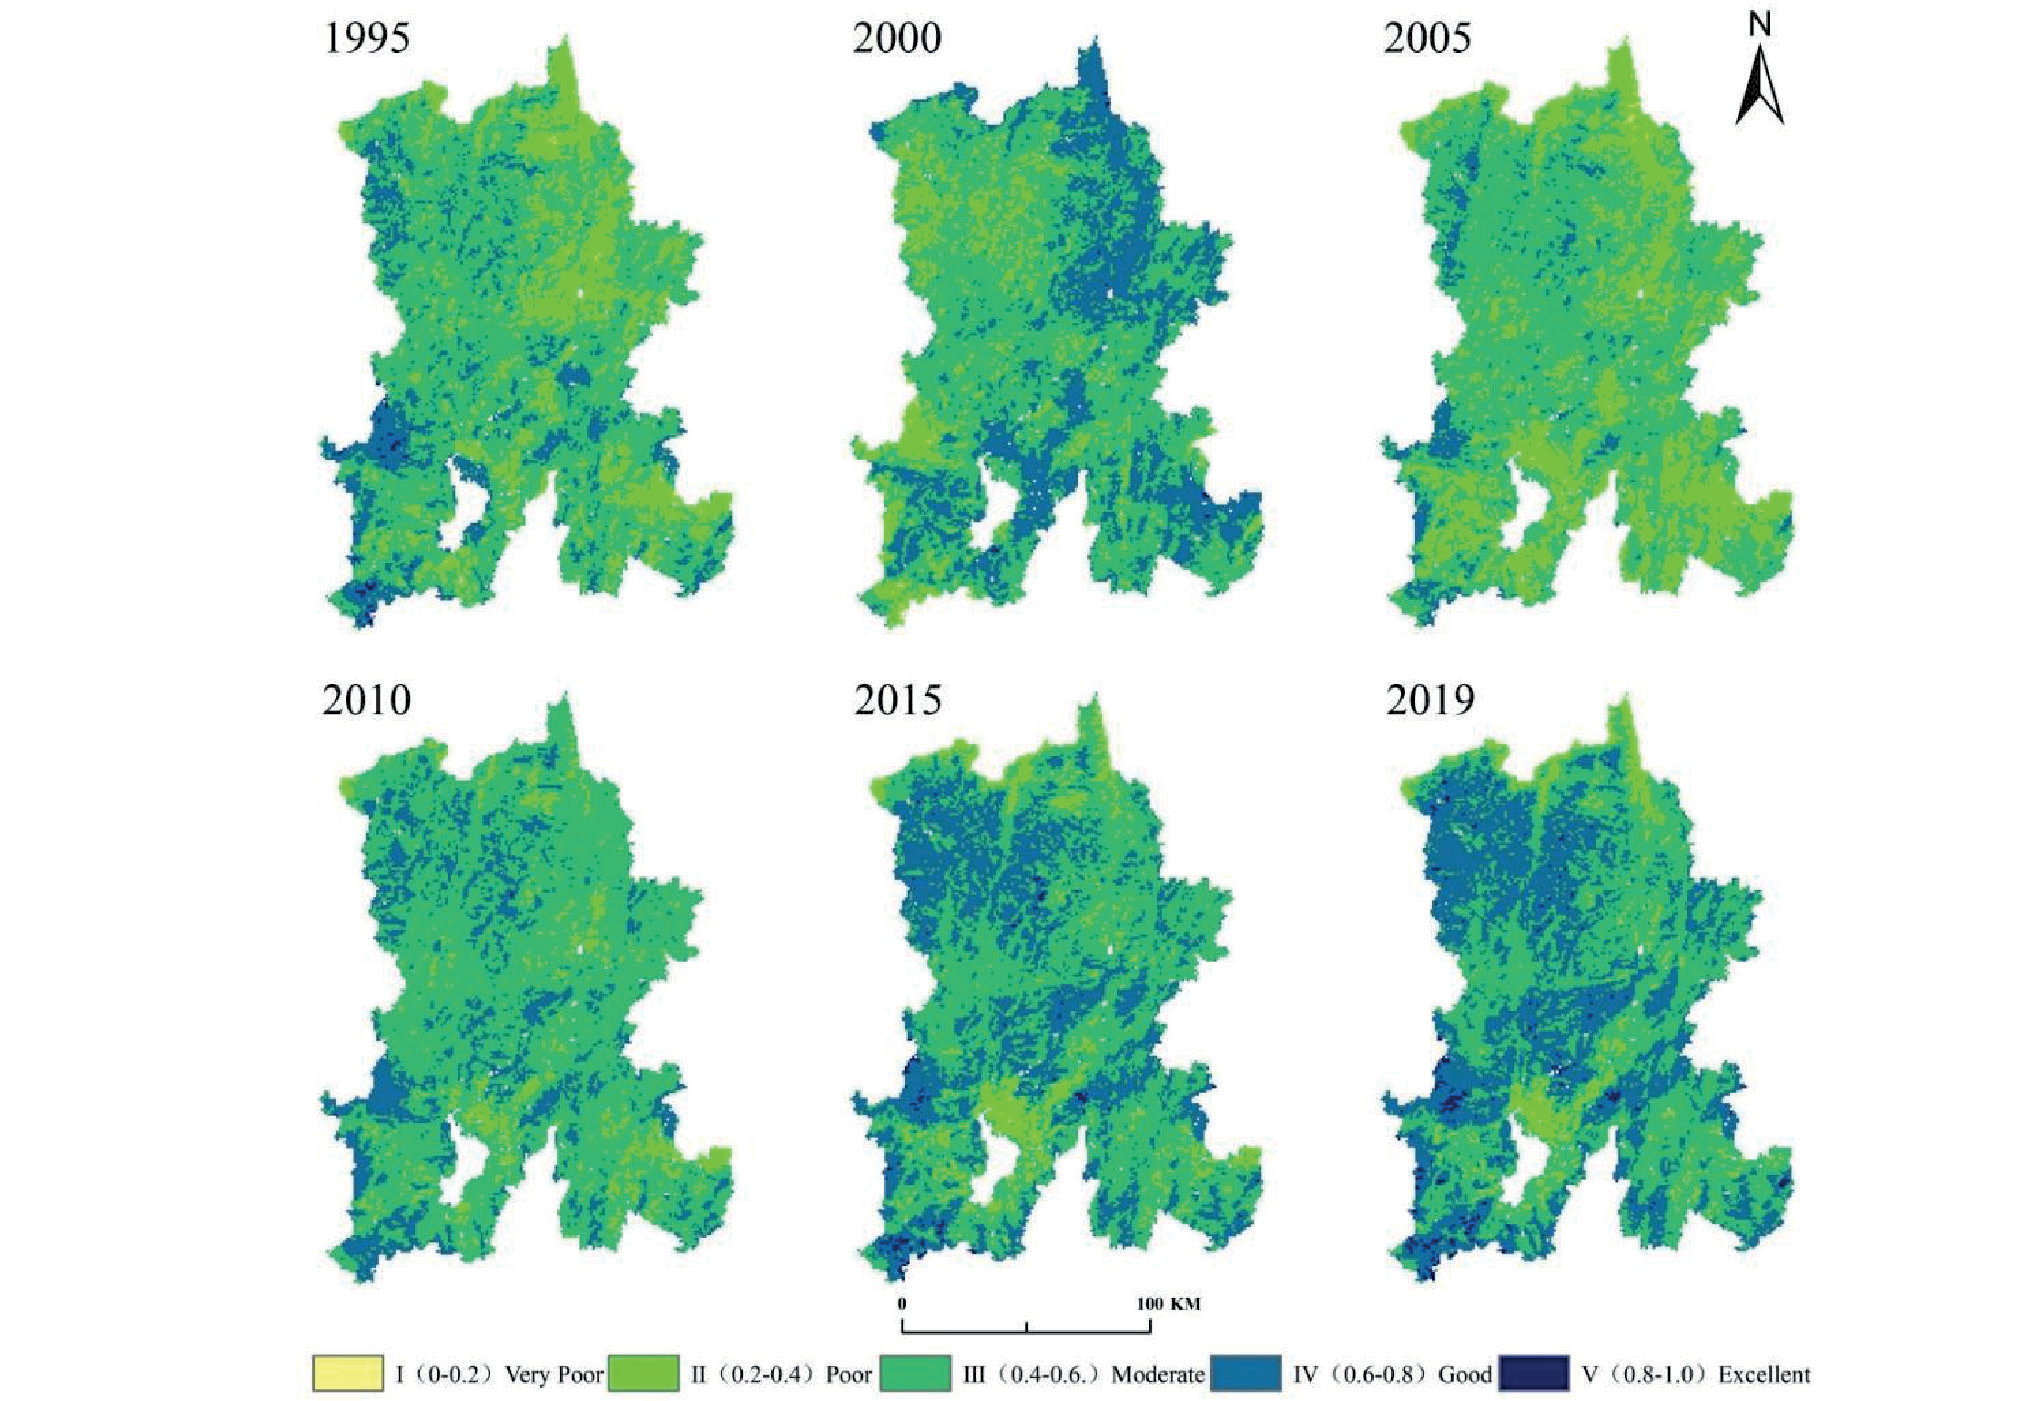
The temporal and spatial distribution of ecological environment quality in Kunming City can be observed from Fig. 3 and Fig. 4. Overall, the ecological environment quality from 2010 to 2019 is significantly better than that from 1995 to 2005. During the period of 1995 to 2005, the ecological environment quality in Kunming City was relatively poor. However, since 2005, there has been a continuous improvement in the ecological environment quality of Kunming City. From 1995 to 2005, the areas with relatively poor ecological environment quality in Kunming City were mainly concentrated in Dongchuan District, Xundian County, and Shilin County. Dongchuan District had a significant number of hot river valleys, resulting in severe soil erosion. Xundian County and Shilin County had specific areas affected by desertification erosion, leading to a low vegetation coverage. Particularly, 2005 was the year when the overall ecological environment quality in Kunming City was at its worst. Throughout the year, this region experienced the highest temperatures in almost 50 years, leading to a further expansion of areas with poor ecological environment quality. Among them, Dongchuan District, Songming, Chenggong, and Anning had an annual average temperature exceeding historical records and became the major regions with newly added areas of poor ecological environment quality. The rapid pace of urbanization and the densely populated urban areas also contributed to the newly added areas of poor ecological environment quality in that year. During the period from 2010 to 2019, substantial progress was made in various dedicated initiatives, including the expansion of afforestation, artificial reforestation, reforestation of barren hills, forest closure, targeted debris flow management, and control measures for areas affected by desertification. These efforts resulted in a notable rise in forest coverage and effective soil erosion control within the research area. Consequently, there was a consistent enhancement in the overall ecological environment quality, which also exhibited a relatively wide-scale impact. Meanwhile, areas with consistently poor ecological environment quality remained relatively concentrated, primarily located in specific dry and hot river valleys within Dongchuan District. Moreover, urban areas undergoing rapid expansion and characterized by high population density, such as Wuhua District, Guandu District, Chenggong District, and Panlong District, also experienced subpar ecological environment conditions. The spatial distribution of Kunming City's ecological environment quality over a span of 25 years demonstrates the significant influence of topographic conditions, climate factors, and urban expansion on the overall ecological environment quality.
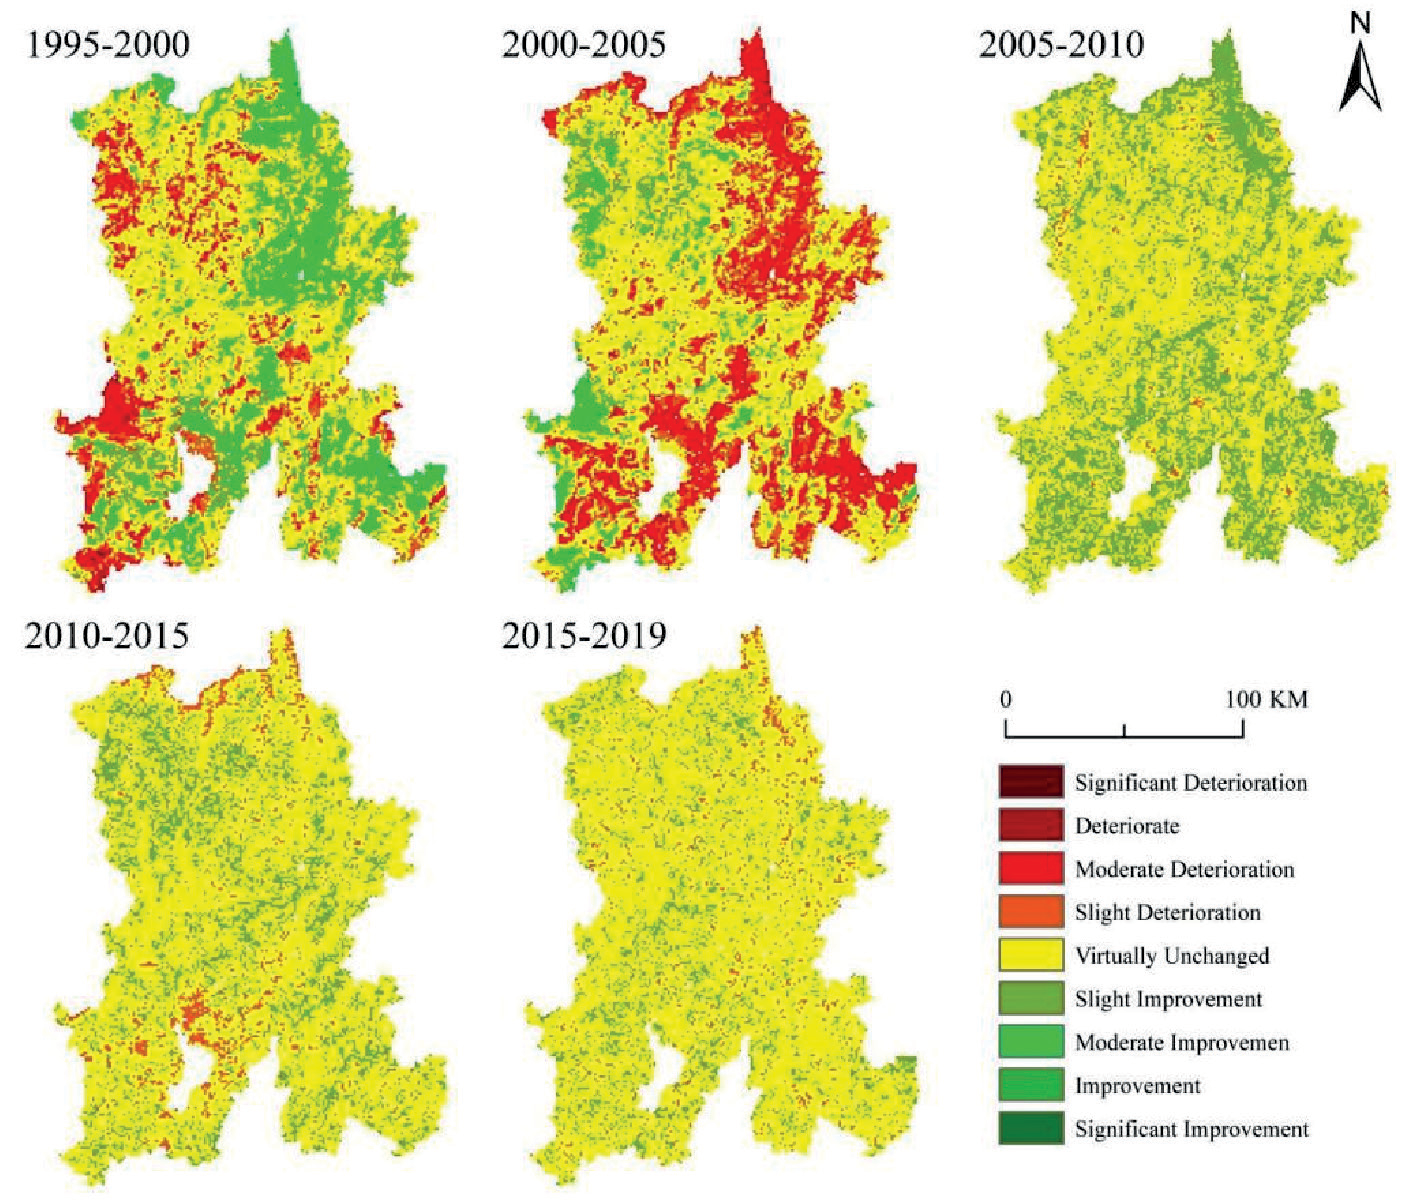
It can be inferred from the Fig. 5 that during the period from 1995 to 2000, over half of the regions in Kunming City witnessed changes in ecological environment quality. The areas significantly deteriorating and experiencing deterioration were primarily concentrated in Xishan District, Jinning District, Anning City, Fumin County, and Shilin County. The deterioration in ecological environment mainly manifested as moderate deterioration and slight deterioration, affecting the entire Kunming City. The types of ecological environment improvement mainly concentrated on slight improvement and moderate improvement. In terms of spatial distribution, the areas with improved ecological environment outweighed the areas with deteriorated ecological environment. From 2000 to 2005, more than half of the regions in Kunming City experienced changes in the quality of the ecological environment, with significant deterioration and deterioration mainly concentrated in Dongchuan District, Jinning District, Xundian County, and Shilin County. The types of deteriorated ecological environment mainly focused on moderate deterioration and slight deterioration. The areas with deteriorated ecological environment showed a substantial increase compared to the period of 1995-2000, and in terms of the proportion of spatial distribution, the areas with deteriorated ecological environment were greater than the areas with improved ecological environment.Since 2005, the ecological environment quality in Kunming City has significantly improved, without any significant or deteriorated areas. From 2005 to 2010, more than half of the areas maintained an unchanged ecological environment quality, with only a few areas exhibiting slight deterioration. The majority of regions witnessed slight improvement in the ecological environment quality. From 2010 to 2015, the areas with unchanged ecological environment quality further expanded, with a slight increase in areas experiencing slight deterioration compared to the previous year, and a reduced number of areas showing slight improvement. From 2015 to 2019, the ecological environment quality in Kunming City remained relatively stable, with a decrease in areas with slight deterioration compared to the previous year, and a decrease in areas with slight improvement as well.
Spatial Autocorrelation Analysis of Kunming City's Ecological Environment Quality
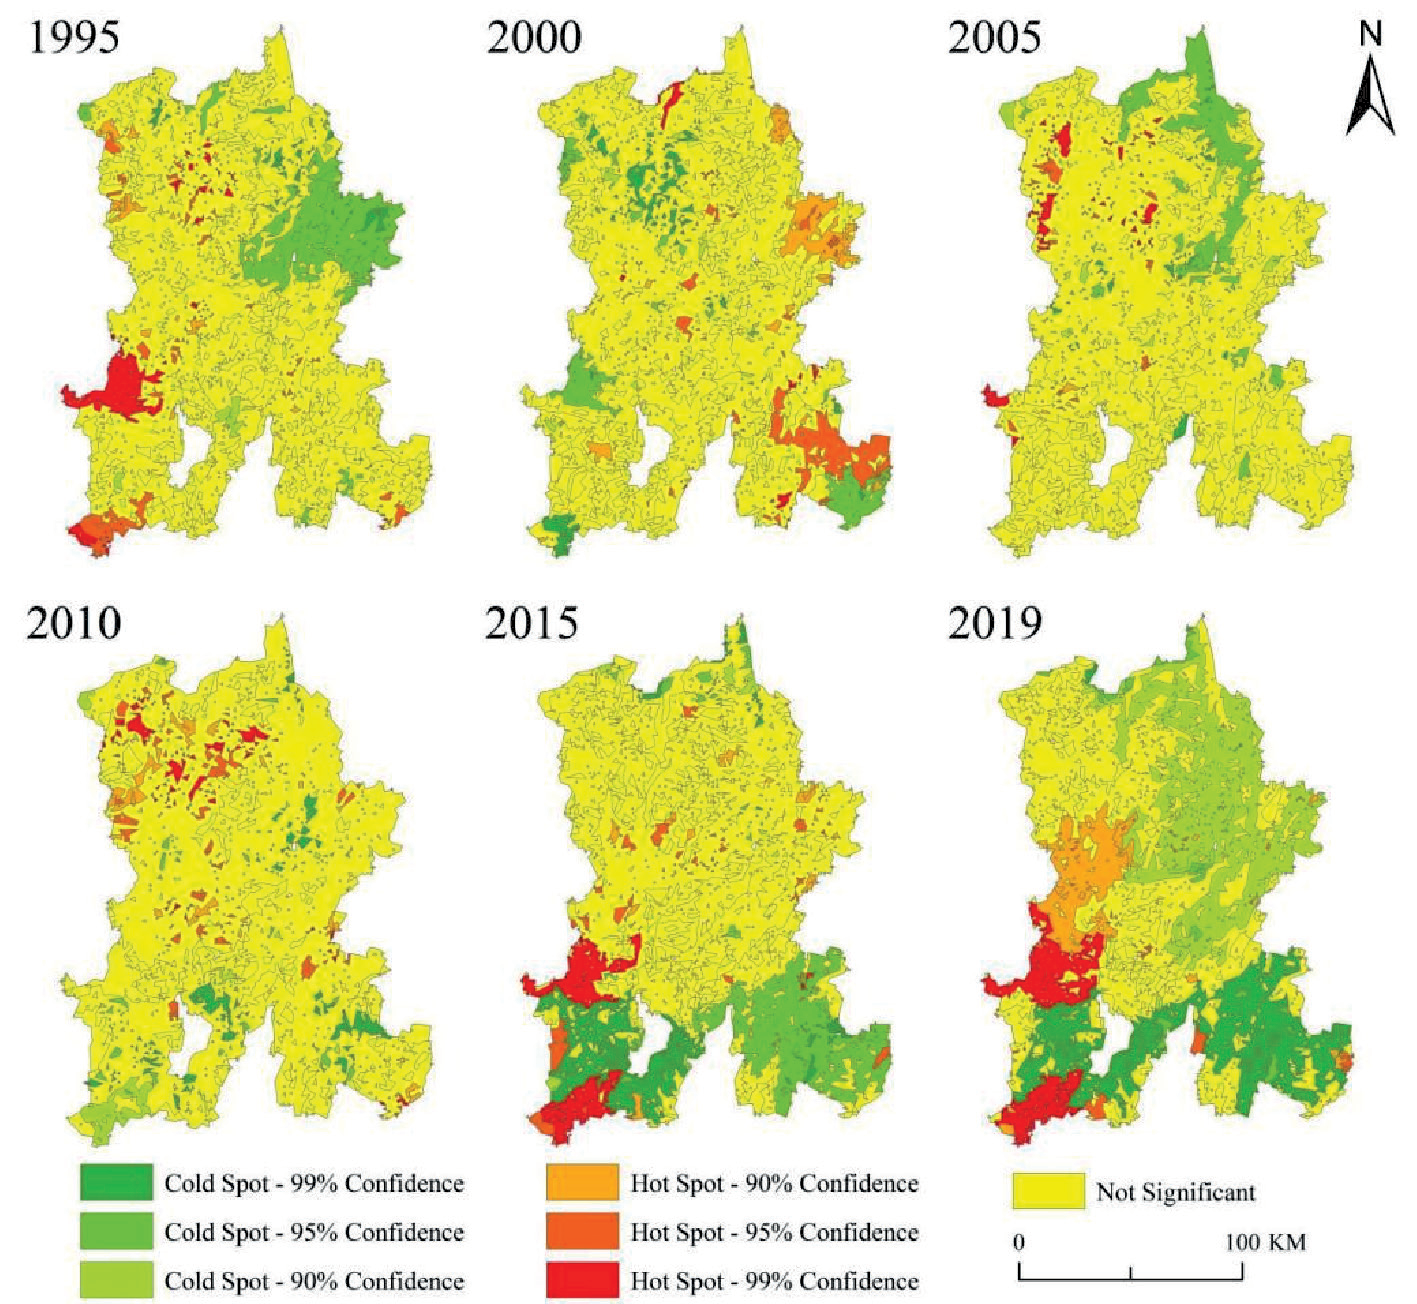
Based on Hot and Cold Spot Spatial Analysis to Explore the Distribution Patterns Over the Past 25 Years. The analysis of the results (Fig. 6) reveals a distinct spatial clustering pattern in the ecological environment quality of Kunming City. It becomes evident that regions with lower ecological environment quality tend to exhibit cold spots, whereas regions with higher ecological environment quality are predominantly characterized as hot spots. Additionally, there are considerable spatial disparities in the distribution of hot and cold spots across different years. In 1995, the cold spots were primarily concentrated in the eastern part of Kunming City, specifically in Xundian County, while the hot spots were concentrated in certain areas of Xishan District, Anning City, and Jinning District in the southwest.During 2000, the areas with a concentrated distribution of cold spots mostly converted from hot spot areas observed in 1995. Additionally, there was an expansion of cold spot areas in portions of Lujun County in central Kunming City and in certain regions of Shilin County in the southeast. Hot spot areas were primarily concentrated in sections of Xundian County and Yiliang County. In 2005, the cold spots were primarily located in the Dongchuan District and some parts of Xundian County in the north-central area of Kunming City. The hot spots, on the other hand, were relatively scattered, with some concentration in the western region of Kunming City, particularly in the areas of Luquan County and Anning City.In 2010, the distribution of cold and hot spots at the regional level exhibited a relatively small area, without any noticeable clustering effect, thus indicating a more scattered pattern.
During 2015 and 2019, there was a significant clustering effect observed in both cold spot and hot spot areas. The cold spot areas showed a relatively consistent pattern, with the majority of the regions concentrated in the southern areas of Kunming City, including Shilin County, Chenggong District, Jinning District, Xishan District, and Anning City. In contrast, the hot spot areas expanded further, mainly concentrating in Fumin County, Jinning District, Anning City, and Xishan District of Kunming City.
Transition of Ecological Environment Center and Standard Deviation Ellipse (after calculating the mean RSEI at the county level in Kunming)
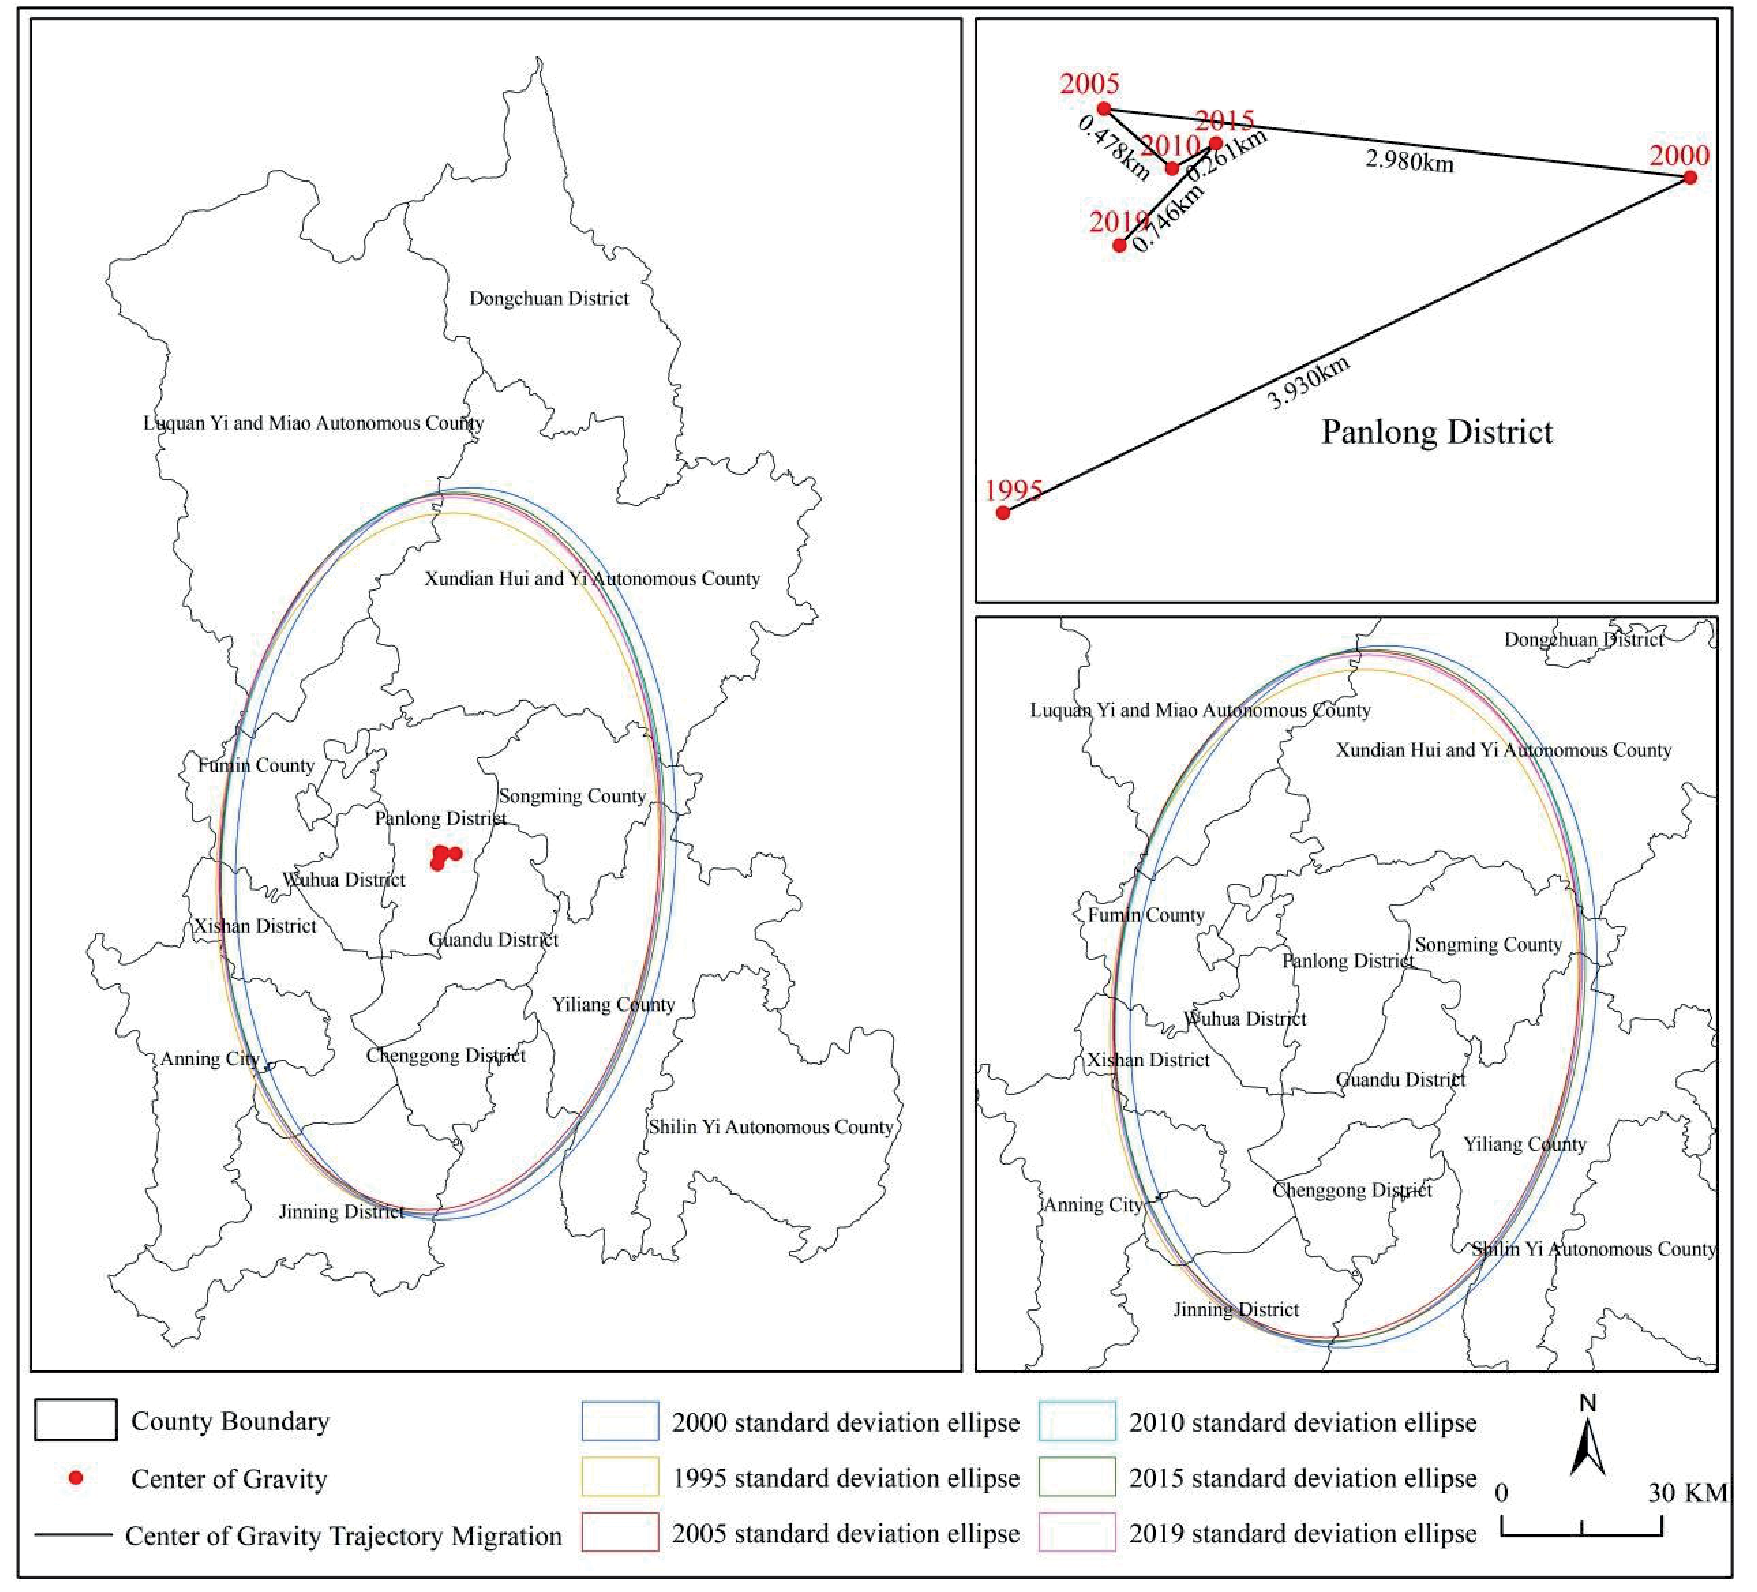
By plotting the standard deviation ellipses and the trajectory of spatial center shift of ecological environment quality in Kunming City from 1995 to 2019 (Fig. 7), this study provides insights into the spatial distribution characteristics and temporal trends of ecological environment quality. Over the period from 1995 to 2019, the ellipses showed closely spaced centers and a prevailing north-south major axis orientation, indicating the prevalent spatial distribution of ecological environmental quality in this orientation. Furthermore, the ellipses exhibit a substantial elongation, highlighting a noticeable directional preference. Furthermore, the orientation of these ellipses closely aligned with that of the Dianchi Lake Basin, indicating a significant association between ecological environment quality and the Dianchi Lake Basin. In comparison to other years, the degree of southward displacement of the standard deviation ellipse was notably greater in 2000. This can be attributed mainly to the rapid urbanization and expansion of Kunming City, which commenced in the same year. Nonetheless, the period after 2005 witnessed a stabilizing trend in the ecological environmental quality of Kunming City, as a result of intensified efforts and gradual execution of policies for ecological civilization development. The center of gravity for ecological environmental quality, mostly, fell near Kunming City's Panlong District in the majority of years, a consistent outcome observed from the standard deviation ellipse. This observation reflects a satisfactory level of spatial consistency. Examining the alterations seen over a period of 25 years, the center of gravity exhibited a predominantly steady pattern with minimal changes, maintaining an overall north-south orientation. Comparatively reviewing the variations, it was noted that the coverage area of the standard deviation ellipse displayed a tendency of initial decrease, subsequent increase, and then following decrease again – indicating an overall trivial degree of fluctuation.
Analysis of the Driving Forces Behind Ecological Environmental Quality in Kunming City
Exploration of the Influence of a Single Driving Factor
According to the information displayed in the Fig. 8, Analysis of the Impact of Various Factors on the Spatial Distribution of Ecological Environmental Quality from 1995 to 2019 reveals different rankings among these factors. In 1995, the ranking was as follows, GDP> population>precipitation>slope>aspect. In 2000, the ranking changed to, precipitation>GDP>slope>popu lation>aspect. In 2005, the ranking shifted to, popul ation>slope>precipitation>GDP>aspect. In 2010, the ranking was, slope>population>precipitation>GDP>as pect. Finally, in 2019, the ranking became, slope>GDP >population>precipitation>aspect. Slope, precipitation, population, and GDP emerged as the primary driving factors shaping the spatial distribution of ecological environmental quality within the region.In 1995, GDP was identified as the primary driver for the spatial distribution of ecological environmental quality within the region. By 2000, precipitation emerged as the primary influencing factor for the spatial distribution of ecological environmental quality. Subsequently, in 2005, population became the main driver for the spatial distribution of ecological environmental quality within the region. Moving forward, during 2010, 2015, and 2019, slope gradient demonstrated its dominance as the primary influencing factor for the spatial distribution of ecological environmental quality within the region with explanatory power exceeding 10%. During the period of 1995 to 2019, the influence of slope direction on ecological environment quality was observed to be relatively insignificant.
By conducting an interactive detection analysis using a geographical detector, the interaction among various factors influencing the ecological environmental quality in Kunming city was examined. As shown in Fig. 9, the interaction between two factors enhances the explanatory power for the ecological environmental quality. In 1995, the interaction between GDP ∩ population (0.233) and the interaction between GDP ∩ precipitation (0.198) had a significant impact on the ecological environment quality in Kunming City. This indicates that the magnitude of GDP, population, and precipitation are the main factors influencing the ecological environment quality in Kunming City.In 2000, the interaction between GDP ∩ population (0.229), the interaction between population ∩ precipitation (0.221), and the interaction between GDP ∩ precipitation (0.199) had a considerable influence on the ecological environment quality in Kunming City. This suggests that the magnitude of GDP, population, and precipitation are the main factors affecting the ecological environment quality in Kunming City. In 2005, the interaction between precipitation ∩ population (0.199) and the interaction between slope ∩ population (0.192) indicated that the magnitude of slope, population, and precipitation are the main factors affecting the ecological environment quality in Kunming City.In 2010, the interaction between population ∩ slope (0.182) and the interaction between GDP ∩ slope (0.181) demonstrated that the magnitude of GDP, population, and slope are the main factors impacting the ecological environment quality in Kunming City. In 2015, the interaction between slope ∩ population (0.248) and the interaction between slope ∩ GDP (0.209) revealed that the magnitude of GDP, population, and slope are the main factors influencing the ecological environment quality in Kunming City. In 2019, the interaction between slope ∩ population (0.236), the interaction between GDP ∩ slope (0.235), and the interaction between slope ∩ precipitation (0.205) indicated that the magnitude of GDP, slope, population, and precipitation are the main factors influencing the ecological environment quality in Kunming City, while the explanatory power of other interaction factors on the ecological environment quality is all less than 0.18.
Detecting the Interactive Effects of Driving Factors
Exploring the interactive relationships among driving factors using an interactive detector to detect the impact on ecological environment quality, the study reveals that in the years 2000, 1995, and 2015, the interaction between driving factors exhibited a nonlinear enhancement effect on ecological environment quality. In the year 2005, slope had a dual-amplifying effect with population, and GDP had a dual-amplifying effect with population, while the interaction among other factors showed a non-linear enhancement effect. In 2010, a dual-factor enhancing effect was observed between slope and precipitation, while other factors exhibited a nonlinear enhancing effect in their interactions.
Fig. 8.
The impact of various factors on the changes in ecological and environmental quality in Kunming City.
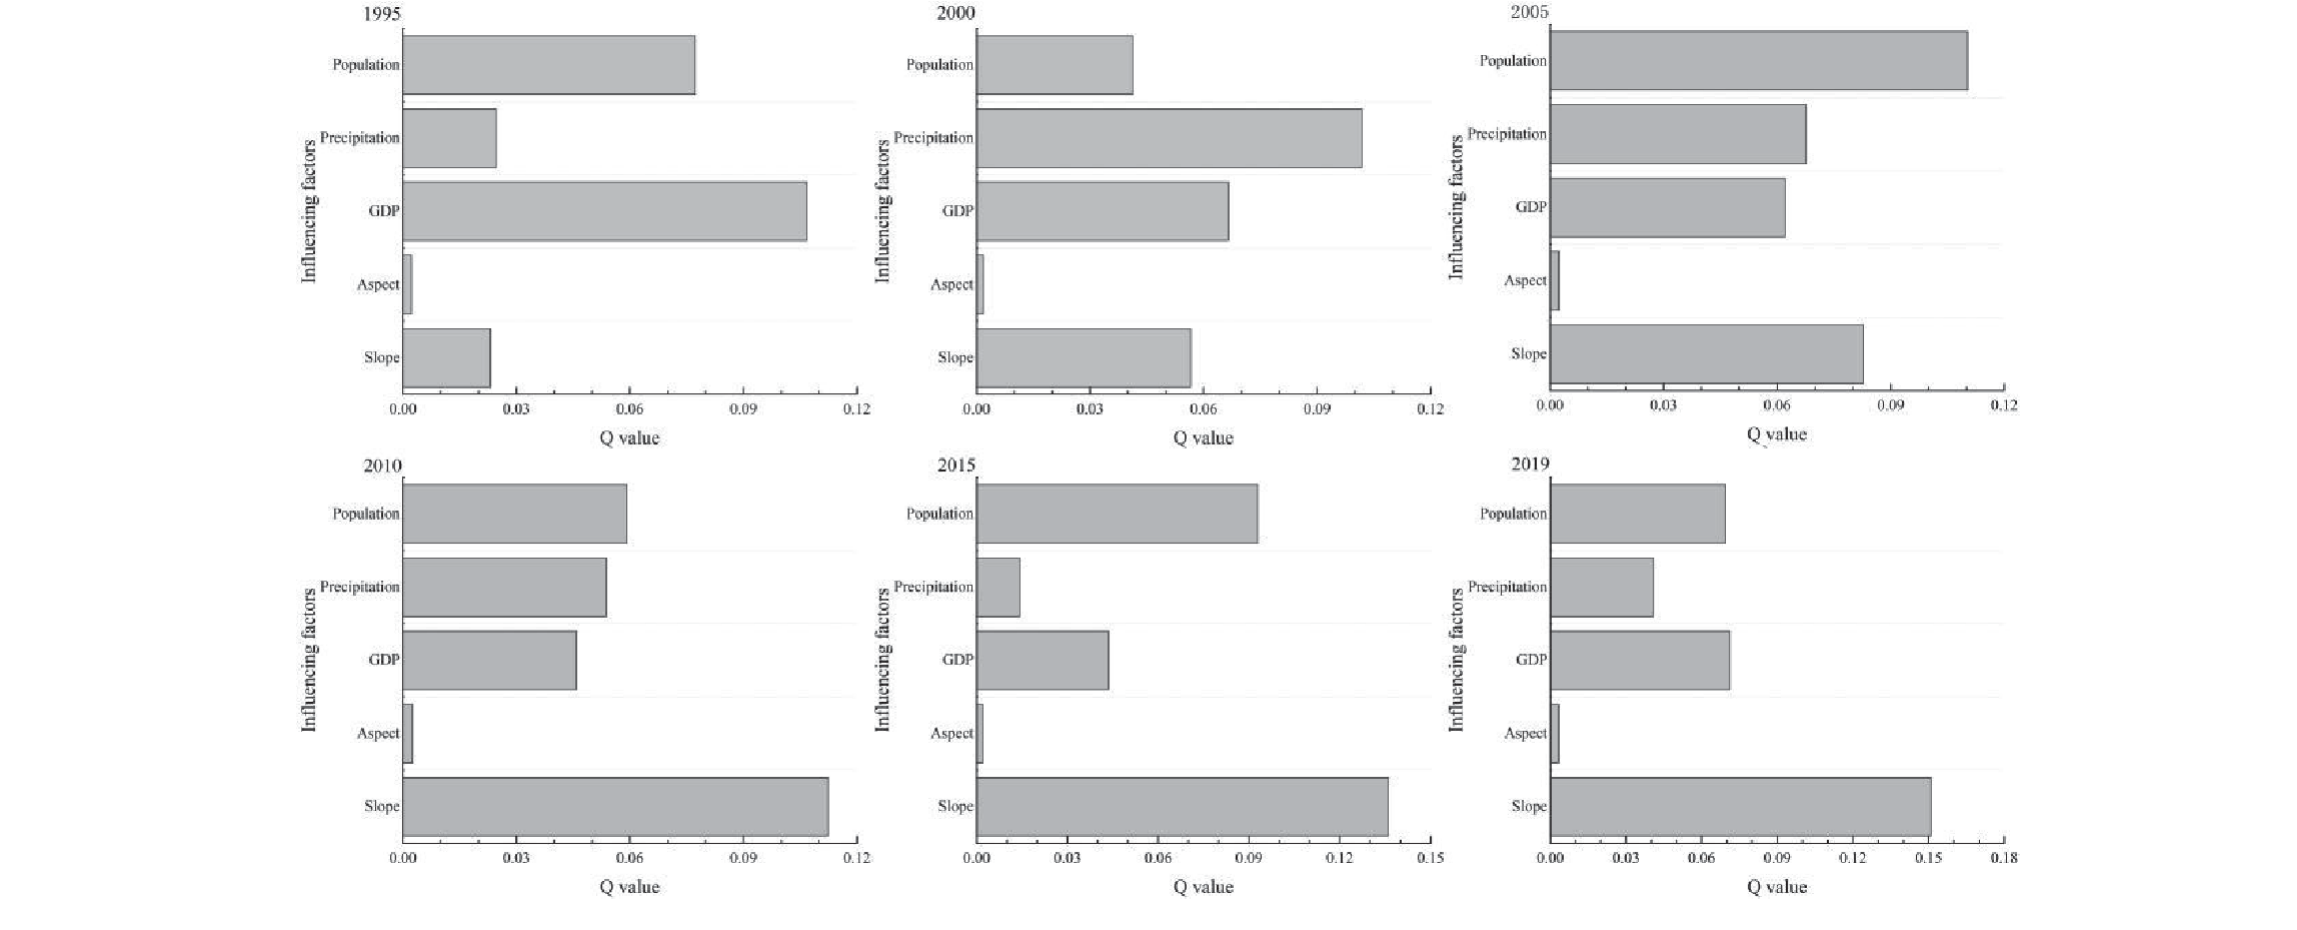
Fig. 9.
The interaction among various factors affecting the ecological and environmental quality in Kunming City.
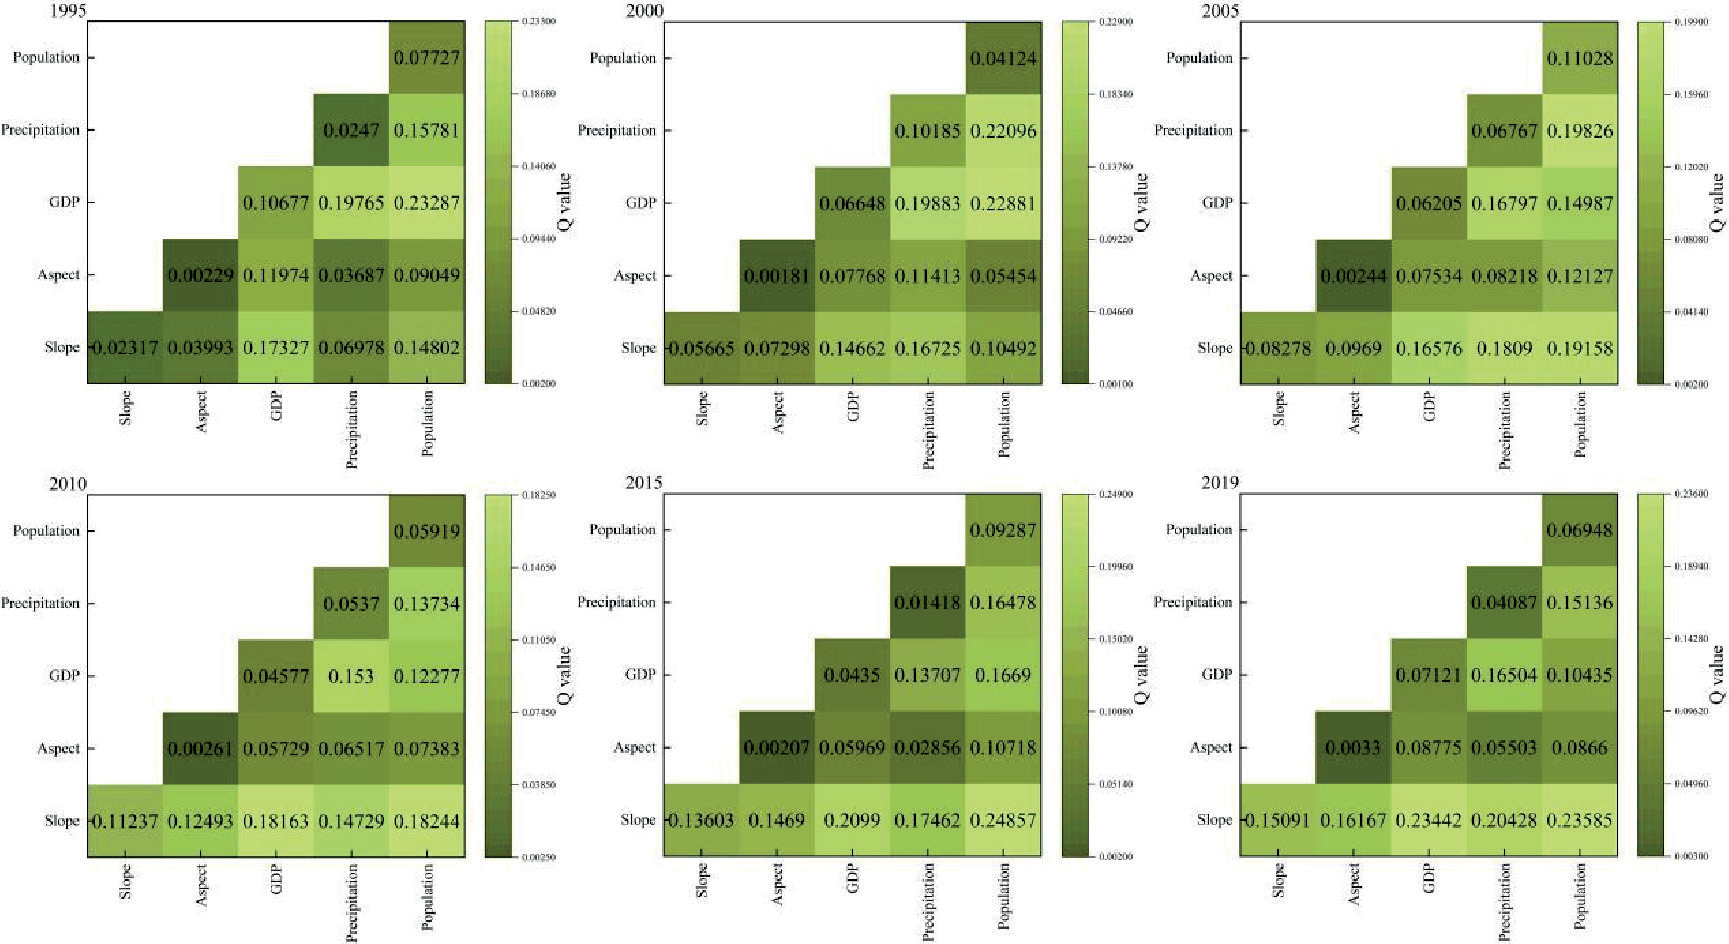
In 2019, a dual-factor enhancing effect was found between GDP and population, with other factors demonstrating a nonlinear enhancing effect in their interactions. There were interactive effects among various factors on the ecological environmental quality in Kunming, with interactions between factors displaying both dual-factor enhancement and nonlinear enhancement relationships. No factors were found to act independently, indicating that the influence of the interaction between any two driving factors on the spatial distribution of ecological environmental quality in Kunming city was greater than that of a single factor. In 1995, the interaction effect of GDP ∩ precipitation (with a q-value of 0.19765) ranked first in terms of its influence, followed by slope ∩ GDP (q-value of 0.17327). The interaction of GDP with other detecting factors further indicates that GDP has a significant impact on the ecological environmental quality in the area. In 2000, the interaction effect of GDP ∩ population (q-value of 0.22881) ranked first in terms of its influence, followed by precipitation ∩ population (q-value of 0.22096). Furthermore, the interaction of precipitation with other detecting factors (q-values all ∩ 0.1) indicates that precipitation has a significant impact on the ecological environmental quality in the area. In 2005, the interaction effect of precipitation ∩ population (with a q-value of 0.19826) ranked first in terms of its influence, followed by slope ∩ population (q-value of 0.19158). The interaction of population with other detecting factors further indicates that population has a significant impact on the ecological environmental quality in the area. In 2010, the interaction effect of slope ∩ population (q-value of 0.18244) ranked first in terms of its influence, followed by slope ∩ GDP (q-value of 0.18163). In 2015, the interaction effect of slope ∩ population (q-value of 0.24857) ranked first in terms of its influence, followed by slope ∩ precipitation (q-value of 0.17462). In 2019, the interaction effect of slope ∩ population (q-value of 0.23681) ranked first in terms of its influence, followed by slope ∩ GDP (q-value of 0.23561). The interaction of slope with other detecting factors further indicates that slope has a significant impact on the ecological environmental quality in the area.
Discussion
Evolution of Spatial Patterns in Ecological Environmental Quality of Kunming City
Kunming City, positioned as the provincial capital of Yunnan Province, has undergone substantial economic and population growth over the past 25 years. Furthermore, the city's built-up areas have rapidly expanded, resulting in an urbanization rate exceeding 80%. Consequently, the ecological environment in Kunming City has become considerably intricate, presenting a daunting situation. Hence, comprehending the transformations in the ecological environment holds paramount significance for the city's economic, social, and sustainable green development. This study employs long-term Landsat data covering the period from 1995 to 2019 to establish the RSEI (Risk-Screening Environmental Indicators) index. The main objective is to investigate the spatiotemporal patterns of ecological environment quality in Kunming City. The results reveal an overall trend in the average RSEI value, characterized by initial growth, followed by a decline, and subsequent growth, increasing from 0.49 to 0.57. Simultaneously, the average values of Land Surface Temperature (LST) and Normalized Difference Built-up Index (NDBSI) consistently decrease, while the average values of Normalized Difference Vegetation Index (NDVI) and Water Extraction Index (WET) exhibit a progressive increase.Examination of Ecological Environment Quality in Kunming City indicates that the most detrimental conditions were observed in 2005. The underlying causes were abnormal climate fluctuations characterized by record-breaking temperatures, highest in over 50 years. Prolonged and severe drought conditions exacerbated the situation, leading to diminished vegetation cover and an observed increase in rocky desertification across specific regions. Since 2005, the area with a favorable ecological environment in Kunming City has witnessed a continuous expansion, resulting in a sustained improvement in ecological environment quality. Spatially, the ecological environment quality demonstrates a distribution pattern characterized by higher quality in the southwest and poorer quality in the northeast. The topography of the region is marked by concentrated areas of rocky desertification, while regions experiencing severe soil erosion exhibit comparatively inferior ecological environment quality. The densely populated Dianchi Lake basin, with its concentrated urban areas, coincides with areas of relatively subpar ecological environment quality. Conversely, regions boasting higher vegetation coverage tend to present better ecological environment quality.
Exploring the Factors Influencing the Temporal and Spatial Evolution of Ecological Environment Quality in Kunming City
This study examines the factors influencing RSEI (Regional Standardized Ecological Index) variations in Kunming City, incorporating five variables, slope, aspect, precipitation, population, and GDP. Utilizing the Geographical Detector method, we investigate the impact of these factors. The results from single-factor analysis reveal that among the human-induced factors, population exhibits the highest explanatory power for ecological environment quality in Kunming City, while in terms of natural factors, slope demonstrates the most significant influence. Conversely, aspect demonstrates the lowest explanatory power in relation to ecological environment quality.Regions with greater slope gradients exhibit lower soil moisture content and comparatively heightened soil erosion. Areas experiencing higher population density intensify the ecological burden, exerting a negative influence on ecological environment quality. Through two-factor interaction analysis, a notable enhancement in explanatory power for ecological environment quality is evident, surpassing the results of single-factor analysis. The joint effects of slope, population, and GDP, in conjunction with their interactions with other factors, significantly shape ecological environment quality in Kunming City.
Delineation of Key Control Areas for Ecological Environment Quality and Recommendations for Ecological Protection and Restoration Measures in Kunming City
Through a 25-year analysis of the spatiotemporal evolution and driving forces of ecological environment quality in Kunming City, it is recommended that strict protection of key areas for ecological environment quality and simultaneous strengthening of ecological protection and restoration efforts are essential for the future. Based on this study, it is suggested that the coastal areas of Dianchi Lake Basin, the Xiaojiang arid-hot valley region in Dongchuan District, as well as the karst rocky desertification areas in Yiliang County and Shilin County, and the hotspots in Xundian and Lujun in the northern region should be designated as key control areas for ecological environment quality. Measures such as classified protection, zoning control, and ecological security management should be implemented to curb the decline in ecological environment quality, enhance ecological security management, and continuously improve ecosystem service functions. Concurrently, with the implementation of a series of ecological environment protection measures in Kunming City, efforts should be intensified to protect ecologically vulnerable areas and restore severely degraded regions. Emphasis should be placed on the governance of the mountain, water, forest, farmland, lake, grass, and sand (SWLFGLS) system, accelerate the ecological restoration of areas prone to soil erosion and rocky desertification, strengthen comprehensive ecological governance, strictly enforce ecological protection redlines, natural forest protection, afforestation, land reclamation, and wetland restoration projects along the Dianchi Lake Basin. These initiatives will contribute to the continuous increase in forest coverage and urban green coverage in Kunming City, ensuring synchronized development between ecological environment construction and the economy. Substantial progress has been achieved in improving ecological environment quality.
Analysis of Limitations in This Study
This paper evaluates and analyzes the ecological environment quality in Kunming City over a 25-year period, utilizing Landsat data with a spatial resolution of 30 meters. However, due to the unavailability of long-term, high-resolution remote sensing image data, achieving more refined regional ecological environment monitoring remains challenging. Moreover, the comprehensive analysis of driving forces behind the changes in ecological environment quality is hindered by the lengthy time span and limited access to data on driving factors. With a focus on the distinctive characteristics of the ecological environment in Kunming City, an enhanced RSEI (Regional Standardized Ecological Index) has been developed to more accurately reflect the actual ecological conditions, enabling a deeper comprehension of the changes in ecological environment quality. In the subsequent phase of this study, the utilization of higher-resolution Sentinel and Gao Fen series data may be contemplated to enhance the precision of ecological environment quality monitoring. Additionally, it is advisable to integrate factors like policy influences, land utilization data, and nocturnal luminosity data into the driver analysis, facilitating a more comprehensive exploration of the drivers underlying ecological environment quality changes in Kunming City.
Conclusion
(1) The ecological environment quality in Kunming City followed a trajectory of initial growth, subsequent decline, and subsequent growth from 1995 to 2019. The year 2019 witnessed the highest recorded ecological environment quality, whereas 2005 experienced the poorest. Notably, the period spanning 2010 to 2019 showcased a significant improvement in ecological environment quality compared to the years between 1995 and 2005. Overall, over the course of 25 years, the ecological environment quality sustained a moderate status, with a consistent improvement observed in the ecological conditions.
(2) The proportion of Kunming City's total area characterized by moderate ecological environment quality exceeds 51.9%, constituting a significant majority. The distribution of ecological environment quality levels can be categorized as follows, moderate ecological environment quality area>good ecological environment quality area>poor ecological environment quality area>bad ecological environment quality area>excellent ecological environment quality area. Spatially, the ecological environment quality demonstrates a spatial pattern of higher quality in the southwestern region and relatively poorer quality in the northeastern region. Regions characterized by prevalent rocky desertification correspond to concentrated topographic characteristics. Additionally, areas experiencing extreme climatic occurrences, significant soil erosion, dense population, and rapid urban expansion tend to exhibit poorer ecological environment quality. Conversely, areas with extensive vegetation coverage typically boast superior ecological environment quality.
(3) During the period from 1995 to 2019, the centroids of the ecological environment standard deviation ellipses in Kunming City were consistently located in close proximity to each other. The major axes of these ellipses consistently aligned in a north-south direction, portraying a pronounced elongated shape and a distinctive directional trend. However, following 2005, as a result of the reinforced and gradual implementation of ecological civilization policies, the ecological environment quality in Kunming City tended to stabilize. Most of the years observed the centroid of ecological environment quality situated near the Panlong District of Kunming City, aligning with the findings derived from the analysis of standard deviation ellipses, thereby reflecting a high degree of spatial consistency. Over the course of 25 years, the centroid remained relatively stable with minimal variation, showcasing an overall north-south pattern and exhibiting minor overall changes.
(4) The ecological environment in Kunming City exhibits a spatial distribution largely influenced by two key factors, population, as a primary human-induced factor, and slope, as a predominant natural factor. The combined effects of slope, population, GDP, and other relevant factors exert a significant impact on the ecological environment quality in Kunming City.
(5) In the future, it is crucial to implement strict protection measures for key ecological quality areas while concurrently strengthening ecological conservation and restoration efforts. This necessitates optimizing land-use spatial planning, continuously enhancing ecological environment quality, and ultimately realizing synchronized and sustainable development between the ecological environment and the economy.

