

Introduction
Since the report of the 18th National Congress of the Chinese Communist Party proposed “building a new type of urbanization”, China’s urbanization rate has steadily increased. According to the statistics of the Bureau of Statistics of China, as of the end of 2021, the number of cities in China has reached 691, including 297 cities at the prefecture level and above. The urbanization rate in China has increased from 57.33% in 2015 to 65.22% in 2022, an increase of 13.76 percentage points. The income level of urban residents has also steadily increased, with per capita disposable income increasing from 33616 yuan in 2015 to 49283 yuan in 2022. However, as the process of urbanization progressed, the rapid population gathering in cities, has brought many problems to cities, including industrial chemical fuel combustion, traffic congestion, water pollution, and waste pollution, leading to negative impacts on urban ambient air quality (Mahrukh et al., 2023; Balogun et al., 2021; Coelho et al., 2022; Huang et al., 2022; Yeo and Kim, 2022) [1-5]. According to the survey results of the China Environmental Bulletin 2021, 121 out of 339 cities at the prefecture level and above in China exceeded the standard in air quality in 2021, accounting for 35.7% of the total number of cities. If the impact of dust and sand is not deducted, the proportion of cities with air quality exceeding the standard in 339 cities is 43.1%. Air pollution not only causes huge economic losses (Li and Zhang, 2019) [6], but also causes great psychological and physical harm to people (Li et al., 2019a) [7]. The infrastructure and management of traditional cities cannot meet people’s higher demands for the environment: smooth transportation, clean water sources, and clean air. Due to the traditional placement of air detection equipment in fixed enclosed areas in cities, only a few areas are sampled for air, making it impossible to conduct detailed air sampling at various blocks in the city. Therefore, it is not possible to accurately assess the density and source of pollutants in the entire city, as well as the degree of exposure of urban residents to air pollution (Mart í n-Baos et al., 2022; Mc-Kercher et al., 2017; Palomeque-Mangut et al., 2022) [8-10]. With the improvement of the living standards of urban residents, their sensitivity to ambient air quality is gradually increasing, and urban ambient air quality has gradually become a key factor to consider when high-level talent transfer occurs (Wu et al., 2022) [11]. Local governments are considering which model of urban development is more conducive to forming “livable, resilient, and smart” cities, to attract talent and high-end industrial clusters.
With the rapid development of internet technology, sensors based on the internet of things (recorded as IoT) have begun to penetrate the infrastructure of traditional cities, and cities are naturally moving towards intelligence. A smart city is a digital city with modern technologies such as IoT, big data and cloud computing. Smart cities were first born in the United States. Countries around the world are vigorously developing smart cities to solve various problems caused by the expansion of traditional cities. As a developing country, China’s smart city construction started late, but its development speed is fast. In order to standardize and promote the healthy development of smart cities, the Ministry of Housing and Urban Rural Development of China issued a notice on December 5, 2012 on the implementation of the National Smart City Pilot Work, and issued two documents: the “Interim Management Measures for National Smart City Pilot Work” and the “National Smart City (District, Town) Pilot Indicator System (Trial)”, officially starting the smart city pilot work. On January 29, 2013, the Ministry of Housing and Urban Rural Development of China announced the first batch of 90 national smart city pilot lists, including 37 prefecture level cities, 50 districts (counties), and 3 towns. On August 5, 2013, the Ministry of Housing and Urban Rural Development of China announced the second batch of national smart city pilot lists, including 103 cities (including districts, counties, and towns). On April 7, 2014, the Ministry of Housing and Urban Rural Development of China announced the third batch of national smart city pilot lists, with 290 smart city pilot projects in China. In China’s “14th Five Year Plan” and the 2035 long-term goals, it is further clearly stated that “promoting the construction of new smart cities through classification and classification”. It can be seen that the construction of smart cities has risen to a national strategy and is constantly developing and improving.
While the number of Chinese cities is growing rapidly, the problem of air pollution is also closely related. As an advanced model of urban development, can the construction of smart cities solve the problem of air pollution? The integration of IoT technology into environmental governance in smart cities will have a profound impact on air pollution prevention and control (Du et al., 2020) [12]. This may mean that the government can influence urban ambient air quality through the construction of smart cities, changing macro conditions such as technological environment. We attempt to explore whether the construction of smart cities in China has had a policy effect on improving urban ambient air quality. With the deepening of smart city construction, has its impact on ambient air quality deepened? What is the underlying mechanism of this impact? Are there differences in the environmental effects of smart city construction policies between cities? The national smart city pilot policy in China provides excellent conditions for exploring whether the construction of smart cities has the effect of improving environmental air quality.
Material and Methods
Literature Review and Theoretical Framework
The Direct Impact of Smart City Construction on Ambient Air Quality
The integration of smart city construction with ecological environment is reflected in emphasizing and implementing the promotion and application of smart technology in air pollution prevention and control. Specifically, intelligent transportation systems and smart logistics improve transportation efficiency, reduce energy consumption during the logistics process, and thus reduce carbon dioxide emissions through intelligent management of logistics systems. Smart grid power generation is mainly based on clean new energy, greatly improving the energy consumption structure, saving fossil energy consumption such as urban coal, and reducing various gas pollutant emissions (Du et al., 2023; Faheem et al., 2019) [13, 14]. Smart water in smart cities achieves refined management of sewage treatment, improves sewage treatment efficiency, and reduces exhaust emissions caused by sewage treatment.
The construction of smart cities empowers supervision. With the advancement of smart technology, local environmental protection departments have become more refined in their supervision, and their ability to timely identify and quickly handle pollution sources has greatly improved. Another major source of air pollution is the gas generated by the combustion of fossil fuels in industrial production and the discharge of wastewater from enterprises. The intelligent monitoring system helps accurately monitor the pollutants emitted by enterprises during production, prevent illegal emissions and storage of pollutants by enterprises from causing environmental air pollution, and achieve the solution of pollution problems at the source.
In the field of ambient air, the construction of smart cities can effectively solve the problem of ambient air pollution.
Naturally, the higher the overall level of intelligence in a city is, the higher the level of popularization of intelligence. Intelligent application scenarios will become the norm for urban operation, greatly improving the efficiency of urban operation. Therefore, do cities with high levels of smart city construction have better environmental air quality? Generally, the leading direction of smart city construction in the initial stage is the intelligent transformation and construction of traditional infrastructure, as well as the underlying technical reserves for the construction of intelligent service platforms (Guo et al., 2022) [15]. The very deep transformation from traditional infrastructure to intelligent infrastructure will have a very big impact on the air changes in urban environments in the early stages of smart city construction. In the mid-term phase of smart city construction, due to a lack of experience and similarity, as well as for profit purposes, smart construction projects tend to be high-end projects without considering specific conventional problems that need to be solved in urban operation, and their construction effectiveness may decrease (Qiu, 2023) [16]. With the standardization of smart construction and the accumulation of construction experience, the leading direction of smart city construction will change, and “people-oriented, green and livable” will become the core strategy. For example, the level of smart city construction in China shows a gradually increasing trend in regional distribution from west to central to east (Tang et al., 2020) [17], and the level of green smart city construction in China also shows similar distribution characteristics in regional distribution (Sun and Zeng, 2021) [18]. Given this, we propose the first hypothesis:
H1: The construction of smart cities has a positive impact on urban ambient air quality, and with the improvement of the smart city construction level, its improvement effect on ambient air quality shows a fluctuating trend.
The Mediating Role of Technological Innovation
Technological progress is a key element in terms of ability for improving air quality. The construction of smart cities has accelerated technological progress. On the one hand, the concept of smart cities includes technological innovation (Kummitha and Crutzen, 2017; Praharaj et al., 2018) [19, 20]. The technical architecture of smart cities is a new generation of information technology based on the internet of things, big data, cloud computing, artificial intelligence, etc. The process of building a smart city is linked to the development and application of smart technologies. For example, stowage route optimization technology and logistics automation technology developed by smart logistics have played a huge role in improving transportation efficiency and reducing carbon emissions. In waste management, smart waste systems are used to monitor the filling level of garbage bins in real-time through IoT sensors. Second, smart city construction accelerates technological innovation by promoting the digital transformation of government management and the digital transformation of enterprise production (Yuan and Zhu, 2021) [21]. Due to the use of intelligent monitoring systems by government departments to accurately and comprehensively monitor the pollution emissions of enterprises, preventing and controlling illegal storage and emission of waste gases by enterprises were achieved. Accurate environmental monitoring forces enterprises to develop green technologies and pollution control technologies at the production end, improve production efficiency and reduce pollution emissions, thus helping improve ambient air quality. Technological innovation improves urban operational efficiency and optimizes urban resource allocation, which helping reduce environmental pollution (Shi et al., 2018) [22]. Finally, in the process of building a smart city, informatization and digital technology have developed rapidly, and digital technology has gradually penetrated into traditional industries, promoting the innovation of production and management of traditional industries. The digital transformation of traditional industries is conducive to low-carbon and other green technology innovation of traditional industries (Jian et al., 2023) [23]. Given this, the following second hypothesis is proposed:
H2: Smart city construction improves urban environmental air quality by promoting technological innovation.
The Mediating Role of Marketization Level
The construction of smart cities can generate a huge market and expand the scale of the high-tech information market, thus stimulating market vitality and optimizing market structure. On the one hand, the construction of smart cities requires huge financial support. Due to the limitations of fiscal decentralization in China, relying solely on government leadership in smart city construction will be an impossible task. Smart city construction requires cooperation between public–private partnerships (Zhang et al., 2018) [24]. The expansion of this government enterprise cooperation model helps to reduce government intervention in the market and improve market competition for enterprises, hence stimulating market vitality and helping improve the level of marketization. On the other hand, the construction of smart cities spawned a new generation of information technology infrastructure industries related to energy conservation, environmental protection, and environmental monitoring. The market has a very high demand for sensors, chips, smart equipment, and cloud platform facilities (Cui and Chen, 2019) [25]. The improvement of the marketization level will help resources flow towards green technologies such as new environmental monitoring technologies, pollution control technologies, and new energy technologies, all of which will contribute to the improvement of environmental air quality. The construction of smart cities has accelerated the penetration of smart technology into traditional industries, promoting the application of new energy, energy conservation and emission reduction technologies in traditional industries. The popularization of smart technology has stimulated market vitality, expanded the market scale of the tertiary sector of the economy, and thus reduced urban ambient air pollution. Given this, the following third hypothesis is proposed:
Table 1.
Air pollution index system.
H3: Smart city construction improves urban environmental air quality by improving the marketization level.
Experimental
Samples and Data
The national smart city pilot cities in China are divided into three batches, namely 2012, 2013, and 2014. Some pilot cities only include a certain county within this city, and these cities are removed from the sample. The final sample cities are 245, including 100 pilot cities and 145 non pilot cities. The sample interval is from 2005 to 2020. The sample data come from the “China Urban Statistical Yearbook” over the years, statistical yearbooks of various provinces and cities, China Energy Statistical Yearbook, and Wind database.
Measurement of Variables
Explained variable: The air quality of urban surroundings is mainly affected by the emissions of industrial waste (exhaust gas, wastewater, smoke and dust, etc) and carbon dioxide emissions (Salman and Hasar, 2023) [26]. Therefore, we consider the use of the air pollution index (recorded as UAPI) to measure ambient air quality. The air pollution index includes: per capita industrial wastewater emissions, per capita industrial sulfur oxide emissions, per capita industrial smoke emissions, per capita carbon emissions and average annual concentration of PM2.5. Among them, the per capita sulfur oxide is represented by the ratio of annual industrial sulfur oxide emissions to permanent population in each city, and the per capita industrial smoke and dust emissions are represented by the ratio of annual industrial smoke and dust emissions to permanent population in each city. The per capita carbon is represented by the ratio of urban carbon emissions to permanent population. Based on the characteristics of population mobility in China and the availability of data, the urban population data used in this paper refers to urban permanent population data. The permanent population in China refers to the population who actually frequently reside in a certain area for a certain period of time (referring to more than half a year). The data on urban permanent population comes from the China Urban Statistical Yearbook. The industrial sulfur oxide data and industrial smoke and dust data of each city are from the China Urban Statistical Yearbook, while the carbon data is from the dual carbon map released by the Chinese Academy of Environmental Sciences and the Public Environment Research Center (IPE). There are five indicators in total (see Table 1), and each basic indicator is dimensionless. Then, we calculate the air pollution index by using the entropy method, and take the logarithm of it, recorded as lUAPI.
Core explanatory variable. The core explanatory variable is the interaction term between the regional dummy variable and the time dummy variable of the smart city pilot policy.
Table 2.
Descriptive statistics of variables.
Control variable. Urban ambient air quality is closely related to a variety of factors: the level of economic development, industrial structure, urban population size, the level of urbanization, and the level of foreign investment. We refer to the literature of Shi et al.(2018) [22], Li and Qi (2011) [27], Shi and Li (2020) [28], and Yao et al.(2023) [29], and we select the following five influencing factors as control variables: Per capita GDP (recorded as rgdp) represents the level of economic development. The proportion of secondary sector of the economy in GDP (recorded as str) represents the characteristics of the industrial structure. Population density (recorded as pd), which is expressed by the logarithm of the ratio of the permanent population of prefecture-level cities to the area of administrative regions, represents the differential impact of urban population size. The urbanization level (recorded as urb) is expressed by the ratio of the urban population to the permanent population of the prefecture-level city, which represents the level of urbanization. The level of foreign investment (recorded as fdi) represents the level of foreign investment utilization in cities. We take the logarithm of all control variables recorded as lrgdp, lfdi, lstr, lpd, and lurb.
Mediating variable: The first mediating variable is technological innovation (recorded as pat). According to the classification of patents by the China National Intellectual Property Administration, patents are divided into invention, utility model and design, and the innovation of these three types of patents is reduced in turn. Utility model and design patents only require similar patent applications that have not been approved before, and the application requirements and examination standards are relatively relaxed. The application for invention patents must meet the requirements of “novelty, creativity and practicality” and have a high degree of novelty and technical creativity, so the number of thousands of invention patent applications are adopted, and the data are from the China National Intellectual Property Administration. The second mediating variable is marketization level (recorded as market). Using the method of Zeng and Wu (2020) [30], we construct a marketization level index from three dimensions: the relationship between the government and the market, the development of a non-state-owned economy, and the degree of product market development.
Moderating variable: the first moderating variable is financial autonomy (recorded as fiscal): referring to Ran et al. (2021) [31], the calculation formula of financial autonomy: Financial autonomy is as follows: the ratio of per capita financial expenditure of prefecture-level city to the sum of per capita financial expenditure of prefecture-level city, provincial per capita financial expenditure and national per capita financial expenditure. The second moderating variable is environmental protection regulation intensity of local governments(recorded as era). Referring to the construction method of indicators of environmental protection governance intensity of provincial governments by Chen and Chen (2018) [32], first, we searched 245 prefecture-level city government work reports from 2005 to 2020, and processed the text of government work reports by word segmentation; Then we counted the frequency of words related to environmental protection, and calculated the proportion of the total number of environmental protection words to the total number of words in the full text of local government reports every year. The third moderating variable is industrial structure upgrading (recorded as isui). Using Gan et al. (2011) [33], the index of industrial structure upgrading is the sum of the added value of the primary sector of the economy in proportion to GDP, the added value of the secondary sector of the economy twice in proportion to GDP, and the added value of the tertiary sector of the economy three times in proportion to GDP.
Table 2 shows the descriptive statistics of the main variables. As shown in Table 2, the annual mean value of the logarithmic air pollution index is 1.339, the standard deviation is 0.515, the minimum value is -0.394, and the maximum value is 3.826. It shows that there are large differences in the air pollution index during the sample period of the study, indicating that there are large differences in the ambient air quality of each city, providing a starting point for the subsequent study of the impact of smart city pilot policies.
Table 3.
Benchmark regression of smart city policy to air pollution index.
Results and Discussion
Benchmark Regression
To test the impact of smart city construction on urban ambient air quality, we establish the following multi-period double difference model:
Where i,t represent prefecture level cities and years, respectively, Yit is the air pollution index of city i at time t, and the independent variable is didit = treati × postt. Treat is a dummy variable for the treatment group and the control group, and if the city belongs to a smart city, the value of Treat is 1, otherwise it is 0. Post is a time dummy variable that is set to 1 in the year and later, when the smart city was approved as a pilot city, and otherwise is 0. The coefficient therefore shows the impact of smart cities on the air pollution index. A negative and significant α1 suggests that smart city construction exerts a positive effect on ambient air quality. Control is a set of control vectors, including income level, industrial structure, population density, urbanization rate, and openness to the outside world. μi and ηt are the unobservable fixed effects (FE) in cities and time, respectively, and ɛit is the random error term.
Table 3 shows the benchmark regression results of smart city construction on the air pollution index. Table 3 (1) shows the regression of the smart city on the air pollution index without a series of control variables. The regression coefficient is -0.065, and it is significant at the 1% level. Table 3 (2) -3 (6) lists the regression of smart city construction on the air pollution index after adding a series of control variables, and the regression coefficient is still significantly negative, indicating that smart city construction significantly inhibits the increase in the environmental air pollution index. Taking Table 3 (6) as an example, all control variables were included in the regression of Table 3 (6). The regression coefficient of smart city construction on the air pollution index is -0.062, which is significant at the 1% level, indicating that the construction of smart cities has significantly inhibited the improvement of the urban air pollution index. Among them, the construction of smart cities significantly reduced the ambient air pollution index by 6.2%. Compared to non-smart cities, smart cities are easier to develop and use next-generation information technology to upgrade cities. On the one hand, enterprises in smart cities are more likely to intelligently upgrade their production and management equipment, and provide intelligent training for employees. All of these are conducive to improving the efficiency of resource utilization in production, including energy utilization efficiency, thereby reducing the emissions of industrial wastewater, exhaust gas, and smoke and dust. On the other hand, in smart cities, there are often supporting government special funds to support smart construction, which provides some support for air smart governance. The regression coefficient of economic growth (lrgdp) to the air pollution index is 0.388, which is significant at the level of 1%, indicating that China’s economic growth from 2005 to 2020 is still at the cost of sacrificing the ecological environment. The regression coefficient of the industrial structure (lstr) to the air pollution index is -0.069, which is significant at the 1% level, indicating that China’s secondary sector of the economy is gradually transitioning from a highly polluting and energy consuming industry to cleaner production. The regression coefficient of population density (lpd) to the air pollution index is -0.03, which is significant at the 1% level. It may be that high human capital concentration inhibits the aggravation of air pollution. The regression coefficient of the urbanization rate (lurb) to the air pollution index is -0.715, which is significant at the level of 1%, indicating that China’s new urbanization construction may help curb the increase in air pollution. The regression coefficient of opening to the outside world (lfdi) on the air pollution index is -0.013, which is significant at the 1% level, indicating that China’s opening to the outside world has produced a “pollution halo” effect, and this has had a positive impact on the ambient air.
Self-Reinforcing Effect Test
Furthermore, to test whether the improvement of the smart city construction level has shown an enhancing trend in improving urban ambient air quality, that is, whether there is a self-reinforcing effect, the following empirical analysis needs to be conducted. First, we divide 100 smart cities into three categories based on their level of smart construction, from low to high. Second, we use the classified smart cities as the processing group and 145 non pilot cities in the benchmark regression as the control group for regression analysis. According to the “6th (2016) Evaluation Report on the Development Level of China’s Smart Cities” jointly released by the information technology research center of the Chinese Academy of Social Sciences and the National Interconnection Smart City Research Center1. Ninety-six smart cities were matched, and the 4 smart cities that were not matched were merged with 96 other smart cities based on their per capita GDP level. Based on the comprehensive score of smart cities, 100 smart cities are divided into three levels using the 25% and 75% percentiles as thresholds. Twenty-five smart cities below the 25th percentile belong to a relatively low 1 The 6th (2016) China Smart City Development Level Assess-
ment Report jointly issued by the informatization research
center of the Chinese academy of social sciences and the
research center of the Guomai internet smart city ranks the
comprehensive scores of the declared smart cities according
to the principle of voluntary declaration, and subdivides the
indicator infrastructure construction level, urban cloud plat-
form application, smart infrastructure, government online
service level, public resource trading platform Social media
participation, smart governance, social livelihood service
level, data openness service level, smart livelihood, informa-
tion industry development level, economic output and energy
consumption level, internet application level, smart economy,
information service industry employees, network life level of
mentors, information consumption level, smart population,
planning and standard system, organizational management
and performance evaluation, information security guarantee
The scores of a total of 23 sub indicators such as the security
system are added up to the rank. level of smart construction and are recorded as level III. There are a total of 50 smart cities in the middle 25% -75% percentile, and their smart construction level is medium and recorded as level II. A total of 25 smart cities above the 75th percentile belong to a high level of smart construction, and are recorded as level I. Table 4 (1) - (3) shows the regression results of the air pollution index of level III, level II and level I, respectively. The regression results show that, first, regardless of the level of smart city construction, smart city construction has significantly inhibited the increase in the air pollution index; Second, with the improvement of the construction level of smart cities, the inhibitory effect of smart city construction on the air pollution index from high to low is level I, level III and level II. A possible reason is that in the early stage of smart city construction, a new generation of information technology was integrated into the traditional infrastructure, and the initial application of intelligence significantly inhibited the improvement of air pollution. However, with the homogenization of smart city construction, marginal effects have decreased, leading to a decrease in their impact. With the accumulation of experience in smart city construction and the improvement of construction level, the application of smart scenarios becomes more mature, and the operational efficiency of urban systems becomes higher, further improving its inhibitory effect on ambient air pollution, further verifying Hypothesis 1.
Parallel Trend Test
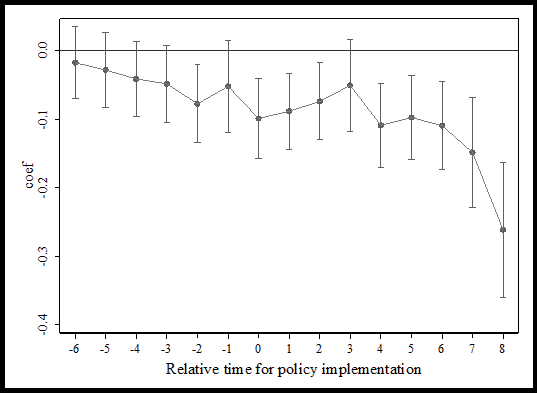
The prerequisite for adopting the multi-period double difference model is that the experimental group and the control group maintain a consistent trend of change before the policy occurs, satisfying the parallel trend test hypothesis. Due to the different timing of policy impacts on pilot cities, it is necessary to set a relative time dummy variable for the implementation of smart city pilot policies for each pilot city. Drawing inspiration from Wang et al. (2023) [34], we construct Equation (2) for parallel trend testing, as follows:
(2)
Among them, the time dummy variable are the observation values of each city established as a pilot city in the first 6 years, the current year, and the following 8 years. The dummy variable for non-pilot cities is 0, as shown in Fig. 1 The results show that before the implementation of the smart city policy, the estimated coefficients of the interaction terms of the dummy variables in each period were not significant. However, after the implementation of the smart city policy, except for the 2015, the estimated coefficients of the interaction terms of the dummy variables in all other periods were significantly negative, and the absolute values of the estimated coefficients showed an increasing trend, indicating that the parallel trend assumption is valid. The smart city pilot policy conforms to the parallel trend assumption.
Robustness Test
To strengthen the empirical results of the improvement effect of smart city construction on ambient air quality, this section conducts a series of robustness tests on issues that may affect the benchmark regression results.
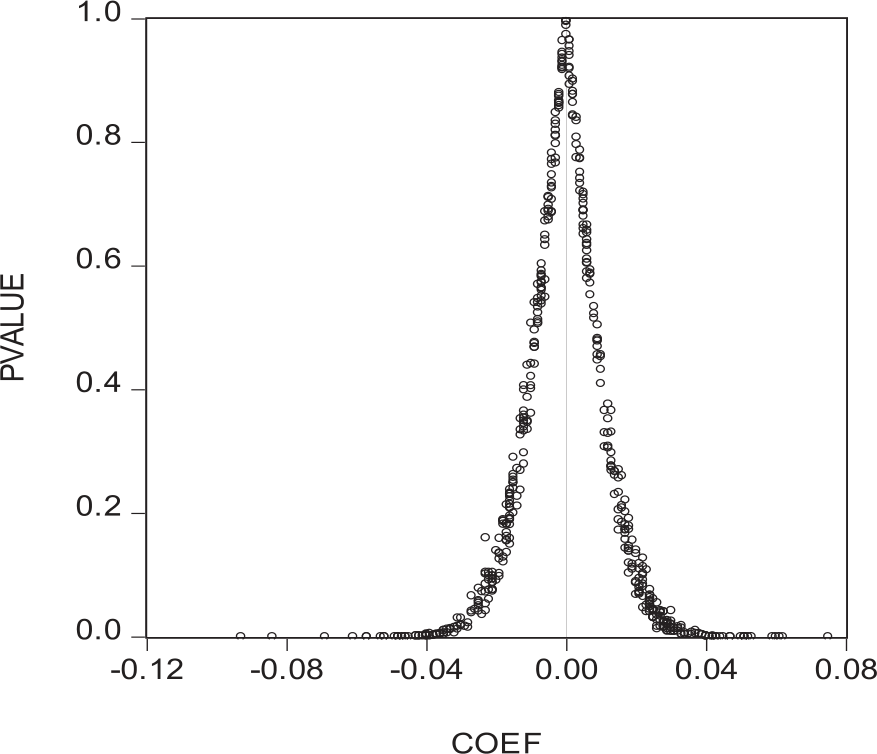
Placebo Test. To further test whether the results of the benchmark regression are driven by unobservable factors, a placebo test was adopted. Due to the time difference in policy shocks in multi period pilot cities, it is necessary to simultaneously generate both pseudo processing group dummy variables and pseudo policy shock variables. Based on this, we adopt the following placebo test: first, 100 cities are randomly selected from 245 cities as smart pilot cities, and the other 145 cities are non-pilot cities. Five hundred random samples are selected for 500 benchmark regressions. The kernel density and p-values of the estimated coefficients for 500 randomly generated are presented in Fig. 2. Fig. 2 shows that the estimation coefficients of 500 randomly generated are mostly concentrated at approximately 0, and the p-values are mostly greater than 0.1. This confirms to some extent the robustness of the benchmark regression conclusion.
Fig. 2.
Placebo test of air pollution index. Note: The X-axis represents the estimated coefficients generated randomly 500 times, while the Y-axis represents the p-value of the estimated coefficients.
Reverse causal problem. Based on the benchmark regression results, smart cities significantly suppressed the increase in air pollution, and the degree of air pollution may not have a direct impact on smart cities. This is because the Chinese government has requirements for the application of national smart city pilot cities, which require procedures such as local city application, preliminary review by provincial housing and urban-rural construction authorities, and comprehensive evaluation by experts. Specifically, the application for a city needs to meet four conditions: First, the construction of a smart city has been included in the local national economic and social development “12th Five Year Plan” or relevant special plans; Second, the preparation of the smart city development planning outline has been completed; Third, there are clear funding plans and guarantee channels for the construction of smart cities; Last, the main person in charge of the responsible entity is responsible for creating pilot applications and organizing management. From the declaration conditions, it can be seen that it does not directly involve environmental air issues.
Sample selection problem. Due to the fact that whether to become a smart pilot city is not a random sampling, but rather an active declaration by prefecture level cities, there is a problem of sample selection. The Propensity Matching Test (PSM-DID) method is used to address this problem.
Propensity Matching Test (recorded as PSM-DID). Whether to become a smart pilot city or not is not random sampling. It is voluntarily declared by each prefecture-level city. There may be a sample selection problem. For this problem, the PSM-DID method is adopted [22]. When using the PSM-DID method, the propensity score value is obtained by logistic regression of the control variable based on whether it is a dummy variable of a smart city. The city with the closest propensity score is the paired city of smart cities, and this method can minimize the systematic differences in environmental air pollution levels among different cities. Before conducting PSM-DID estimation, we also need to conduct model validity testing. The first thing to test is whether there is a significant difference between the experimental group and the control group for each variable after matching. If there is no significant difference, it indicates that the PSM-DID method can be used. Table 5 shows the effectiveness test of PSM-DID. From the value of P in Table 5, it can be seen that the original hypothesis cannot be rejected (the original hypothesis is that there is no significant difference between the mean of the matched post-processing group and the mean of the control group). It can be considered that there is no significant difference between the mean of the matched post-processing group and the mean of the control group. The regression results after propensity score matching are shown in Table 6 (1), indicating that the policy effect of smart city pilots still has a significant improvement effect on urban ambient air quality.
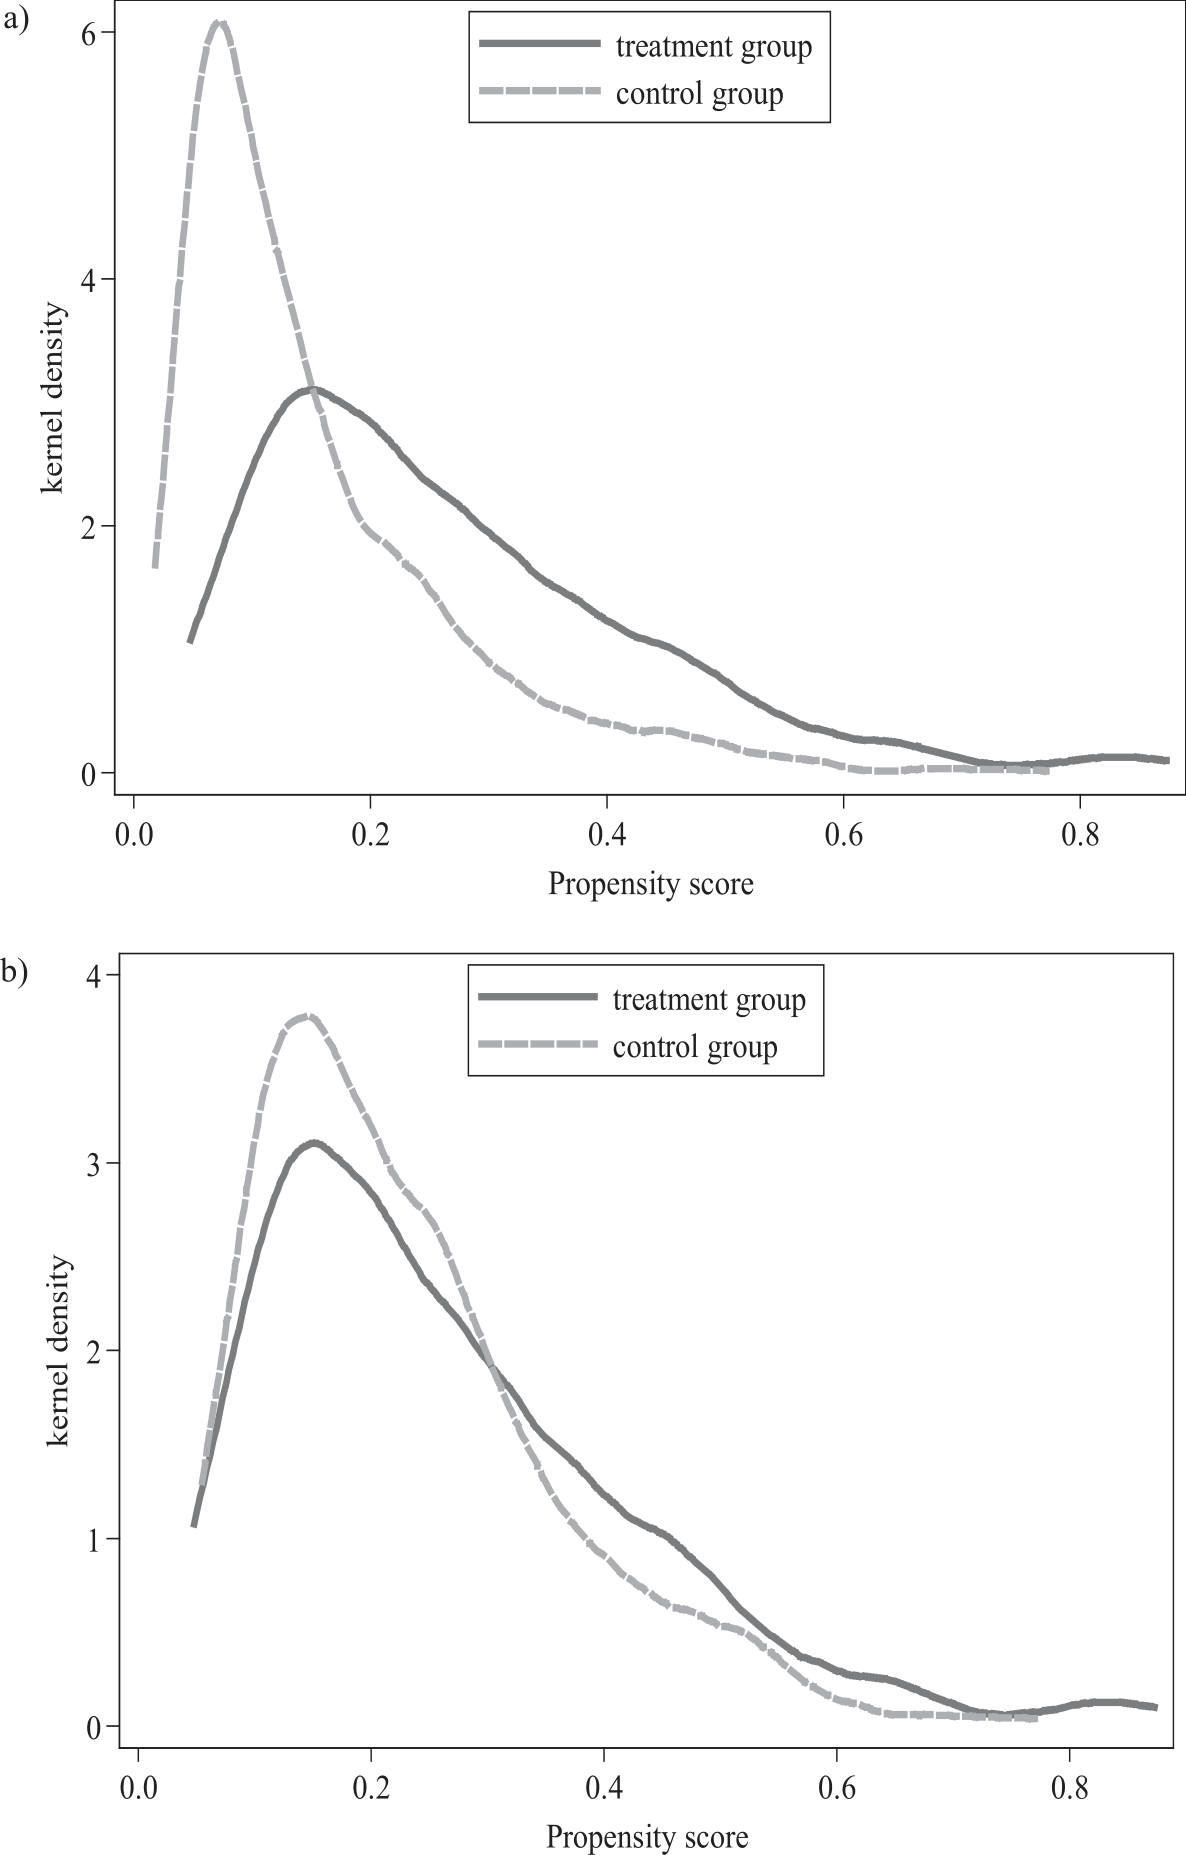
In the specific estimation, we use the kernel matching method to test whether the role of smart city construction in reducing environmental air pollution is robust. Before estimation, we tested the matching effect between the experimental group and the control group by drawing a kernel density function graph of propensity score values, as shown in Fig. 3. Fig. 3 shows that the probability density of propensity score values between the treatment group and the control group is already relatively close after matching, indicating that the matching effect of this paper is very good. Therefore, the PSM-DID method in this paper is feasible.
Table 5.
Validity test after propensity score matching.
| Mean Treated | Mean Control | %Bias | P>|t| | |
|---|---|---|---|---|
| lrgdp | 10.553 | 10.521 | 4.2 | 0.378 |
| lstr | 0.099 | 0.107 | -1.9 | 0.723 |
| lpd | 9.210 | 9.329 | -1.4 | 0.786 |
| lurb | 4.015 | 4.017 | -0.8 | 0.847 |
| lfdi | -0.222 | -0.233 | 0.7 | 0.894 |
Table 6.
Robustness test regression results.
Sample Data Screening and Exclusion of Other Policy Interferences. To prevent the sample outlier from having a great impact on the benchmark regression, the sample was processed by shrinking the tail by 1% and cutting the tail by 1%. The regression results are shown in Tables 6 (2) and 6 (3), which are basically consistent with the benchmark regression result in Table 6 (1). During the implementation of the smart city policy, there were also policies related to the smart city policy and the ecological environment, including the national pilot policy for new urbanization and the national pilot policy for low carbon cities. In the benchmark regression, dummy variables of the national pilot policy for new urbanization (recorded as didrb) and the national pilot policy for low carbon cities (recorded as didco2) were added. The regression results are shown in Table 6 (4), indicating that after adding two relevant pilot policies, the smart city policy still significantly suppresses the increase in the air pollution index.
System Generalized Method of Moments Testing. Considering the inertia of variables, variables that may lag one period have an impact on the current period (Li and Qi, 2011) [27]. This may lead to severe endogeneity. Therefore, the system generalized method of moments (GMM) is used to estimate the panel model to test the robustness of endogeneity problems. The regression results are shown in Table 6 (5), and they are robust.
Testing for Intermediation Effects
The above benchmark regression and a series of robustness tests indicate that the construction of smart cities has a significant improvement effect on urban ambient air quality. According to Hypothesis 2, smart city construction has an impact on ambient air quality by enhancing the level of urban technological innovation and marketization.
Whether smart cities have an impact on ambient air quality by enhancing the level of urban innovation and marketization level requires further empirical testing with the intermediation effect model. The intermediation effect model is set as follows:
Mediator is an intermediary variable that includes the level of urban technological innovation and marketization level. If the construction of smart cities affects urban ambient air quality, the estimated parameters α1 β1 γ1 γ2 in Formulas (3) to (6) are statistically significant.
Testing of Technological Innovation Mechanism. Technological innovation is represented by the number of invention patent applications per thousand people, recorded as pat. Table 7 (2) shows the regression results of smart city construction on technological innovation. The regression coefficient of smart city construction on the number of invention patent applications per thousand people in Table 7 (2) is 0.232, and it is significant at the 1% level, indicating that smart city construction has significantly increased the number of invention patent applications per thousand people. Table 7 (3) shows the regression results after adding technological innovation variables to the benchmark regression. In Table 7 (3), the regression coefficient of smart city construction to the air pollution index is -0.061, which is significant at the level of 1%. The regression coefficient of pat applications to the air pollution index is -0.004, but it is not statistically significant. This indicates that the construction of smart cities may affect air quality through technological innovation paths. Furthermore, to test whether smart city construction improves the ambient air quality through the technological innovation path, a bootstrap intermediary test was conducted, as shown in Table 7. The test results show that both indirect and direct effects are significant at the 1% level, and the confidence interval does not contain 0, indicating that a path does exist, that is, smart city construction affects the air pollution index through the technological innovation path.
Fig. 3.
Probability distribution density function diagram of propensity score values. a) Before matching, b) After matching.
Testing of Marketization Level Mechanism. Using the method of Zeng and Wu (2020) [30], we build prefecture-level city marketization index (recorded as market). To test whether the construction of smart cities improves air quality through market-oriented paths. The regression results are shown in Tables 7 (4) - (5). Table 7 (4) shows that the regression coefficient of smart city construction on the marketization index is 0.019, and it is significant at the 1% level. This indicates that the construction of smart cities has accelerated the improvement of the marketization level. Compared to non-pilot cities, smart cities can increase the number of patent applications per thousand by 23.2%. The construction of smart cities helps to enhance urban innovation. However, it is difficult to translate relevant patent achievements into actual production services, resulting in an insignificant improvement effect of urban innovation on environmental air quality. Table 7 (5) regression results show that the regression coefficient of smart city construction to air pollution index is -0.061, and hence it is significant at the 1% level. The regression coefficient of the marketization index to the air pollution index is -0.069, but it is not statistically significant. To test whether the construction of smart cities has improved ambient air quality through the market-oriented path, a bootstrap intermediary test is further conducted, as shown in Table 7. The test results show that both indirect and direct effects are significant at the 1% level, and the corresponding confidence intervals do not contain 0, indicating the existence of this path. That is, the construction of smart cities can improve urban ambient air quality by enhancing the level of marketization. Compared to non-pilot cities, smart cities have increased their level of marketization by 1.9%. The improvement of marketization level can promote a 6.9% reduction in ambient air pollution in smart cities. Compared to the urban innovation path, smart cities can better improve ambient air quality through market-oriented horizontal paths. This is related to the characteristics of urban innovation and market-oriented horizontal. Urban innovation has the characteristics of long cycles, high risks, and high economic costs. However, the level of marketization is mainly related to the relevant policies introduced by the central and local governments, and policies related to marketization are more likely to have short-term effects.
Table 7.
Testing for intermediation effects.
Heterogeneity Analysis
Analysis of the Heterogeneity of Urban Population Size. Due to the different sizes of urban populations, concentrated production factors, and environmental pollution issues, the impact of smart city construction on its ambient air quality will also vary. To test the existence of this heterogeneity, we drew inspiration from the “Notice on Adjusting the Standards for Urban Scale Classification” issued by the State Council in 2014 to classify cities into four categories: small cities, medium-sized cities, large cities, and megacities and conducted regression analysis separately. Because the sample cities in this paper are prefecture level or above, and the data in small cities are very small, the sample data for small cities are deleted. The regression results are shown in Tables 8 (1) - (3). Table 8 (1) - (3) shows that the construction of smart cities inhibits the urban air pollution index. The largest and most significant negative impact is in medium-sized cities, followed by large cities, while the impact is not statistically significant in those with a population size of over 5 million. This is perhaps because when the size of a city is small, the construction of smart cities mre easily transforms the existing infrastructure and penetrates new types of infrastructure, and its positive environmental effects are more apparent. The ambient air challenges faced by large cities are more complex and diverse, and due to the homogenization phenomenon of smart city construction, the improvement of ambient air quality by smart city construction is actually lower than that of medium-sized cities. Especially in cities with extremely large populations, where the industrial structure is basically high-end and service-oriented, the urban ecological environment is relatively better, and cities place more emphasis on livability to attract talent gathering, the difference in environmental effects caused by the construction of smart cities is relatively small.
Table 8.
Heterogeneity analysis.
Analysis of Urban Location Heterogeneity. The impact of smart city construction on ambient air quality may vary depending on the region in which the city is located, and this is perhaps due to the different levels of economic development and natural endowments in different regions where the city is located. To test the existence of this difference, we grouped the sample cities by eastern, central, and western regions. The regression results are shown in Tables 8 (4) - (6). The inhibitory effect of smart city construction on the air pollution index varies in different regions, from the largest to the smallest in the middle, west and east. The eastern region is the lowest, which may be because the economy of the eastern region is dominated by the tertiary sector of the economy, especially the high-tech industry, and the air environment quality is better than that of the central and western regions. The difference in the impact of smart city construction on the ambient air quality is relatively small. The economy of the central and western regions is mainly secondary sector of the economy, mainly consuming natural resources, especially low-end and high energy consuming industries. The air pollution is relatively serious. The impact of smart city construction on ambient air quality is quite different.
Testing for Moderating Effects
The previous analysis showed that the construction of smart cities can significantly improve the air quality of urban environments. Due to the differentiated social characteristics of each city, there are differences in the policy effectiveness of smart cities. We discuss whether there is a moderating effect on the differentiation level of fiscal autonomy, local government environmental regulation intensity, and industrial structure upgrading.
Analysis of the Moderating Effect of Fiscal Autonomy. Previous studies have found that the deeper the degree of fiscal autonomy, the more favour it is for local governments to flexibly extract financial funds for environmental protection (Ben and Li ( 2017) [35]. Specifically, in the construction of smart cities, the deeper the degree of financial autonomy, the more conducive it is for local governments to flexibly allocate financial funds for smart special projects, and to improve ambient air quality. Using Ran et al. (2021) [31], we construct a fiscal autonomy regulatory effect index, recorded as fiscal. Using the interaction term of the dummy variable of the smart city pilot policy to multiply by the fiscal autonomy index, we explore whether fiscal autonomy has a moderating effect, and the regression results are shown in Table 9 (1). Table 9 (1) shows that the regression coefficient of the interaction between smart city policy and fiscal autonomy index is -0.204, and it is significant at the 1% level. That is, with the increase in urban financial autonomy, the improvement effect of smart city construction on urban ambient air quality shows an increasing trend. Due to the large amount of special funds required for the construction of smart cities, and based on the characteristics of Chinese society, the construction funds for smart cities mainly come from local governments. However, due to the fiscal decentralization policy, the funds that local governments can mobilize are limited. As fiscal autonomy increases, local governments have more funds to invest in the construction of smart cities, which helps to implement smart scenarios.
Table 9.
Testing for moderating effect.
Analysis of the Moderating Effect of Local Government Environmental Regulations. Cities with stronger local environmental regulations are usually areas with more severe pollution. Under the requirements of the central government’s environmental laws and regulations, environmental regulations in these areas may become stronger, and smart city construction projects may tilt towards environmental supervision. Refined environmental regulation will increase the cost of pollution control for enterprises, stimulating them to turn their profitable high pollution production into hidden production, and thereby increasing the scale of the hidden economy (Yu and Gao, 2015) [36]. The hidden economy of high pollution leads to the further expansion of industrial waste emissions, thus affecting ambient air quality. Therefore, strong local environmental regulations may have a negative impact on the ambient air quality effect of smart cities. To test whether there is such a reverse adjustment effect, using Chen and Chen (2018) [32], we measured the intensity indicators of local government environmental regulations, recorded as era. The regression results are shown in Table 9 (2). Table 9 (2) shows that the regression coefficient of the intersection of smart city policies and local government environmental regulation intensity index is 0.130, and this is significant at the 1% level. That is, with the deepening of local government environmental regulations, the construction of smart cities has actually weakened the improvement of urban ambient air quality. When environmental regulations are too strict, it is possible to force enterprises to reduce production scale or conceal pollution emissions, ultimately leading to increased environmental pollution.
Analysis of the Moderating Effect of Industrial Structure Upgrading. Because the urban economy has the typical characteristics of secondary sector of the economy and the tertiary sector of the economy agglomeration, the traditional secondary sector of the economy has the tendency of resource based industries with high energy consumption and high pollution, leading to an increase in the emissions of industrial wastewater, exhaust gas, smoke and dust, and greater pressure on the urban ecological environment air quality, thus leading to the impact of smart city construction on the environmental air quality, and this will vary according to different urban industrial structures. To test the existence of this regulatory effect, drawing inspiration from Gan (2011) [33], we construct indicators for industrial structure upgrading (recorded as isui) . The regression results are shown in Table 9 (3). The regression coefficient of the interaction between smart city policies and industrial structure upgrading is -0.115, and this is significant at the 10% level. This shows that with the upgrading of industrial structure, the inhibitory effect of smart city construction on the air pollution index is increasing. The process of upgrading the industrial structure of smart cities is the process of industrial intelligent transformation. The intelligent transformation of industries can help improve the efficiency of industrial resource utilization, especially in high energy consuming industries, which can help reduce pollution emissions.
Conclusions
Research Findings and Recommendations
This paper mainly studies the impact of smart city construction on ambient air quality. Based on China’s urban panel data from 2005 to 2020, taking the national smart city pilot as a quasi-natural experiment, the air pollution index is constructed by using per capita industrial wastewater emissions, per capita industrial SO2 emissions, per capita industrial soot emissions, per capita CO2 emissions, and the average annual concentration of PM2.5 to measure urban ambient air quality. Using the multi- period double difference method, we study the impact of smart city construction on urban ambient air quality. The research conclusions are as follows: First, smart city construction significantly reduces the air pollution index and improves the urban ambient air quality, and this effect has a self-reinforcing trend with the improvement of smart city construction level. Second, further transmission mechanism testing shows that the construction of smart cities improves urban ambient air quality by enhancing urban technological innovation and marketization levels. Third, heterogeneity analysis shows that the construction of smart cities has a higher improvement effect on the ambient air in medium-sized cities than in large cities, and a greater improvement effect on the ambient air in the central and western regions than in the eastern regions. Finally , analysis of moderating effect shows that with the deepening of fiscal decentralization and upgrading of industrial structure, the effect of smart city construction on improving ambient air quality is showing an increasing trend. However, the increased intensity of environmental regulations by local governments has actually suppressed the improvement effect of smart city construction on ambient air quality.
In view of this, the following suggestions are proposed:
First, the government needs to optimize top-level design and delegate more financial autonomy. Due to the complexity of the urban ambient air system, involving both internal and external factors, it is necessary to strengthen the top-level design of smart city construction to improve the quality of ambient air through smart city construction. Supported by a large amount of data and based on the interconnection of national data, the smart ecological environment should be integrated with e-government, smart transportation, and smart health care. The integration of smart education and other aspects makes people’s travel more convenient, living more comfortable, and the environment better. On the other hand, the construction of smart cities requires a large amount of financial support. China’s smart city construction is led by local governments. Only by delegating more financial autonomy can local governments more flexibly allocate funds to tilt towards smart city construction, accelerate the construction of smart cities, and then promote air quality improvement.
Second, local governments need to consolidate technological progress and improve the level of marketization. The construction of smart cities is not only an important source and is carrier driven by urban technological innovation, but is also an important carrier for exploring the high-tech industry market. Therefore, in the process of promoting smart city construction, local governments should consolidate technological progress, increase support for new generation information technology innovation and technology biased guidance, and accelerate the integration of the Internet of Things, cloud platforms, and artificial intelligence. On the other hand, a market-oriented approach should be established, gradually introducing a government enterprise co-construction model, and allocating a reasonable proportion of co- construction to ensure the decision-making power of enterprises, encourage them to actively participate in the construction of smart cities, and improve the level of marketization.
Third, local governments should pay attention to implementing policies tailored to the city and strengthen the upgrading of industrial structure. Due to the different effects of smart city construction on the ambient air quality of different cities, the specific overall plan for smart city construction should not be copied from other cities to reduce costs. The overall plan must be formulated based on the city’s own environmental air conditions and social population economic conditions, and implemented according to the city’s policies. At the same time, it must be noted that although the construction of smart cities can enable cities to enhance their monitoring and decision-making capabilities for environmental air pollution sources through technological means, thereby improving air quality, the true determination of a city’s air quality foundation is its natural ecology, industrial structure, and other economic and social conditions. Therefore, in the process of building a smart city, we must actively promote industrial digital transformation and structural upgrading, constantly promote the natural, social and ecological virtuous circle of the city, and create a livable urban environment.
The theoretical contributions of this paper are listed below. First, in order to comprehensively consider the factors that cause air pollution, we use entropy method to build air pollution index, providing new measurement methods for studying air pollution. Second, we analyse the self-strengthening effect of smart city construction on ambient air quality. That is, we categorizes smart cities according to their scores and examines the impact of smart cities on ambient air quality at different construction levels. Third, we analyse the impact path of smart city construction on ambient air quality from a market-oriented perspective, providing some reference for the market-oriented reform direction of the government; Then, we discuss the moderating effects of different social endowments (fiscal autonomy, local government environmental regulation intensity, and industrial structure upgrading) on the ambient air quality effects of smart city construction, to provide suggestions for overcoming the obstacles in the construction of smart cities.

