

Introduction
Organic dyes are the crucial components of the fine chemical industry, with extensive application in various fields, such as fabric, plastic, leather, paint, paper manufacturing, and the food and beverage industries [1-3]. However, the production and utilization of these compounds result in a large amount of colored wastewater. Considering their high solubility in water, it is expected that around 10%~20% of the dyes will be lost in the wastewater during the manufacturing process, with almost 50% entering the wastewater flows during coloring and other related procedures [4-6]. It has been reported that specific azo dyes, particularly an extensive array of reactive dyes and their resulting byproducts, have been demonstrated to exert detrimental impacts on human well-being [7]. These effects encompass eliciting hyperimmune responses, inducing cellular damage and inflammatory reactions, and potentially instigating carcinogenesis subsequent to human exposure [8-10]. Thus, their removal from the wastewater before being discharged into the environment is of great importance. Among the extensively employed techniques for achieving this objective are coagulation, flotation, adsorption, advanced oxidation, microbial degradation, membrane separation, and similar approaches [11-18]. The adsorption process is considered as a relatively efficient method for the removal of dyes and other organic pollutants [19].
Various kinds of adsorbent materials have been employed to eliminate dyes from wastewater, such as activated carbon, carbon nanotubes, Graphene-based materials, and so on [20-24]. Notably, carbon xerogels, an emerging porous nanomaterial hitherto developed over the past three decades, have gained significant popularity and proven to be remarkably efficacious as adsorbents for pollutants present in the liquid phase [25-27]. Magdalena et al. studied the adsorption of anionic dyes by carbon xerogels, which showed that the adsorption capacity ranged from 83 to 140 mg·g-1, higher than conventional activated carbon [28]. Some studies have shown that the adsorption of methyl red and rhodamine dyes on carbon xerogel is significantly better than that of carbon nanotubes functionalized with -COOH [29, 30]. Other studies have shown that carbon xerogel has a better adsorption effect on EBT dyes than biochar [31, 32]. Furthermore, in order to further improve the adsorption capacity for macromolecular pollutants, we can also use the advantage of adjustable pore size of carbon xerogel to prepare mesoporous carbon xerogel (MCX) with rich mesopores by adjusting the proportion of raw materials and reaction parameters during the synthesis process.
In this study, the preparation of a sequence of MCX with varying pore sizes and the adsorption mechanism of Reactive blue 13 (abbreviated as RB13) were evaluated. The primary purposes of this study were varied: (i) to ascertain the optimal ratio of raw materials for the synthesis of MCX; (ii) to analyze the relationship between adsorbent dosage and its effects, contact time, contaminant concentrations, and adsorption temperature on the adsorption process pertaining to RB13; (iii) to reveal the underlying adsorption mechanism through analysis encompassing adsorption isotherm and kinetic models; and (iv) to further elucidate the correlation between structure and adsorption capability via a comparative assessment of pore structure, surface topography, and functional groups of MCX before and after adsorbing.
Experimental
Chemicals and Materials
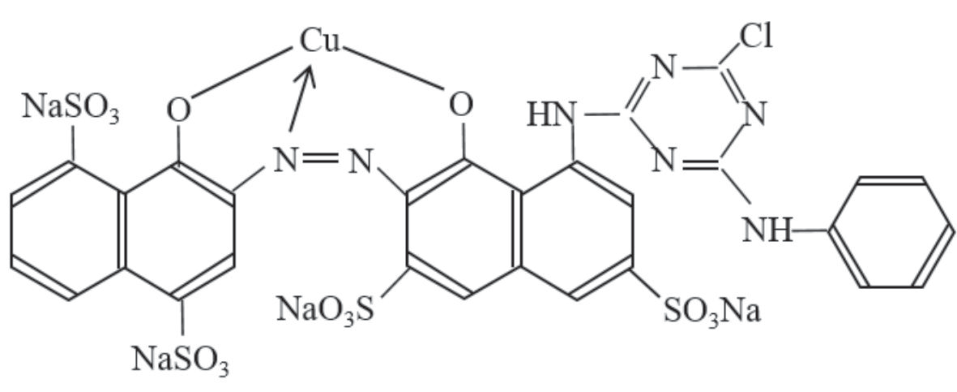
All utilized chemicals were of analytical purity without any purification, and deionized water was used throughout the experiments. Resorcinol, formaldehyde aqueous solution (40 wt. %), sodium carbonate and acetone were supplied by Shanghai Hushi Laboratory Equipment Co. LTD. RB13 was purchased from Aladdin (Shanghai) Reagent Co. LTD. Its chemical structure was shown in Fig. 1.
Preparation of Mesoporous Carbon Xerogels
The organic gels were synthesized according to the method of Pekala (Fig. 2) [25]. 11 g of resorcinol (R) and different doses of sodium carbonate as the catalyst (C) were dissolved in 10 ml of deionized water by stirring at 600 rpm for 30 minutes at room temperature. After homogenizing with 15 g formaldehyde aqueous solution (F), the solution was stirred for 60 minutes and poured into glass tubes (i.d. 6 mm, length ca. 10 cm), which were then sealed by parafilm and cured successively in the drying oven at 298 K for 1 day, 323 K for 1 day and 353 K for 5 days. Over the above one-week aging, the dark red hydrogels were formed. Here several molar ratios of resorcinol to catalyst (R/C) were set at 100, 250, 500, 1000, 1500, 2000 and 3000 in order to obtain the optimal mesoporous size of carbon gels. The constant molar ratio of resorcinol to formaldehyde (R/F) of 0.5 was maintained throughout the synthesis. Owing to the undesirability of water for the drying process, the diluent water in the pores was replaced by acetone. Specifically, the aged gel rods were taken out of the glass tubes and immersed into acetone solution, and then extracted for 10 minutes by ultrasonic method three times, renewed with fresh acetone every time. After solvent exchange step, the gels were carbonized in a tube furnace (OTF-1200X, Hefei) under a high purity nitrogen atmosphere (99.996%) where the nitrogen flow was 25 mL·min-1. The carbonization program consisted of increasing the heat to 383 K at a rate of heating of 0.5 K·min-1, keeping for 5 h and then heating to 1173 K with a heating rate of 5 K·min-1, maintaining for 3 h. The carbon xerogels samples were finally ground to 0.074 mm size. Accordingly, a series of mesoporous carbon xerogels (abbreviated as MCX) were obtained for use, which were notated successively as MCX100, MCX250, MCX500, MCX1000, MCX1500, MCX2000 and MCX3000 (the number indicated the R/C molar ratio in the recipe, and as the number increased, the amount of catalyst added decreased). Schematic representation of prepared MCX was shown in Fig. 2.
Characterization and Analysis of Mesoporous Carbon Xerogels
The surface area and porosity of the MCX samples were determined via N2 adsorption/desorption isotherms with an Automatic Surface Area & Porosimetry Apparatus (ASAP 2020, Micromeritics, USA). The surface areas (SBET), mesopore volume (Vmeso) and pore diameter (Dpore) were calculated using Brunauer-Emmett-Teller (BET) equation (p/p0 < 0.3), t-plot method (p/p0 = 0.99) and Barrett-Joyner-Halenda (BJH) pore size distribution model (p/p0= 0.2-0.5), respectively.

Surface morphologies of MCX were examined by the Scanning Electron Microscopy (SEM) (TM-3000, Hitachi, Japan). The samples were attached to the sample holder using adhesive carbon tape and sprayed with Au against charging, and then tested at 100,000 times magnification in a high vacuum mode.
The structure and functional groups of MCX were characterized by Fourier Transform InfraRed Spectrometer (FT-IR) (Nicolet IS10, Bruker, Germany). The FT-IR spectrum was obtained under the condition of 400~4000 cm-1 of scan range, 4.0 cm-1 of resolution and scanning 32 times.
Adsorption Experiments
In the laboratory, batch adsorption experiments were performed by mixing a 50 mL solution of RB13 with the MCX samples at 180 rpm and 298 K for 12 hours to achieve apparent equilibrium. Afterwards, the mixture was separated by filtering with a 0.45 µm syringe filter, the residual dye concentrations in the filtrate were measured using a UV-VIS Spectrophotometer (U-3900, Hitachi, Japan). The measurements were taken at the wavelength of maximum absorbance of RB13 (λmax = 596 nm). Subsequently, the RB13 adsorption capacity on the MCX samples was determined by calculating Eq. (1):
Where qe (mg·g-1) represents the equilibrium adsorption capacity of the dye per unit weight of the adsorbent, C0 and Ce (mg·g-1) are the initial and equilibrium concentrations of RB13 in solution, V (L) is the volume of solution, and m (g) is the mass of a given MCX adsorbent.
The effect of adsorbent dosage, initial dye concentration, temperature and contact time on the adsorption of RB13 on MCX were tested, and the isotherms, thermodynamics and kinetics of the adsorption process were obtained accordingly. The pH of the RB13 solution used in the experiment was about 6.8-7.0, which was within the pH range of the actual dyeing wastewater, so no further adjustment was made.
Data Analyzing Method and Model Evaluation
In this study, the software of Excel 2016 (Microsoft Office, USA) and Origin 9.1 (Origin Lab Corporation, USA) were used for the data analysis and statistics. Meanwhile, several mathematical models (Table 1) were selected to fit the data collected from the RB13 adsorption onto the MCX1000 experiment. Because of the inherent bias created by linearization of adsorption models, the nonlinear models have been used here.
The kinetics of pollutants adsorption onto adsorbents holds vital significance in the selection of optimal testing conditions for the adsorption process with the batch technique. The kinetic parameters, crucial for predicting the rate of adsorption, furnish valuable information for the design and modeling of adsorption processes. In this investigation, the kinetics of RB13 adsorption onto MCX1000 were scrutinized employing pseudo-first order, pseudo-second order, intra-particle diffusion, and Elovich models.
The adsorption isotherm, delineating the state of equilibrium between the adsorbent and the adsorbate at a specific temperature, functions as a significant instrument in comprehending the adsorbent’s adsorption performance and mechanism. Moreover, it facilitates the assessment of whether the adsorption process conforms to a specific adsorption model. To determine the most suitable isotherm and validate the adsorption mechanism, the data were analyzed considering Freundlich, Langmuir, Temkin, Dubinin-Radushkevich, Redlich-Peterson and Koble-Corrigan isotherm equations.
Adsorption thermodynamics unveils the energy conversions and thermal equilibrium that underlie the adsorption process through the characterization of adsorption enthalpy (ΔH°), adsorption entropy (ΔS°), and adsorption free energy(ΔG°). This enables the evaluation of the reversibility of adsorption reactions and the influence of thermal effects on reaction rates.
Table 1.
Kinetic, isotherm and thermodynamic equations used in this study.
Results and Discussion
Characterization of MCX Adsorbents
Characterization of Pore Structure
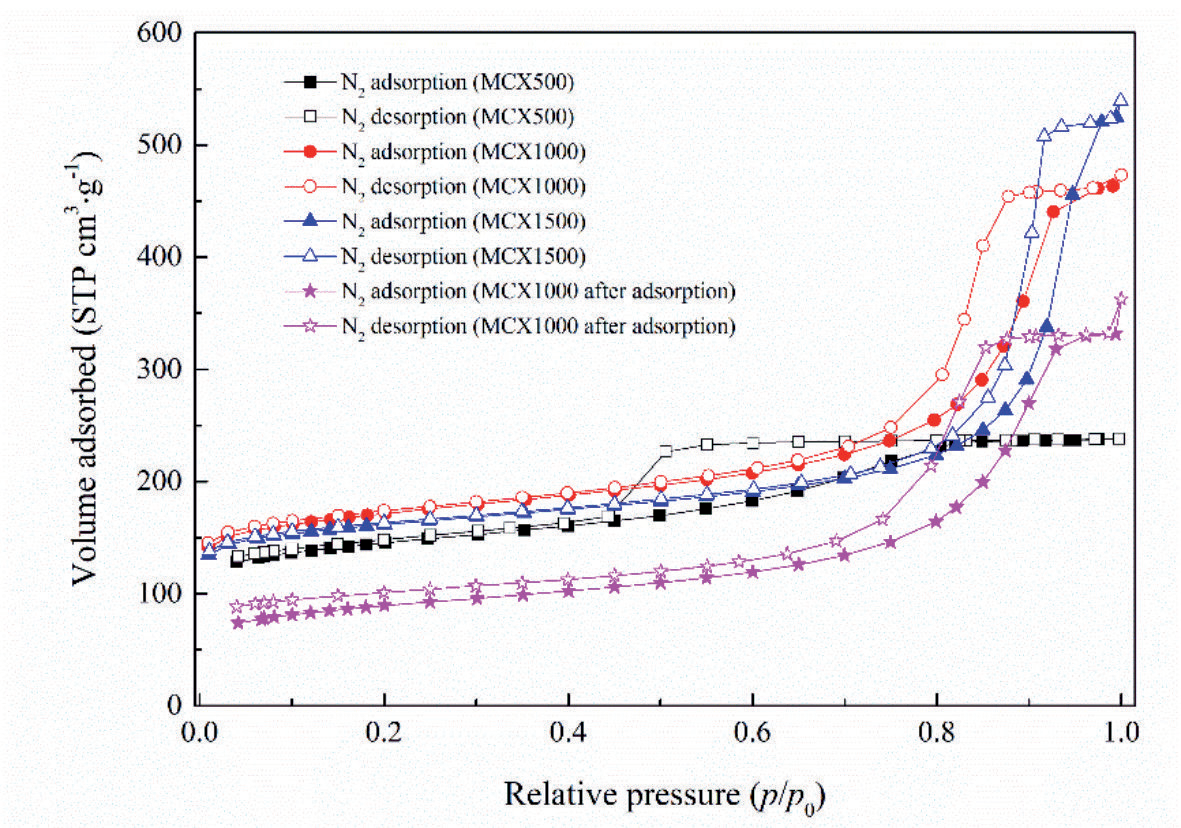
The structural and textural properties of MCX samples can be determined through detailed characterization. The pore size distribution and pore characterization of MCX samples are shown in Fig. 3 and Table 2, respectively, with varying amounts of catalyst. As evidenced by Fig. 3, the N2 adsorption/ desorption isotherms exhibited the attributes of Type IV isotherms, signifying the presence of mesoporous structures in the prepared sample [32]. Additionally, hysteresis occurred during the capillary condensation phase at relative pressure p/p0=0.9, indicating the existence of a large sized mesopore in the sample. This result was similar to the adsorption curve obtained by María Canal-Rodríguez’s characterization of N-doped carbon xerogels [33]. Notably, among all the prepared samples, MCX1000,which was synthesized at an R/C molar ratio of 1000 had the largest specific surface area of 583.8 m2·g-1.
Table 2.
N2 adsorption performance parameters.
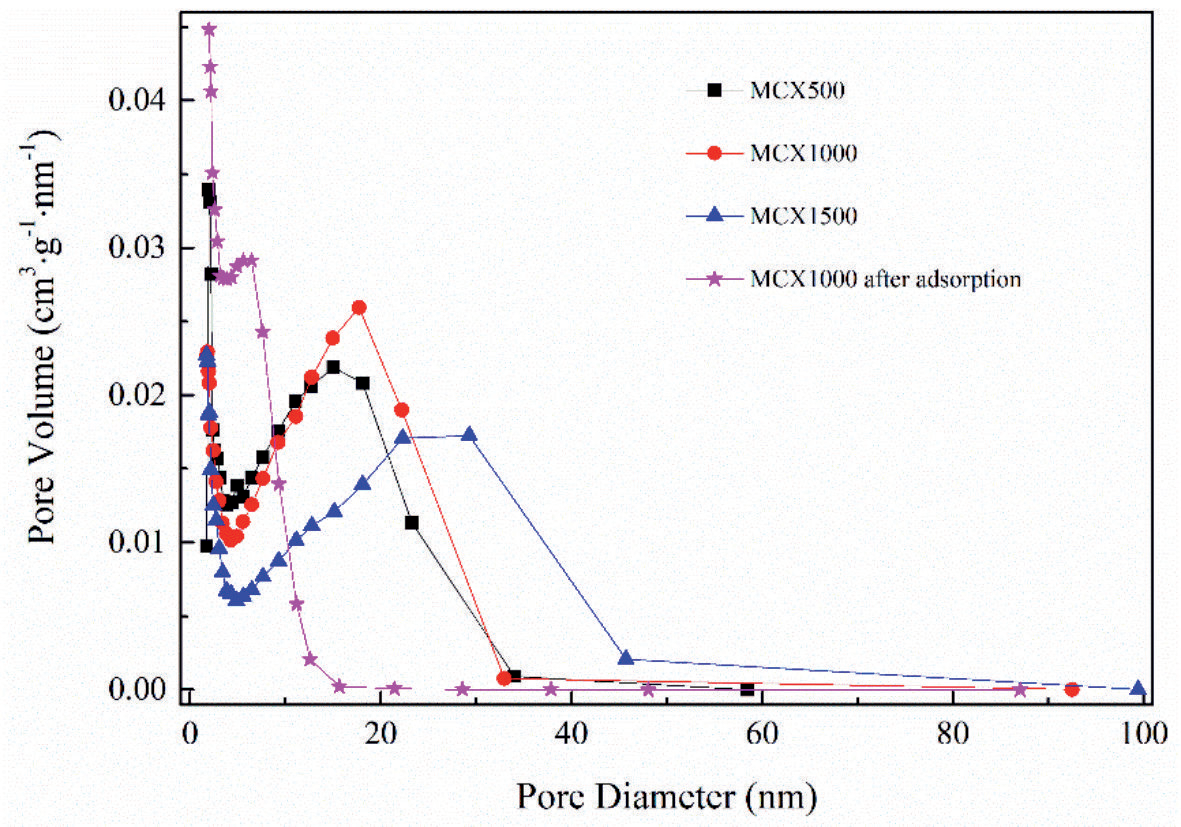
Fig. 4 presented the pore-size distribution analysis of the MCX samples. For MCX1000, the microspores showed an average diameter ranging from 1.7 to 2 nm, while the mesopores have average diameters between 2 and 32 nm. Similarly, for MCX1500, the microspores displayed an average diameter within the range of 1.7-2 nm, whereas the mesopores showed average diameters spanning from 2 to 45 nm. In the case of MCX500, the mesopores presented an average diameter varying from 2 to 12 nm. Notably, the pore-size distribution profiles of these mesoporous carbon xerogels showed a main distribution of 2-45 nm, also indicating that these materials were composed of a large amount of mesopores. The pore size distribution peaks of the carbon gels experienced a decreasing trend after the adsorption of RB13, while an increased presence of a limited number of micropores. This phenomenon could primarily be attributed to the adsorption of RB13 molecules on the surfaces of mesopores and macropores in the carbon gels, leading to some macropores being blocked. Additionally, as shown in Table 2, there was a notable decline in both specific surface area and pore volume of the adsorbed carbon gel, indicating that RB13 was adsorbed successfully onto the MCX1000.
SEM
SEM images of the samples were presented in Fig. 5. It was noted that the mesoporous carbon xerogels were composed of nano-sized particles with distinct particle sizes as depicted in Fig. 5(a, b, c). Specifically, the size range of MCX500, MCX1000, and MCX1500 was approximately 10 nm, 50 nm, and 100 nm, respectively. Therefore, the size of the mesoporous carbon xerogel particles decreased as the amount of added catalyst increased. The main reason was that the acidity or alkalinity of the initial solution during the preparation would have a certain influence on the properties and surface morphology of the absorbent. With the increase of the amount of sodium carbonate, the pH also rose, which affected the properties of the absorbent surface. Moreover, compared with the morphology of MCX1000, the surface structure after adsorption of MCX1000 was smoother and fuller. Consequently, the uniform adsorption of RB13 onto the surface of MCX1000 was demonstrated.
FT-IR
In order to gain detailed insights into the chemical composition of MCX1000 and verify the successful sorption of RB13 onto it, we conducted FT-IR characterization analysis on the MCX1000 samples as depicted in Fig. 6. The characteristic peaks of MCX1000 could be observed from the black curve. It was established that the stretching vibrations absorption peak of -OH is the broad absorption peak at 3320 cm-1. The -C-O stretching vibrations were responsible for the absorption band at 1060 cm-1.The blue curve revealed that MCX1000 after sorption featured both the old MCX1000 distinctive peaks as well as the new ones. The in plane deformation vibration of C=N caused the absorption peak at 1622 cm-1, which demonstrated a successful sorption of dye onto the MCX1000. Additionally, the vibrational peaks for -OH and -C-O were blue switched towards 3470 cm-1 and 1154 cm-1, respectively; the reason was that there was electrostatic attraction between dye molecules and -OH, -C-O and others, functional groups of MCX, hydrogen bond action, and van der Waals forces action.
Effect of R/C Molar Ratios and Dosages on MCX Adsorption
The structural characteristics of carbon xerogels could be affected by varying the molar ratio of resorcinol and catalyst (R/C), subsequently impacting the efficiency of pollutant removal by the carbon xerogels. Fig. 7 illustrated the removal of RB13 at different dosages of MCX with various R/C molar ratios. As the R/C molar ratio rose from 100 to 3000, there was an initial rise followed by a subsequent decline in the adsorption capacity of MCX for RB13.When the R/C molar ratio was less than 250, a limited quantity of dye molecules was adsorbed onto the surface of MCX due to the relatively lower specific surface area of MCX100 and MCX250. Subsequently, a sharp increment of RB13 removal as the R/C molar ratio further increased. The adsorbent MCX1000, synthesized at a R/C molar ratio of 1000 in the precursor mixture, exhibited the utmost adsorption capacity. As the R/C molar ratio exceeded 1500, the removal rate was gradually reduced, potentially attributable to the impact of the R/C molar ratio on the pore size, pore structure, and specific surface area of the carbon xerogels. When the molar ratio of R/C increased, the pore diameter became larger, the density decreased, and the specific surface area decreased (shown in Table 2 and Fig. 4), thereby polymer mesoporous carbon xerogels were formed, and otherwise colloidal granular mesoporous carbon xerogels were formed . Additionally, the R/C molar ratio exerted an influence on the pH of the prepared solution, thereby affecting the polycondensation of resorcinol and formaldehyde during the synthesis process
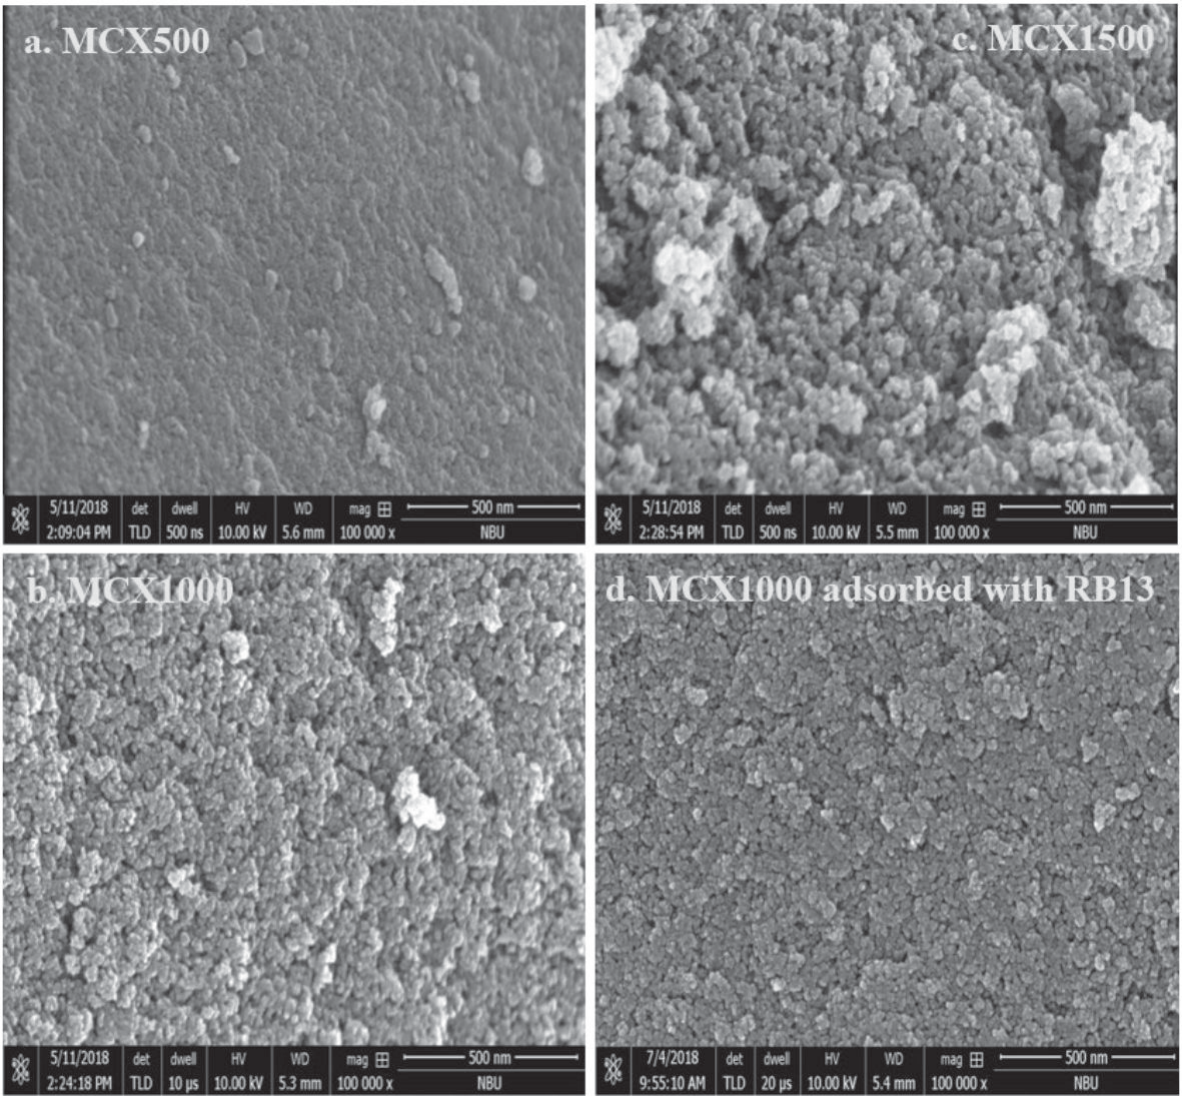
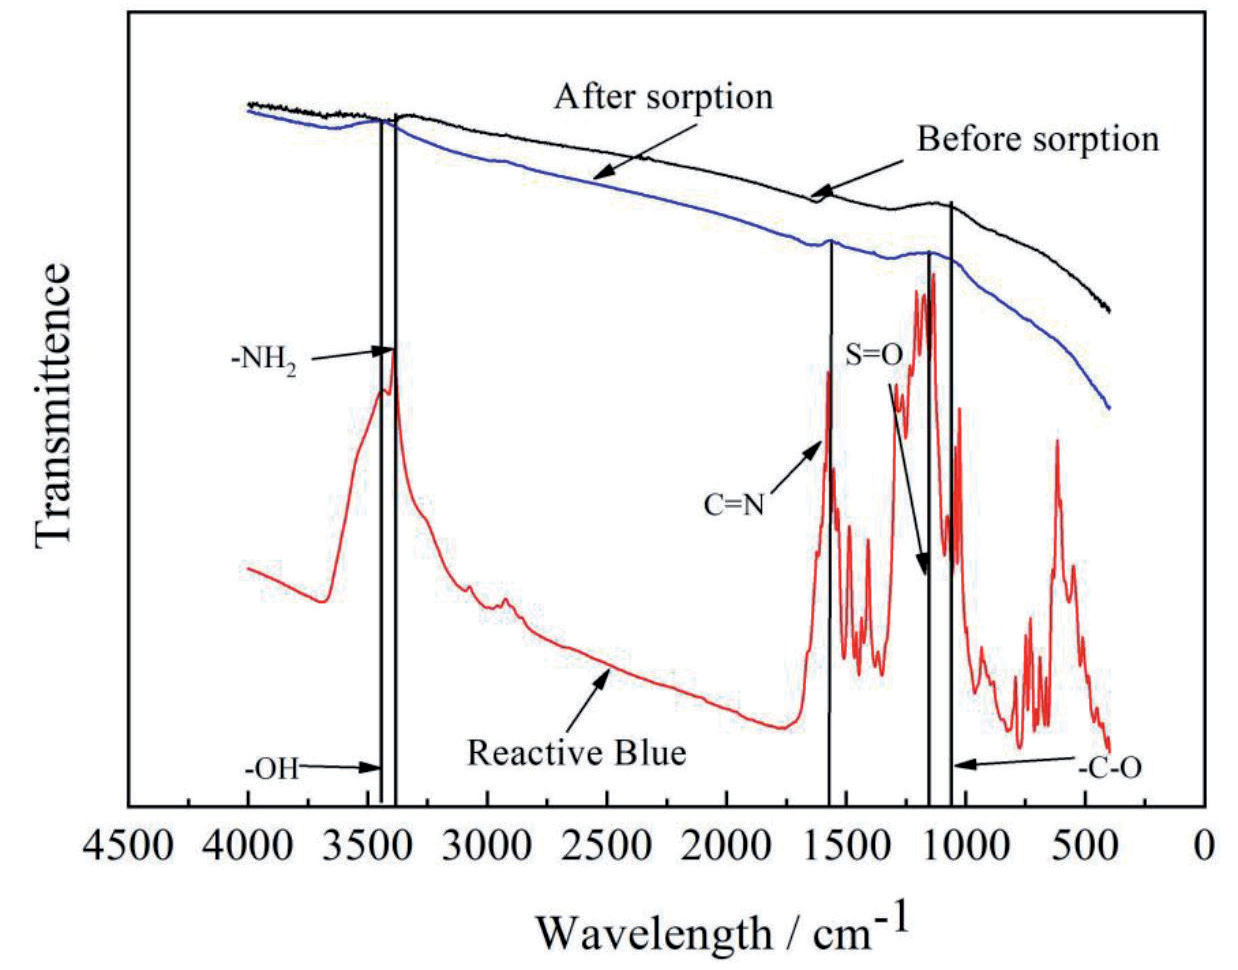
Fig. 7.
Effect of different dosages of adsorbent on the removal of reactive blue 13 (initial concentration of RB13: 30 mg·L-1; agitation speed: 180 rpm; temperature: 298 K; contact time: 12 h; adsorbent dose: 0.02~0.5 g·L-1).
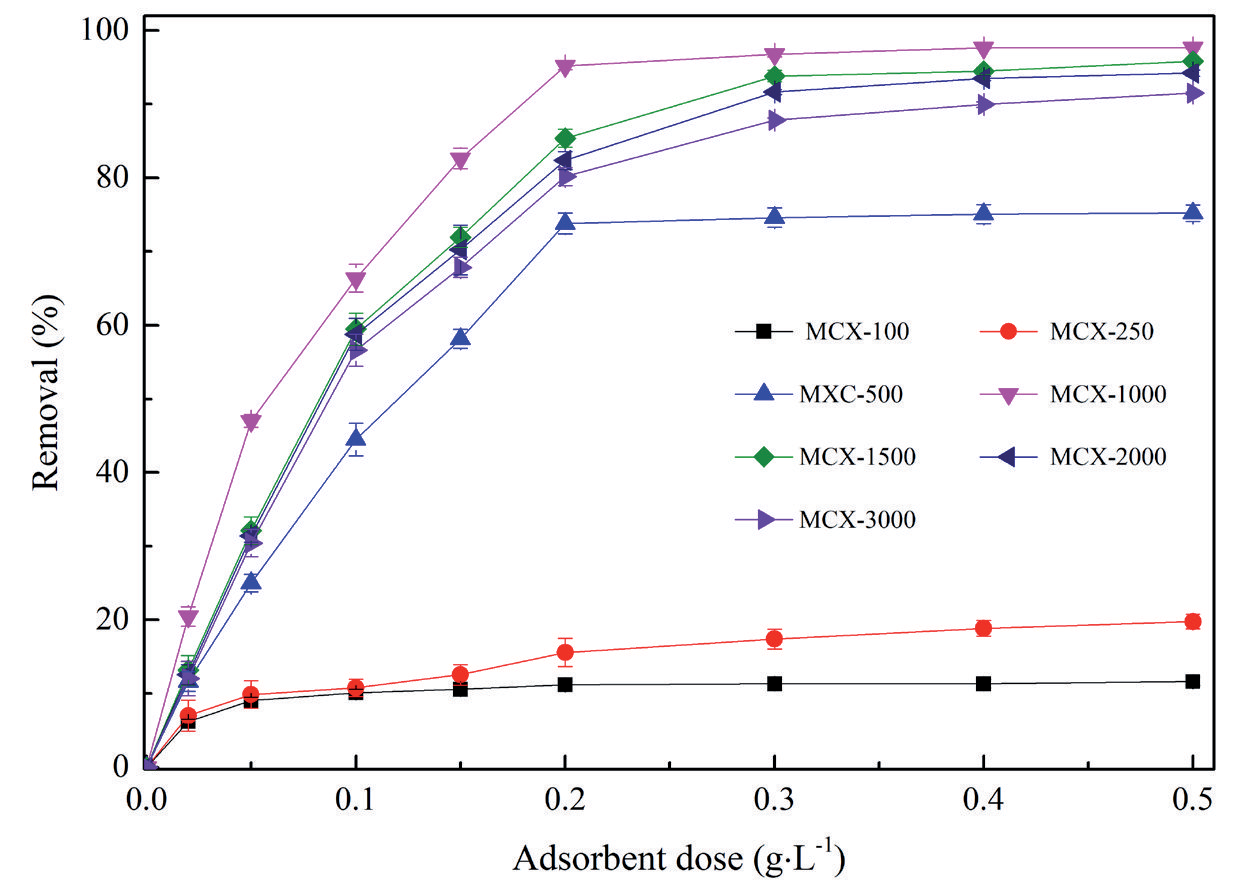
It was obvious that the removal of RB13 increased significantly initially and then increased slowly with the increment of adsorbent addition. When the dosage of adsorbent reached 0.2 g per liter of solution, the RB13 removal rate achieved a level exceeding 95% when utilizing MCX1000 as the adsorbent. This was mainly because more total specific surface area and effective adsorption sites were supplied accompanied with more adsorbent addition, and then limited dye concentration restricted the continued increase of the removal rate. Consequently, for the subsequent adsorption experiments, MCX1000 was employed as the adsorbent at a dosage of 0.2 g per liter of solution.
Adsorption Kinetics
Adsorption kinetics is of great significance for designing adsorption systems. The augmentation of RB13 adsorption manifested a significant upsurge within the initial 50-minute contact duration, and then the adsorption gradually increased within the next 200 minutes in Fig. 8. After a contact time of 240 minutes, prolonging the duration of contact did not yield any enhancement in the adsorption effect. Initially, the adsorption rate exhibited rapidity owing to the adsorption of dye molecules on the external surface. Subsequently, the molecules permeated into the pores (internal surface), which constituted a comparatively sluggish process. The initial swiftness in the adsorption rate could be ascribed to the abundant presence of adsorption binding sites, whereas the eventual deceleration in the adsorption rate arose from site saturation and the achievement of equilibrium.
In order to comprehend the kinetics of the adsorption process, specifically with regard to the rate constant order, and determine the suitable mechanism explanation for adsorption along with the potential rate-controlling step, the pseudo-first-order, pseudo-second-order, intraparticle diffusion and Elovich models were tested for the adsorption of RB13 onto MCX1000 (Fig. 8). The best fit model was chosen based on nonlinear regression correlation coefficients R2 values. All kinetic parameters obtained from fitting model plots with experimental data are presented in Table 3. It became apparent that the adsorption process closely conforms to the pseudo-second-order model, suggesting that chemical action primarily governs the adsorption process. This is consistent with the results of the study of negative dyes by Meriem [34]. Combined with FT-IR analysis, it can be inferred that hydrogen bonds dominate the RB13 adsorption process on both the inner and outer surfaces of MCX. The intraparticle diffusion curve does not originate from the origin, suggesting that intraparticle diffusion alone does not control the adsorption process entirely. The adherence of the adsorption efficiency to the Elovich model, as indicated by R2, implied the presence of chemical effects, including hydrogen bonds, between RB13 and MCX during the heterogeneous adsorption process [35].
Adsorption Equilibrium Isotherms
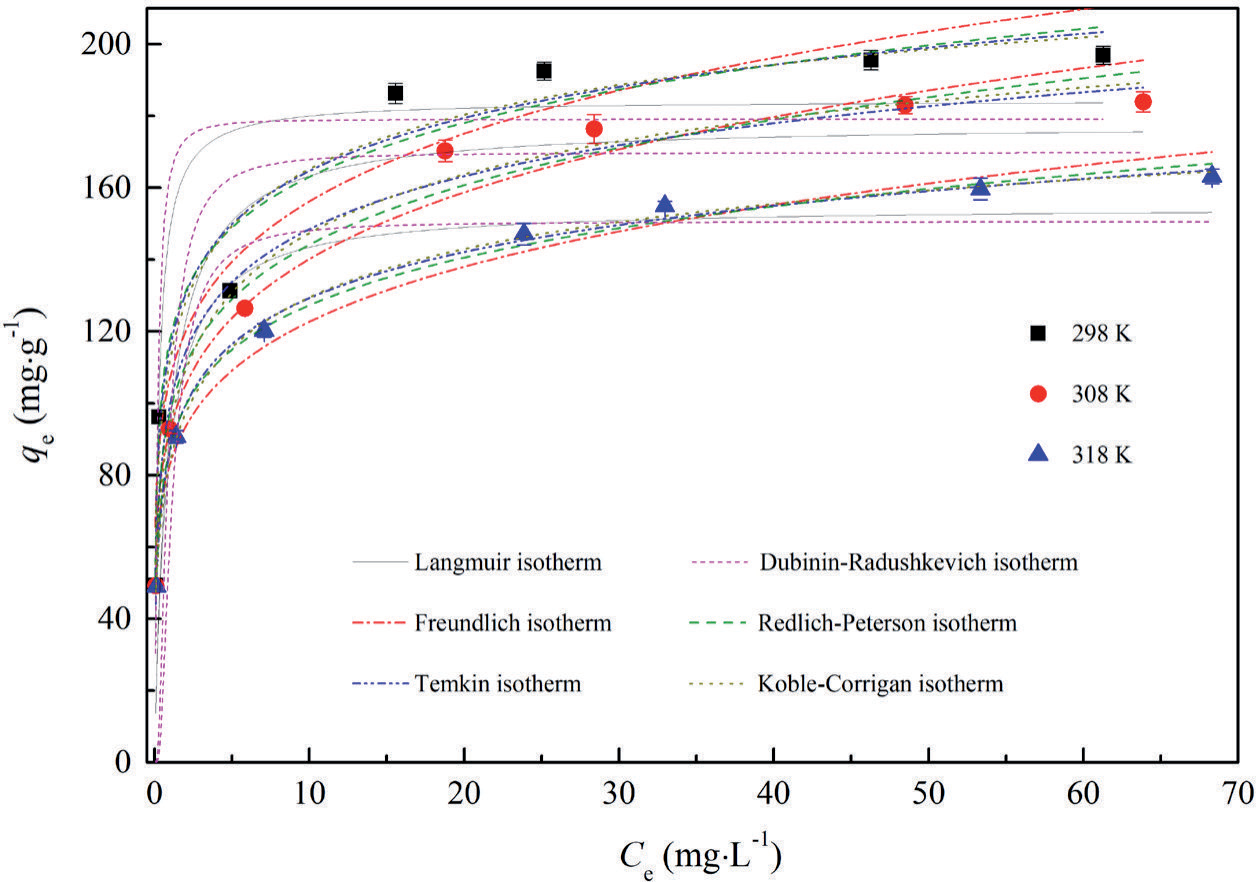
The adsorption isotherm is a curve that describes the adsorption equilibrium between an adsorbent and an adsorbate, revealing the fundamental characteristics and mechanisms of the adsorption process through its shape, adsorption capacity, and equilibrium properties. It can be interpreted from Fig. 9 that the adsorption of RB13 on MCX increased as the initial concentration increased. However, equilibrium is reached once the saturation point is achieved, meaning that all effective adsorption sites on MCX have become saturated. As presented in Table 4, the maximum equilibrium adsorption capacity could reach up to 184.36 mg·g-1.
From Fig. 9, it could be observed that the three models, namely Temkin, Koble-Corrigan, and Redlich-Peterson exhibit excellent fitting. The R2 values exceed 0.95, and as temperature increases, they further exceed 0.99. The Temkin isotherm demonstrated the occurrence of physical adsorption. During the adsorption process, electrostatic interactions between the MCX surface and RB13, along with non-chemical interactions such as van der Waals forces, manifested their influence. Furthermore, within the temperature range of 298 to 318 K, the upward trend observed in the equilibrium binding constant (B) of the Temkin model as the temperature decreases highlights the unfavorable nature of higher temperatures for the uptake of dye molecules [36]. On the other hand, the Koble-Corrigan adsorption model proved suitable for chemical adsorption, revealing that adsorption predominantly proceeds through chemical reactions involving chemical bonds and surface-active sites [37]. The Redlich-Peterson adsorption model proved to be apt for the hybrid physical and chemical adsorption. In this model, due consideration was given to the impact of non-uniformity and distribution in the number of adsorption sites. Within the Redlich-Peterson framework, physical adsorption operated predominantly through non-chemical interactions, such as van der Waals forces and electrostatic interactions. On the other hand, chemical adsorption ensues via chemical reactions facilitated by chemical bonds and surface-active sites [38, 39]. Hence, the adsorption consonant with the Redlich-Peterson adsorption model manifests dual characteristics of physical and chemical adsorption, thereby functioning synergistically through these two mechanisms. This assertion aligned harmoniously with the findings obtained from FT-IR. Consequently, it could be deduced that the adsorption of RB13 onto MCX was attributed to physicochemical adsorption.
Fig. 8.
Adsorption kinetics of RB13 onto MCX1000 and the kinetic models fitting (adsorbent dosage: 0.2 g·L-1; initial concentration of RB13: 30 and 60 mg·L-1; agitation speed: 180 rpm; temperature: 298 K; time: 0~400 min).
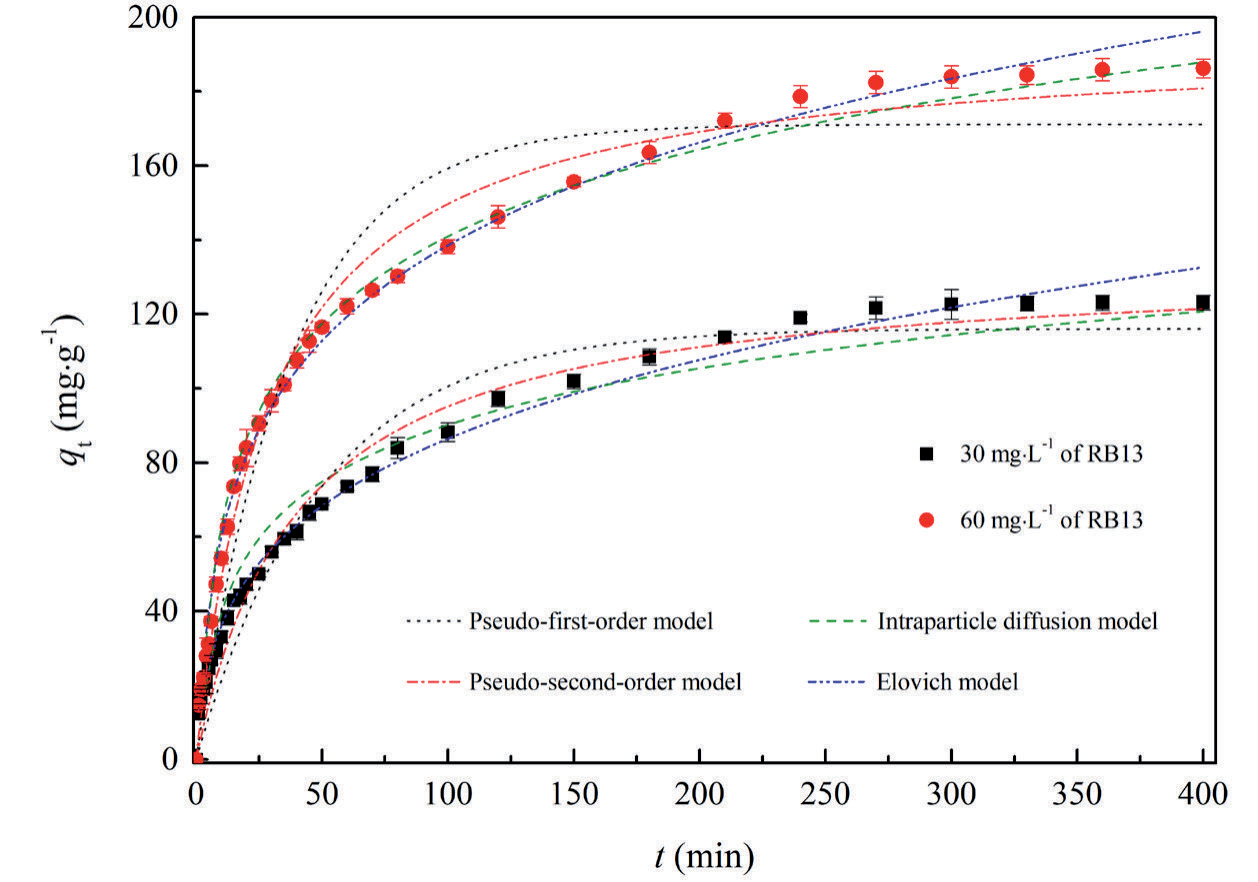
Table 3.
Fitting parameter values of kinetic models for adsorption process of MCX1000 to RB13.
Table 4.
Fitting data of different isothermal adsorption models for adsorption process of MCX1000 to RB13.
Adsorption Thermodynamics
The investigation of adsorption thermodynamics enables us to acquire a profound comprehension of the interconnectedness and alterations in energy that transpire throughout the adsorption process, thereby elucidating the mechanisms underlying adsorption and the disposition of adsorbate species on the surface of adsorbents.
The thermodynamic fitting of the data was conducted based on the prescribed formula, and the resultant outcomes were presented in Table 5. The value of the standard enthalpy of the reaction (ΔH°) implied that the RB13 adsorption was an exothermic process, so reducing the temperature facilitates the adsorption of the carbon gel to the RB13 adsorption, whereas the negative values of free enthalpy of sorption (ΔG°) indicate that the process was spontaneous [9, 38, 40].
Conclusions
This study demonstrates that mesoporous carbon xerogel presents itself as a promising adsorbent for RB13 removal. The findings reveal that the adsorption effect reaches its zenith when the molar ratio of resorcinol to sodium carbonate is at 1000:1 (MCX1000), and the optimal dosage is 200 mg·L-1, with an adsorption equilibrium time of 180 minutes. The maximum equilibrium adsorption amount attained is 184.36 mg·g-1. By means of FT-IR and SEM, the adsorption of nitrogen-containing ions or nitrogen-containing functional groups on RB13 via hydroxyl and carboxyl groups on the mesoporous carbon dry gel surface was validated. Moreover, electrostatic interactions, hydrogen bonding, and van der Waals forces were identified between the aforementioned nitrogen-containing species on RB13 and hydroxyl and carboxyl groups on the gel surface. The adsorption kinetics adhered to a pseudo-second-order model while the equilibrium adsorption process was modeled utilizing Temkin, Koble-Corrigan, and Redlich-Peterson models. Adsorption thermodynamics confirm that the adsorption was spontaneous, exothermic, and physicochemical.

