

Introduction
In recent years, the global climate has undergone significant changes characterized by warming, which has had a profound impact on human survival and development. This constitutes a major challenge shared by the international community today [1]. The United Nations Sustainable Development Goals (SDGs) seek to holistically address the social, economic, and environmental aspects of development, which includes the goal of “promote sustained, inclusive, and sustainable economic growth” (https://sdgs.un.org/ goals). At the 26th Conference of the Parties to the United Nations Framework Convention on Climate Change (COP26) in 2021, the Global Coal to Clean Energy Transition Statement was signed by 46 countries and 32 international businesses and institutions, while the International Public Support Statement for the Clean Energy Transition was signed by 29 countries (https:// www.gov.uk/government/topical-events/cop26). This indicates that countries around the globe are taking proactive measures to address the significant shifts in energy, environment, and socioeconomic development. It has become increasingly urgent to provide scientific and effective decision-making methods to help achieve the UN SDGs.
As a typical developing country, China has undergone over 40 years of reform and opening up, during which brutal economic growth, urbanization, and industrialization have accelerated the consumption of energy and ecological resources [2, 3], leading to a range of environmental problems that cannot be ignored. However, this has also resulted in a series of problems affecting sustainable development, including a significant wealth gap [4], unbalanced and insufficient regional economic development [5], high external technological dependence [6], and slowing economic dynamics. In particular, problems such as uneven energy distribution [7] and a regional mismatch between energy production and consumption [8, 9] have led to significant economic inefficiencies, posing great challenges to regional sustainable development. With the increasing pressure for energy restructuring and green low-carbon development, many regions are facing the dual challenges of improving the energy environment (EE) and socioeconomic (SE) development [10, 11], particularly in economic zones with relatively large disparities [12, 13]. Therefore, achieving the coordinated development of EE and SE has become a crucial issue for China to achieve its SDGs.
To the best of our knowledge, coordinated development is primarily based on the synergy between two or more systems that are promoted by interaction mechanisms. This can be used to measure the nonlinear interaction mechanisms between SE development and different subsystems of the EE [14, 15]. The relationship between EE and SE is not a single linear relationship, but rather a complex nonlinear relationship [16-18]. Therefore, this study will use this coupling mechanism to investigate the nonlinear interaction relationship between EE and SE.
The complex relationship between the EE and SE can be observed in two main aspects. Firstly, the EE is crucial for the survival and growth of human society, and the quantity and quality of energy development and utilization directly impact economic growth. Overconsumption of energy and environmental resources may hinder economic growth [19, 20]. In addition, environmental protection requires the structural transformation and upgrading of the economy [21]. Secondly, during the process of economic development, capital, labor, and technology may improve energy efficiency and facilitate the optimization and adjustment of energy structure [22]. However, economic structural changes, industrial factor aggregation, and economic operational efficiency rely on energy development, resulting in a structural energy waste problem [21, 23]. Therefore, the EE and SE are closely interrelated, mutually reinforcing and constraining, and may trigger regular and cyclical changes in the internal structure [24, 25]. This interaction effect can be regarded as a coupled coordination mechanism.
To investigate the coordinated development of SDG7 and SDG8 effectively, most studies focus on the maintainability and sustainability of regional development as a result of the coordinated development between two primary systems: the EE subsystem and SE subsystem [26-28]. Based on this notion, researchers have developed various frameworks to measure regional sustainable development from different perspectives. For example, Tzeremes et al. [29] investigated the relationship between state environmental degradation, energy consumption, and economic growth in 50 US states using a temporal causality method and yearly data from 1960 to 2010. Zuo et al. [30] used system dynamics (SD) to build a sustainable development model for China’s Beijing-Tianjin-Hebei area. To address the study’s thematic focus, an assessment index system was constructed based on the hierarchical structure of current energy development, environmental pollution control, the current status and scale of economic development, and social contribution. Regional economic growth is seen as a self-adaptive system with frequent internal interactions. However, the interdependent coordination between the SE development and the EE change is yet to be fully substantiated, making sustainable development a distant goal. Therefore, this study not only assesses each indicator’s contribution to sustainability but also investigates the coupled and coordinated development between the two dimensions.
To assess coupled coordination measures, mathematical modeling is often viewed as an effective means and tool [31-33]. Environmental Kuznets Curves (EKC) are commonly used to characterize the nonlinear relationship between ecological environment changes and socioeconomic development [34]. However, the patterns of EKC differ depending on technological conditions, policy differences, and income distribution, which makes it challenging to establish them smoothly. Multi-objective planning models can effectively address the contradictions between environmental and economic objectives, but their practicality is controversial as it can be challenging to achieve the optimality of each objective during the optimization process [35]. Furthermore, computable general equilibrium (CGE) models are frequently used to assess the influence of regional population, economy, and technology on the environment, but their assumptions are more rigorous, making them complex and difficult to grasp [36]. Other models used to describe the interaction between eco-environment and socioeconomic include system dynamics (SD) models (Guan et al., 2011), fuzzy comprehensive assessment models, gray correlation analysis [37], and input-output models [38].
However, coupling coordination models appear to be more suited for assessing the nonlinear interactions between EE and SE. Song et al. [39], for example, investigated the combined coordination of low-carbon development and urbanization in China. Tang et al. [3] evaluated the spatiotemporal evolution and linked coordination of the Beijing-Hangzhou Grand Canal’s urbanization and eco-environmental quality. Chen et al. [40] employed coupled coordination and correlation models to study the coupling and coordination of each subsystem while dynamically assessing the creation of ecological civilization in China. Hou et al. [41] investigated the coupled coordination connection and spatiotemporal disparities between urbanization and food production in China. Additionally, Zhang et al. [42] analyzed the coordinated development and driving factors of green finance and environmental performance in China. Zameer et al. [43] performed a dynamic assessment of the coordinated development of natural resources, financial development, and eco-efficiency in China, while Li et al. [27] analyzed the spatial variation and explored the drivers of the coupled socio-economic and eco-environmental coordination in northern China. Therefore, it is evident that coupled coordination analysis has become a powerful tool for analyzing nonlinear relationships among subsystems.
In summary, most studies have utilized mathematical modeling methods to explore the nonlinear mechanisms of action and coupled coordination relationships among different systems. However, due to the complexity and dynamics of both EE and SE, there are still some research gaps that require further investigation. Firstly, the entropy value method, standard deviation method, and critic weight method [44, 45] were predominantly used in the past to calculate the indicator weights (performance) of each subsystem, but these methods may not effectively handle the indicator weights of long-term panel data. Secondly, the traditional coupling coordination degree considers the same contribution of each system when calculating the coordination of multiple systems, which may not provide an accurate and objective expression of the coordination degree and can also mislead decision-makers. Finally, the coupling relationship between EE and SE is of major significance in the context of global climate change, and existing information is insufficient. The goal of this study is to fill these gaps by presenting a paradigm for more precisely and fully assessing coupling coordination between EE and SE.
This study aims to make the following contributions:
(1) Development of an innovative evaluation index system to assess the coupling effect of EE and SE, which is aligned with the research theme. (2) Overcoming the limitation of previous studies that relied on static assessment of indicator weights for panel data, by adopting the dynamic deviation maximum method to measure the performance of each subsystem.
(3) Addressing the knowledge gap regarding the coupling effect between EE and SE, by proposing an improved coupling coordination degree model that provides a more accurate and comprehensive assessment.
This study utilized the Yangtze River Economic Belt (YREB) in China as an empirical case to validate the applicability and validity of the proposed model. The YREB spans across central, eastern, and western China, and its disparate growth can be attributed to variances in terrain, energy distribution, resource endowments, and economic development. A dynamic assessment of the coupling between EE and SE in the YREB can facilitate the advancement of the economic growth model, characterized by high efficiency, low energy consumption, and low emissions, thereby enabling the region to achieve low-carbon sustainable development. Consequently, an evaluation index system, based on statistical data gathered from 2010 to 2020, was established to measure the comprehensive development index of the EE and SE subsystems in the YREB. Subsequently, the degree of coupling and coordination between the EE and SE subsystems of each province in the YREB was dynamically evaluated.
Materials and Methods
Study Area
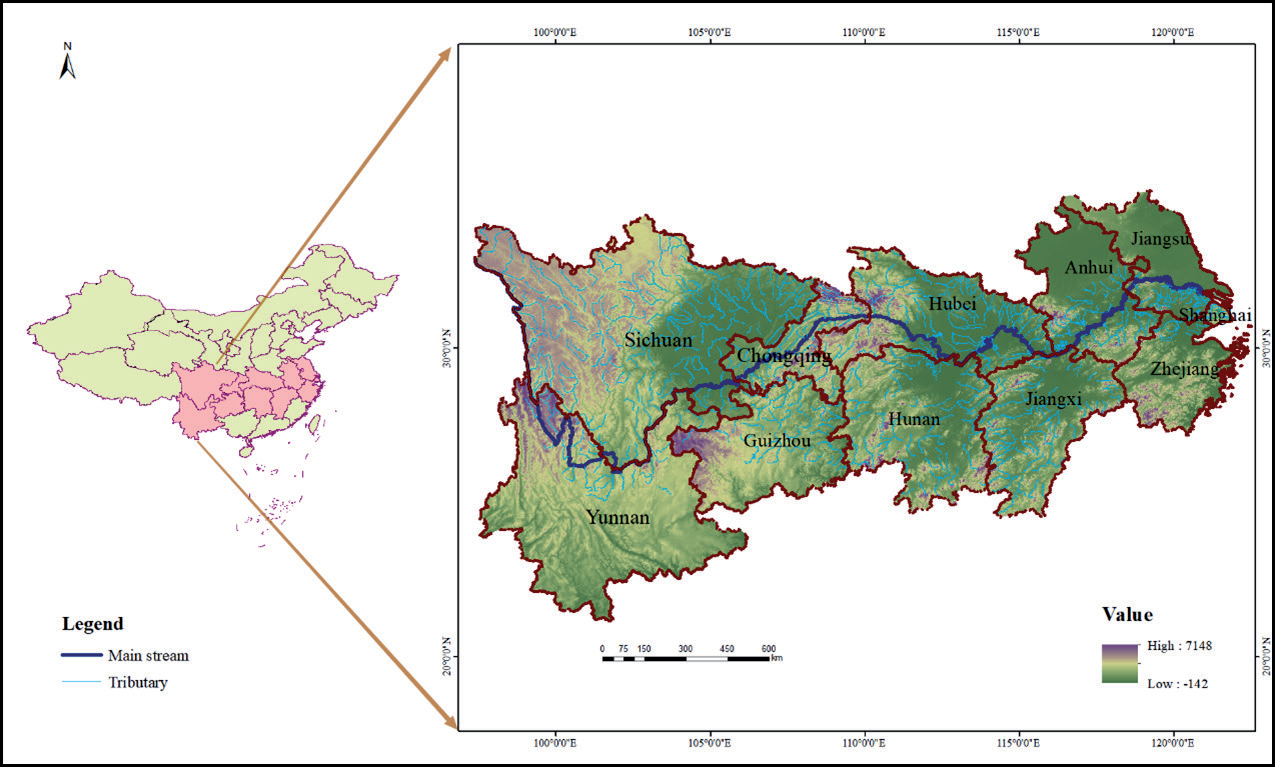
The YREB has developed into an important geographic entity that plays a crucial role in the country’s active participation in global competition and the division of labor since China embraced its revamped and opening-up policies. It has grown to be one of China’s most extensive and strategically important regions, as well as a major global economic powerhouse for the country’s interior. This region spans across 11 provinces (Fig. 1), including Shanghai (SH), Jiangsu (JS), Zhejiang (ZJ), Anhui (AH), Jiangxi (JX), Hubei (HB), Hunan (HN), Chongqing (CQ), Sichuan (SC), Yunnan (YN), and Guizhou (GZ). It covers an area of about 2.05 million km2 and spans three regions in eastern, central and western China, with high topography in the west and low topography in the east, complex geomorphology and geology, abundant energy resources, high resource endowment, and over 40% of the country’s population and GDP. As such, it has unique advantages and significant development potential.
Over the past decade, the provinces within the YREB have made significant strides in modernizing their industrial sector, leading to rapid socio-economic development and a high demand for energy resources. However, challenges such as energy security, environmental protection, and ecological conservation have emerged as major bottlenecks limiting further development of the region’s SE. As the YREB enters a critical phase in its energy transition, the need for coordinated development of both EE and SE becomes increasingly vital. Going forward, the area must continue to improve energy and environmental efficiency while transitioning towards a green, low-carbon economy. Given the pressing nature of this phase, policymakers must have a comprehensive understanding of the coupling and coordination between EE and SE in the YREB, which will guide the development of effective and appropriate policy recommendations.
Data Resources
Based on the original intention and mission of this study and the principle of data accessibility, the necessary data for measuring the coordinated coupling between EE and SE was obtained from various sources, including the China Industrial Statistical Yearbook, China Energy Statistical Yearbook, China Environmental Statistical Yearbook, and Statistical Yearbooks of 11 provinces in the Yangtze River Economic Belt from 2010 to 2020. This data includes information on the current state of energy utilization, environmental pollution control, economic development scale, and social contributions. During the data processing stage, some data was missing or exhibited abnormal performance. To address this issue, this study utilized intra-group means and the Lagrange interpolation method for data correction, resulting in the formation of sample data for analysis.
Methodology
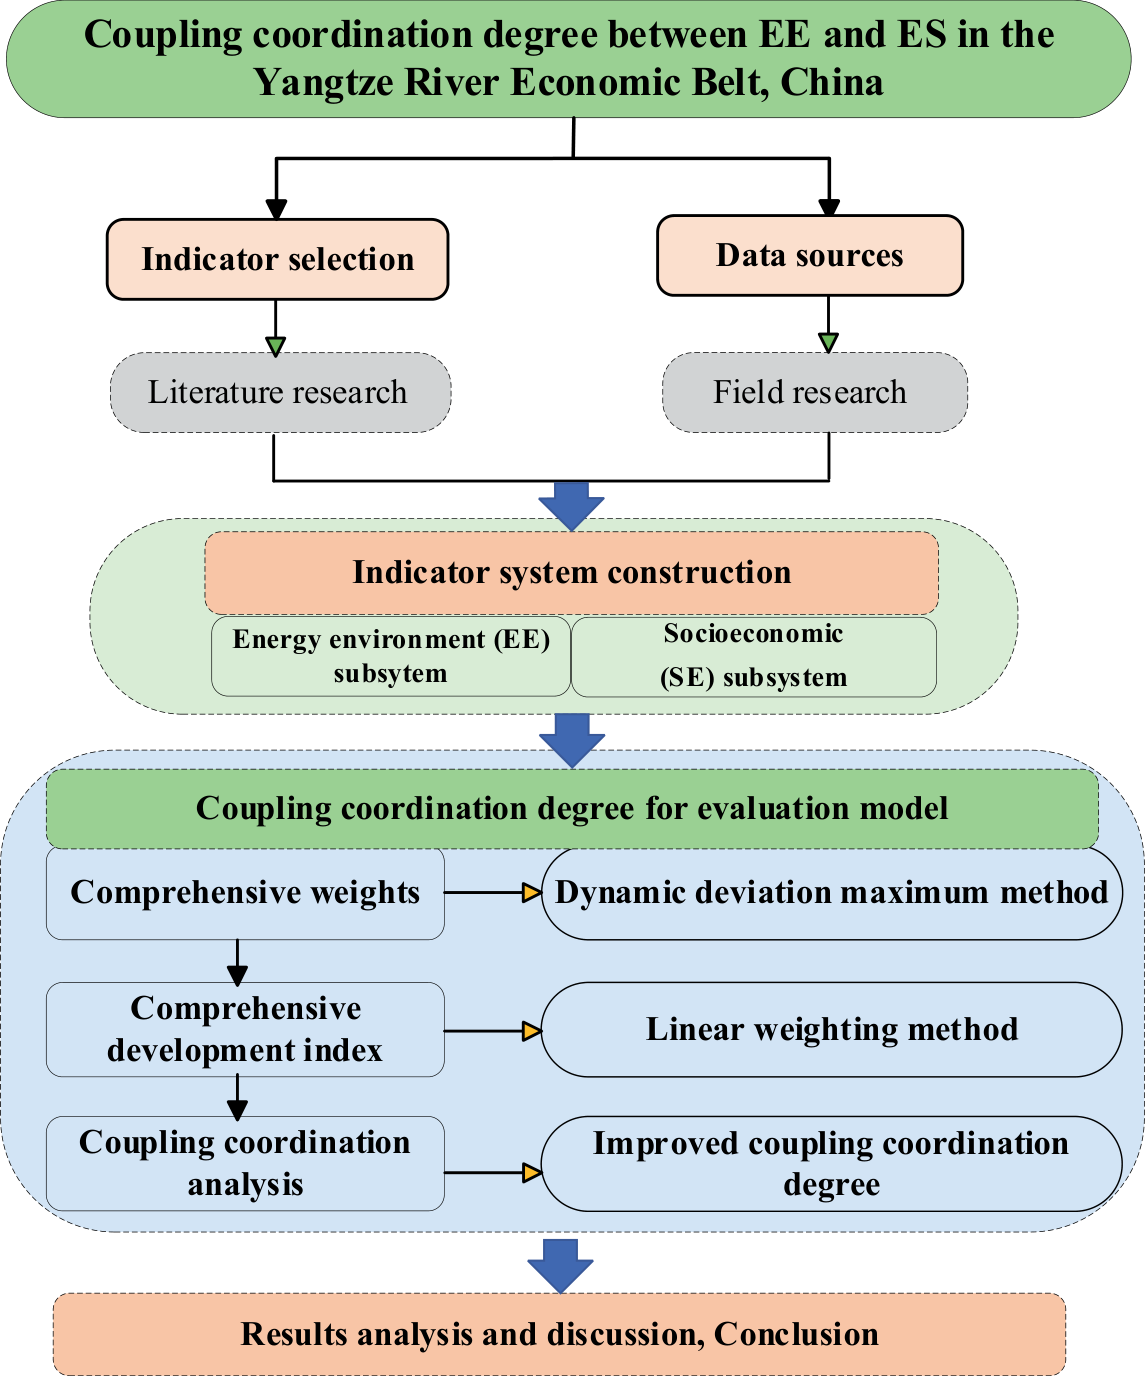
This study aims to investigate the coupled coordination of EE and SE. Therefore, we employed various research tools in designing the research methods and technical routes (Fig. 2). The specific steps included:
(1) Building a coupled coordination assessment index system through literature review and research objectives; (2) Solving the weights of each index using the dynamic deviation maximum method to ensure the accuracy and objectivity of the evaluation index;
(3) Calculating the comprehensive development index of EE and SE based on the linear weighting method;
(4) Proposing an improved coupled coordination degree analysis method and conducting an in-depth study and analysis of the coupled coordination between SE and EE for each province in YREB; (5) Discussing and analyzing in detail the spatial-temporal differences in the coupling coordination between EE subsystem and SE subsystem in the YREB, revealing the problems and challenges in the region concerning EE and SE, and providing an important reference for a comprehensive understanding of the coupling coordination between EE and SE in the YREB.
Indicator System Construction
To properly evaluate the coupled coordination between EE subsystem and SE subsystem, it is essential to establish a comprehensive evaluation system, as shown in Table 1. The design of this system should consider the principles of systematization, comprehensiveness, scientific rigor, and operability, while also referring to relevant studies by scholars such as Jochen et al. [46], Shen et al. [47], Xing et al. [48], Daniel et al. [49], Zheng et al. [50], and Yin et al. [51]. By establishing a conceptual and cognitive framework for the connotation of coupling and coordination between EE and SE, we can better recognize the mutual promotion role between EE and SE, providing a scientific basis for formulating corresponding policies and measures.
To design the indicators for the EE subsystem, it is necessary to first investigate the current status of energy usage, which is a critical driver for the development of green and low-carbon energy cycles [38, 41]. Environmental indicators should focus on the overall ecological situation, including metrics such as wastewater emissions, industrial sulfur dioxide emissions, and particulate matter emissions intensity [52]. The green cover and forest cover of the urban area can serve as visual representations of the effectiveness of EE management efforts [28].
To construct the SE subsystem’s indicator system, it is necessary to consider various factors that reflect the status and potential of regional economic development. Economic scale and development level are among the essential macro indicators, with GDP per capita and regional GDP being key measures. The fixed asset intensity of the energy industry is predominantly employed to depict the competitiveness and technological sophistication of the energy sector. The social service capacity of the social environment system can be assessed through indicators such as the number of employees in the electricity and heat industries, which effectively reflect the development of these industries. The number of higher education institutions can also serve as an indicator of regional educational resources, indicating the potential availability of high-end talent for energy, environment, and green development.
Evaluation Method
Dynamic Deviation Maximum Method
The dynamic outlier maximum method is an effective technique for evaluating indicator weights and can be widely used in non-quantitative data processing. It can objectively assess each indicator dynamically and thus more accurately reflect the changes and development of the evaluation object [15,53]. The dynamic deviation maximum method is often employed in the evaluation of urban sustainability development, system reliability, and socio-economic system assessment. It performs particularly well in terms of measuring the degree of harmony among multiple systems. One of the advantages of this method is that it enables decision makers to have a more comprehensive understanding of the comprehensive performance of the evaluated objects, providing a scientific basis and support for decision-making. The method consists of five steps, as follows:
Table 1.
Evaluation Index System for the Coupled and Coordinated Development of EE and SE.
Step 1: The original evaluation data is standardized by processing the variable uijtk to eliminate the influence of magnitude, using the following formula:
Here, vijtk stands for standardized data, while max{vijtk} denote the maximum values of uijtk, min{vijtk} denote the minimum values of of uijtk, respectively.
Step 2: Now calculate the coefficient of variation δi (1≤i≤n) for each indicator, according to the formula in statistics, the expression is below:
Here, v̅ i represents the average value of vijtk, and m – 1 represents the degrees of freedom.
Step 3: To calculate the corresponding weights for the coefficients of variation, it is necessary to standardize the coefficients of variation for each indicator. This can be achieved by scaling the value of the coefficient of variation to be in the range between 0 and 1. The specific formula for standardization is below:
Step 4: For panel data spanning a long period of time, the weight vector (w1, w2, ..., wm)T is referred to as the uncertainty weights. The weighted sum model is a widely used method for data analysis, which normalizes indicator values and calculates their respective weights. The specific formula for the model is below:
Here, Hitk represents the evaluated value of the evaluation object i during the assessment period tk.
Step 5: The dynamic outlier maximum method is utilized to assign weights to the indicators in order to maximize the overall variance of the decision scheme at each stage. A nonlinear objective programming model is then established to solve for the specific weights using the following Equation:
Here, H̅ represents the average of the evaluation values of all programs being assessed.
Step 6: The weights for each index are ultimately calculated using Equation (9), and the specific results are presented in Table 1.
Comprehensive Evaluation Index Model
Comprehensive evaluation index is an effective method for evaluating the level of development and changes in a single system. By combining multiple indicators for comprehensive evaluation, a more comprehensive understanding of the development status and change trend of the system can be obtained [45, 54]. In this study, we selected different indicators and calculated their weights using the dynamic deviation maximum method based on the different characteristics and importance of the EE subsystem and the SE subsystem. This makes the comprehensive evaluation index more accurately reflect the actual situation of the system. The specific formula is below:
Here, ψi represents the evaluation index of a single indicator, wj' represents the weight of the single indicator, vijtk represents the standardized data of the indicator, g(EE) and g(SE) represent the comprehensive evaluation index of the EE subsystem and the SE subsystem, respectively.
Improved Coupling Coordination Model
Coupling refers to the interaction between two or more systems and their elements, wherein they mutually influence each other to achieve a synergistic effect [56]. Meanwhile, the degree of coupling is a quantitative measure used to characterize the extent of interaction and influence between a system and its constituent elements [51]. Through synergistic control and influence, elements within a system work together to contribute to the transformation of the system from disorder to order [2]. Therefore, the degree of coupling is an important factor that determines the characteristics and patterns of system changes and reflects the effectiveness of this synergy. In this study, we improved the conventional coupling coordination by integrating the physics-based capacity coupling model, which builds on the research of Chen et al. [4]. To calculate the degree of coupling, we employ the subsequent formula:
In Equation (16), [] represents the rounding function and | | represents the absolute value function. The indicator D measures the degree of coupling coordination between the EE and SE subsystems, and its value ranges between 0 and 1. A higher value of D indicates better coordination, and vice versa. The parameter T reflects the integrated development level of the EE and SE subsystems. The coupling degree between the EE and SE subsystems is denoted by C, while the adjustment coefficient k is used to characterize the degree of balance and overall development between these two systems. In general, we consider the EE and SE subsystems to be equally important, and thus set ω1 = ω2 = 1/2.
Table 2.
Coupling coordination degree classification.
In this study, we aimed to improve the calculation method of coupling coordination by objectively adjusting the key parameter “k” in Equation (14). Previous studies (Zhang et al., 2021) generally set the value of k between 2 and 5, but such values may result in significant deviations between the model calculation results and the actual situation, particularly when considering the coordinated development of each system. Therefore, we revised the value of “k” based on the theoretical basis of coupling coordination degree and the actual situation of energy economy development in each province and region of the YREB. To achieve this, we introduced (g(EE) + g(SE))/2 and |g(EE) – g(SE)|, where (g(EE) + g(SE))/2 represents the average variation of EE and SE, |g(EE) – g(SE)| represents the difference between the levels of the two systems, and the difference between them, (g(EE) + g(SE))/2 – |g(EE) – g(SE)|, represents the coordination level of EE and SE. The larger the value of k, the higher the coordination. Furthermore, we quantified the magnitude of g(EE) and g(SE) to reflect CCD between the two systems and the level of system integration, making the calculation results of the model more objective and credible. After our correction, the k-value can more accurately represent the degree of coordinated development between the SE and energy systems.
To gain a more nuanced understanding of the spatiotemporal coupling and coordination between the EE subsystem and SE subsystem in each province of the YREB, this study drew inspiration from the works of Chen et al. [4] and Li et al. [14], and built upon the coupling coordination coefficient classification proposed by Xiao et al. [15] to establish the coupling coordination classification table in Table 2, using the partition points of 0.3, 0.4, 0.5, 0.6, 0.7, and 0.8.
Results and Discussion
Results Analysis of the EE Subsystem
The results of the comprehensive development index for the EE subsystem in each province of the YREB are presented in Table 3. Overall, the average comprehensive development level of the EE subsystem in the YREB demonstrated a steady increase from 0.557 in 2010 to 0.636 in 2020, indicating positive growth. However, the development pace has been sluggish and the improvements are not significant, even though the EE sector has been making progress in the region over the years. A qualitative change in the overall level has been observed since 2017, with the value rising from 0.577 to 0.605. This can be attributed to the release and implementation of the 13th Five-Year Plan for Energy Development and the Guidance on Energy Work in 2016 by the National Energy Administration, which clearly defined the goals and plans for EE development. This significantly enhanced the positive development efforts of all regions, resulting in a notable improvement in the corresponding development level.
Additionally, when looking at the ranking of the average integrated index value across all years, it is notable that only the years from 2015 to 2020 had integrated index values higher than the average value of 0.582. Specifically, the years with higher integrated index values were 2020 (0.636), 2019 (0.612), 2017 (0.605), 2018 (0.597), and 2015 (0.583). This trend can be attributed to the fact that in 2014, China introduced the strategic concept of promoting energy consumption, supply, technology and system revolutions. Subsequently, China has made significant strides in the areas of energy production, consumption, system reform, and technological innovation since 2015, as reflected by the fruitful results achieved during this period.
The YREB is divided into three regions - upstream, middle, and downstream. The downstream region comprises Shanghai, Jiangsu, Zhejiang, and Anhui, covering an area of approximately 350,300 km2, accounting for 17.1% of the total area of the YREB. The midstream region covers Jiangxi, Hubei, and Hunan, covering an area of approximately 564,600 km2, accounting for 27.5% of the YREB. The upstream region covers Chongqing, Sichuan, Guizhou, and Yunnan, covering an area of approximately 1,137,400 km2, accounting for 55.4% of YREB. Based on Table 3, the comprehensive development index of the EE subsystem from 2010 to 2020 varied across provinces in the YREB. Jiangsu (0.654) ranked first, followed by Zhejiang (0.645), Sichuan (0.637), Hubei (0.622), Shanghai (0.618), Jiangxi (0.617), Chongqing (0.574), Anhui (0.565), Hunan (0.553), Guizhou (0.484), and Yunnan (0.428). Six provinces exceeded the average comprehensive index of 0.582, while the remaining five provinces scored below the average. This indicates that, overall, the EE development in the middle and downstream reaches of the YREB is relatively advanced, with the eastern provinces outpacing the western provinces in terms of development level.
Table 3.
Comprehensive Development Index of EE subsystem in Provinces along the YREB.
Results Analysis of the SE Subsystem
The findings presented in Table 4 demonstrate a steady increase in the SE development level of the YREB from 2010 to 2020. Specifically, the average value of the integrated SE subsystem development index increased from 0.384 in 2010 to 0.544 in 2020, with an annual growth rate of 3.78%. When analyzing the average value of the integrated SE index (0.442) for each year across the 11 provinces, it exceeded the 2016 average value of 0.448 and was only lower than the average value from 2010 to 2015. This can be attributed to the official issuance of the Outline of YREB Development Plan in 2016.This plan aimed to accelerate the construction of comprehensive three-dimensional transportation corridors, foster innovation-driven industrial transformation and upgrading, and actively promote new urbanization, which significantly promoted the SE development of YREB.
Additionally, the comprehensive development index of the SE subsystem was only higher than 0.500 in two years from 2010 to 2020, which were the last two years of the decade, 2019 (0.505) and 2020 (0.544). The difference in the comprehensive index between these two years was the largest compared to other years, reaching as high as 0.039. This indicates that the SE development paths of the provinces in the YREB were minimally impacted by the COVID-19 epidemic that began in December 2019. Additionally, the YREB’s strategy of integrating disease prevention and control with economic growth has proven to be highly advantageous.
Table 4 presents the comprehensive development index of the SE subsystem for each province in the YREB over the past 11 years. The results show that Zhejiang has the highest score (0.593), followed by Jiangsu (0.552), Shanghai (0.463), Anhui (0.456), Hubei (0.446), Sichuan (0.412), Hunan (0.405), Yunnan (0.395), Jiangxi (0.394), and Chongqing (0.393). Only five provinces, including Zhejiang, Jiangsu, Shanghai, Anhui, and Hubei, have a comprehensive development index of the SE subsystem that is above the average value of 0.442. Furthermore, the index values of the other six provinces are below the average value, indicating significant differences in the SE development level among provinces. The results demonstrate that the middle and lower reaches of YREB have a much higher level of SE development than the middle and upper reaches, with a downstream>midstream > upstream trend in economic development. The strategic importance of the Zhejiang-Shanghai-Jiangsu region in China’s overall modernization and all-round opening-up plan may have contributed to its higher level of SE development. This region is known as one of the most dynamic, open, and innovative areas in terms of China’s economic development.
Table 4.
The comprehensive SE development index of each province along the YREB.
Coupling Coordination Analysis by Improved CCD Model
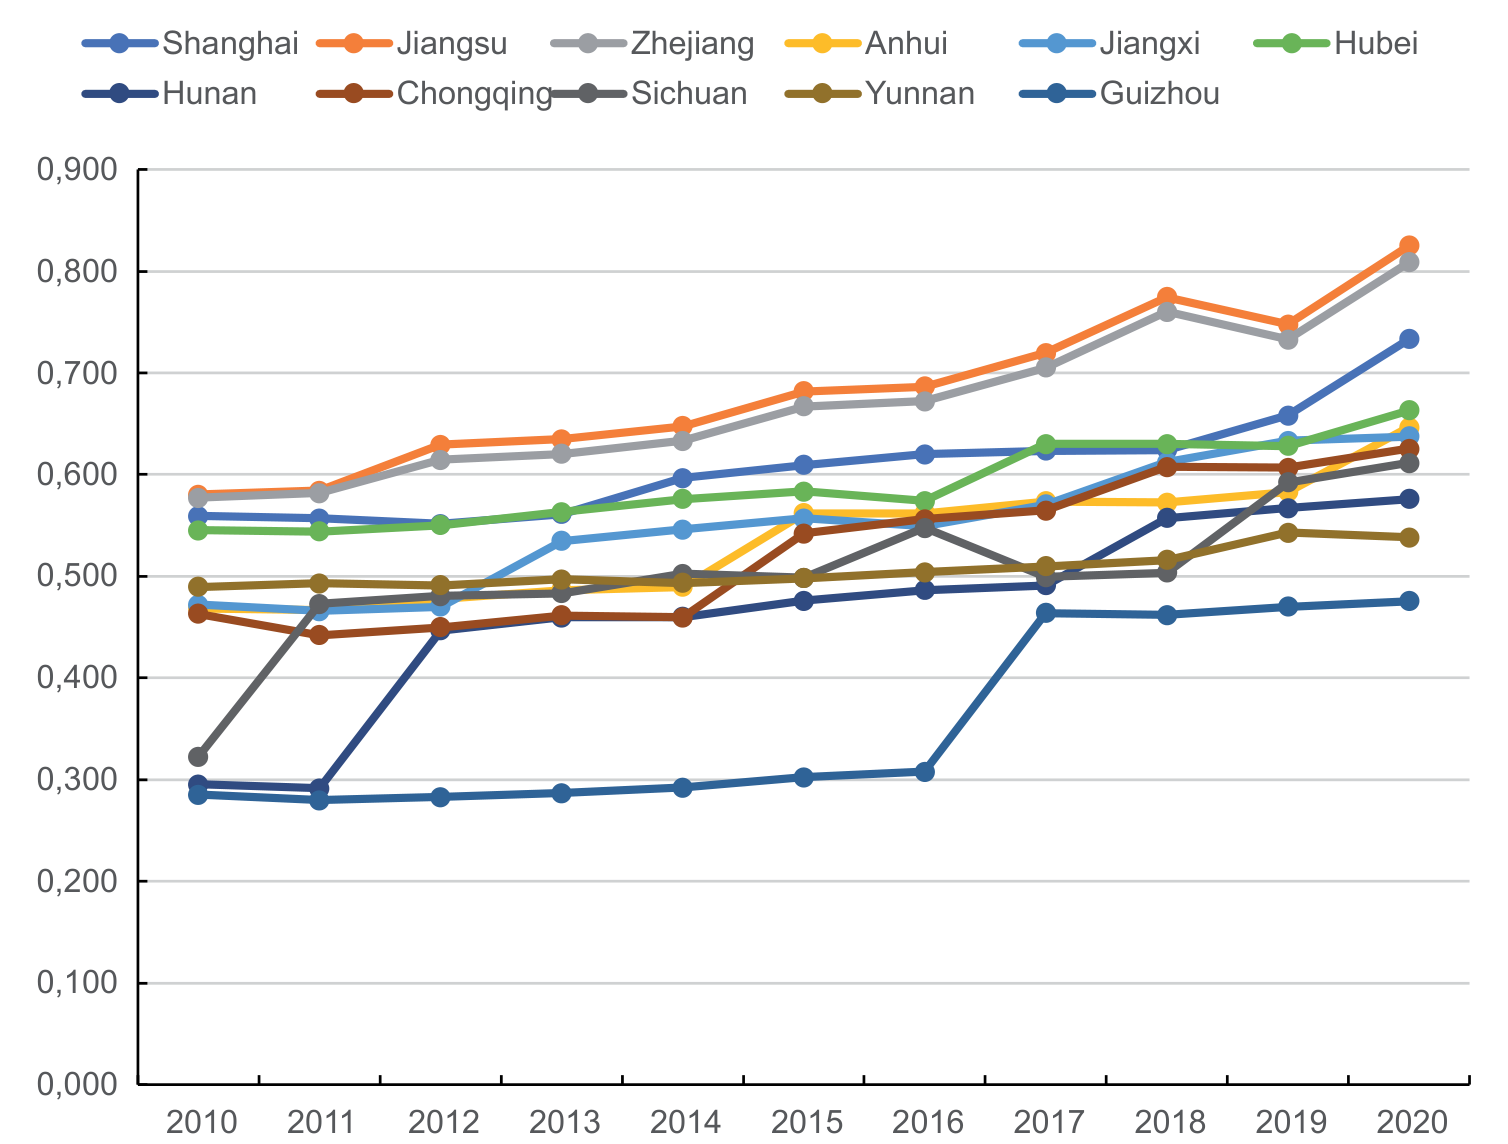
Using the improved model for measuring CCD (Equations 13-16), we calculated the CCD scores of each province in the YREB from 2010 to 2020, as presented in Table 5. Overall, the mean CCD score increased from 0.460 in 2010 to 0.649 in 2020, suggesting a steady upward trend (Fig. 3). The CCD between the EE and SE subsystems has improved from slightly dysfunctional to basic and intermediate coordination, indicating that the YREB’s overall CCD has a stronger foundation and has made significant progress.
According to the specific values of each year obtained using the improved CCD model (Equations 13-16), all years show an increase in the coupling coordination degree compared to the previous year. The largest increase occurred in 2020 (0.649) compared to 2019 (0.615), with an increase of 0.034. Additionally, a qualitative leap was achieved in 2013 (0.508), with the CCD between the EE subsystem and SE subsystem in the provinces of YREB reaching a state of basic coordination. This may be attributed to the fact that prior to 2013, China vigorously pursued urbanization and industrialization, which exacerbated environmental protection and energy consumption problems. Firstly, urban expansion led to vegetation destruction and soil erosion. Secondly, inefficient energy resource exploitation and serious waste led to ecological degradation [56]. Thirdly, the imbalance between population and energy consumption due to regional productivity and fourthly, the interregional transfer of energy development costs resulted in a large amount of funds being allocated to economic construction, neglecting the importance of energy transition and ecological environmental protection. In contrast, after 2013, China proposed a new type of human-centered urbanization development, which emphasizes sustainable urban development and ecological environment protection [57].
In terms of the CCD between EE and SE in each province of YREB, the provinces with the highest and lowest values are Jiangsu (0.683)>Zhejiang (0.670) >Shanghai (0.609)>Hubei (0.590)>Jiangxi (0.550) >Anhui (0.535)>Chongqing (0.525)>Yunnan (0.507) > Sichuan (0.501)>Hunan (0.464)>Guizhou (0.355). The difference between the highest and lowest values is as high as 0.328, indicating that the regional variability in the coordinated development of EE and SE among the provinces in YREB is large, and the level of coordinated development is uneven. Furthermore, only Jiangsu, Zhejiang, Shanghai, Hubei, and Jiangxi have CCD values higher than the average value of 0.545. The remaining six provinces have values lower than the average value, and the CCD is not high.
Drawing on the CCD values of each province year after year, it is evident that Jiangsu, Zhejiang, and Shanghai have consistently led the way, whereas Guizhou has been mired in the worst state of coordination, never even reaching a basic level of coordination and remaining in a state of slight dissonance. This is particularly true for the years between 2010 and 2014, during which Guizhou was in a continuous state of severe disorder, a phenomenon not witnessed in other provinces. By comparison, Jiangsu and Zhejiang, which boast the highest levels of coordination, with CCD values of 0.825 and 0.809, respectively, in 2020, have achieved a state of excellent coordination. This suggests that the provinces located in the eastern coastal region have a markedly higher level of CCD of EE and SE than the provinces located in central and western China. This is primarily attributed to the eastern coastal region’s superior location, strong material foundation, and outstanding “first-mover” advantage, which enabled them to quickly attain a state of high-quality coordination.
Table 5.
The CCD of the provinces of the YREB.
Discussion
The above-discussed results examine the CCD and comprehensive development level between the EE and SE subsystems in each YREB province. Different regional aggregation and divergence features are detected for the EE, SE, and their coordination relationship in each province of YREB. The CCD of YREB often exhibits a downstream>midstream >upstream geographical pattern (Fig. 4). The provinces along YREB have progressively started down the path of excellent coordinated development with the national strategic determination of “grasping large protection and not engaging in large development” for YREB and the long-term objective of continuously improving the development quality and efficiency of YREB.
Fig. 3.
The dynamic trends of CCD between the EE subsystems and the SE subsystems in the provinces of the YREB.
In light of the emerging challenges faced by the provinces within the YREB, our research aims to scrutinize the spatiotemporal evolution and geographical aggregation mechanism of the interaction between the EE subsystem and the SE subsystem. Utilizing ArcGIS spatial analysis, we identify the geographical grading of EE and SE CCD in YREB, referencing Table 2 for CCD grading. The spatial difference maps in Fig. 4 depict an overall upward trend in the coupling coordination status of all 11 provinces from 2010 to 2020, albeit with a relatively sluggish growth rate and some spatial agglomeration.
Fig. 4.
The spatial and temporal evolution of CCD among provinces in YREB in China in 2010, 2014, 2017 and 2020.
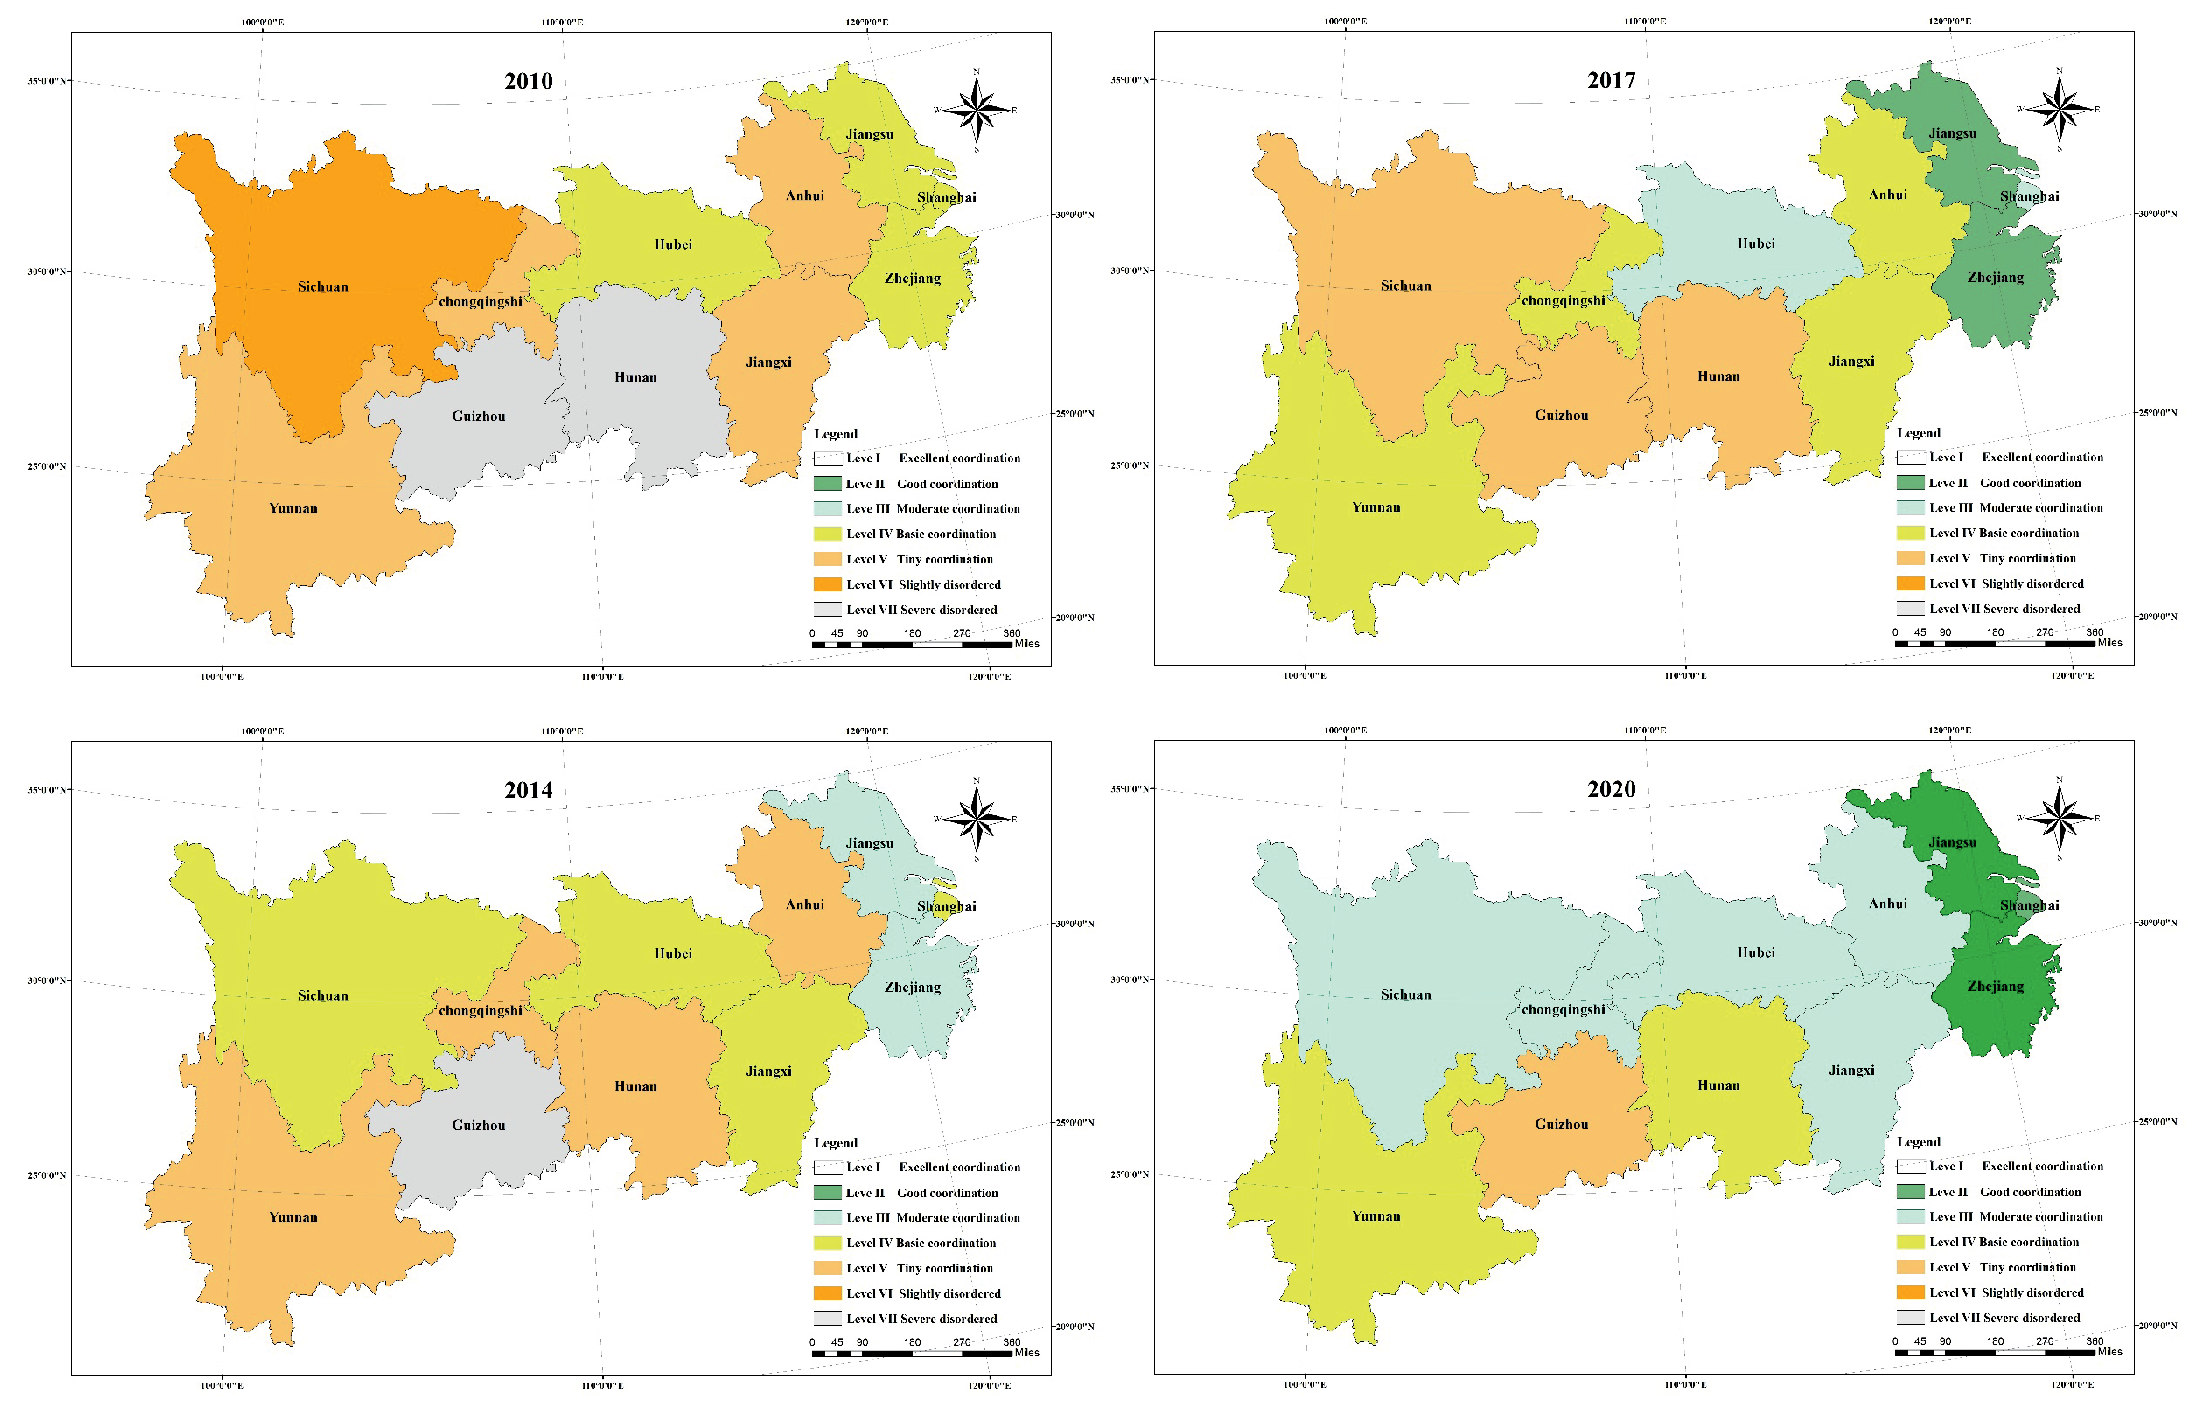
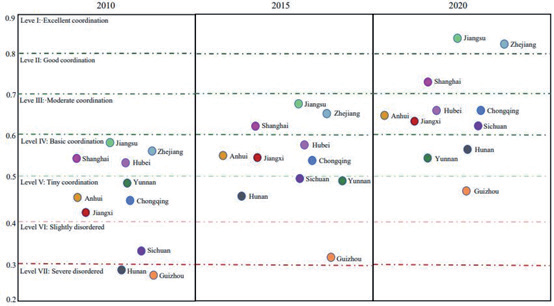
Examining Fig. 4, a noteworthy trend emerges: the degree of coupling coordination is closely tied to geographical location, exhibiting an increasing trend from west to east. High CCD regions include Jiangsu, Zhejiang, and Shanghai in the east, while the central region, encompassing Anhui, Jiangxi, Hubei, Chongqing, and Sichuan, exhibits a medium CCD. Conversely, low CCD regions are mainly concentrated in Yunnan and Guizhou, among others, with the western region standing out as a strategic hub for clean energy resources. Despite more than a decade of development, the central and western regions of Hunan, Guizhou, and Yunnan continue to display a low coupling coordination state, indicating considerable potential for upward mobility.
Fig. 5 depicts the dynamic changes in coupling coordination among YREB provinces. Provinces in the east, such as Jiangsu, Zhejiang, and Shanghai, experienced a significant leap in coordination within 5 years, attributed to their advantageous location, high economic development, and robust policy support. Conversely, the central and western regions, like Hunan, Guizhou, and Yunnan, lag behind, emphasizing the need for regional coordination and cooperation to bridge development gaps. Geographical location, economic development, and policy support emerge as critical factors affecting the CCD of the EE and SE subsystems in YREB.
Addressing resource and economic disparities is a shared challenge globally, and China is no exception. Factors influencing regional development include geographical location, resource endowment, industrial structure, market conditions, and policy support. Eastern regions benefit from geographical advantages and favorable policies, while the central region grapples with industrial transfers and associated pollution, and the western region faces challenges transitioning industries. This study underscores the significance of coordinated development for sustainable progress in YREB.
These findings emphasize that regional conditions, ecological endowments, policy formulation, technology, economic and energy structures all play pivotal roles in coordinated development. Despite regional differences, the overall development trend in YREB is positive. To achieve sustainable development, active efforts are required to transform the energy structure, promote low-carbon development, optimize economic and industrial layouts, and enhance the efficient use of energy and resources.
Conclusions
Conclusions and Recommendations
As the central hub of China’s economic development, YREB faces challenges related to imbalanced regional development, environmental degradation, and energy inefficiency. Thus, evaluating the coupled coordination between EE and SE in YREB is critical for promoting economic growth, protecting the environment, and optimizing energy utilization. To this end, a comprehensive index system was established, incorporating factors such as energy development status, pollution and governance, economic scale and development, and social impact. Subsequently, comprehensive development index and improved CCD models were developed to investigate the spatiotemporal evolution characteristics of the coupling coordination between EE and SE in the various provinces of YREB. The models developed offer policymakers valuable insights and a deeper understanding of the development status of YREB.
The results showed that: (1) From 2010 to 2020, the coordinated development of EE and SE in each province in YREB has gradually shifted from a dysfunctional state to a coordinated state, and exhibits a stable growth trend; (2) There are notable spatial disparities in the CCD values of each province, with a general trend of higher levels of coupled and coordinated development in the middle and lower reaches compared to the middle and upper reaches, and in the middle and eastern regions compared to the western regions; (3) The coupled and coordinated development of each province is relatively sluggish, and CCD is closely linked to the location factor, with similar regions displaying a spatial clustering phenomenon in a state of flux.
In conclusion, the realization of ecological protection and high-quality development of YREB is a long-term task that requires the cooperation and joint efforts of the whole society. In view of this, this paper gives the following suggestions: (1) While promoting economic development, priority must be given to the protection of the ecological environment and resources;
(2) For developed regions in the east, such as Shanghai, Zhejiang, and Jiangsu, there is a need to actively explore the optimization of the economic structure and industrial layout, whereas for less-developed regions in the central and western parts of the country, such as Sichuan, Yunnan, and Guizhou, there is a need to make great efforts to promote the green and low-carbon development, and to improve the efficiency of energy and resource utilization; (3) To realize synergistic development among regions, it is necessary to strengthen cooperation among city clusters and establish closer regional mutual assistance mechanisms within city clusters and in inter-provincial border areas.
Outlook
The proposed research framework not only provides a new analytical framework and ideas for studying the coupling effect of the interaction between EE and SE in YREB, a rapidly developing and regionally diverse region, but also has potential applications in other similar regions. However, there are still some issues that need further discussion. First, including cities in YREB in the overall framework analysis can provide a more in-depth exploration of regional difference factors. Second, studying the reciprocal feedback mechanism between energy structure transformation, environmental policies, and socioeconomic can provide a more accurate reference basis for policy formulation.

