

Introduction
Anthropogenic heat is the waste heat emitted directly into the atmosphere from people’s production and life [1], from industrial production, heating systems, residential cooking, transportation, and human metabolism. Anthropogenic heat flux refers to the total flux of anthropogenic heat emissions generated per unit time and area [2]. It plays an important role in measuring the impact of human activities on the urban thermal environment. Many studies have shown that anthropogenic heat has a significant impact on urban climate [3, 4]. Some studies have shown that anthropogenic heat flux can exacerbate air pollution [5], and even increase the frequency of extreme heat wave weather, increasing the heat-related health risks of urban residents [6]. It has also been noted that anthropogenic heat has a positive effect on raising urban temperatures and promoting vegetation growth in winter in some cold climate regions [7]. It also affects the formation and distribution of ozone [8, 9]. Therefore, quantitative research on anthropogenic heat flux is of great significance for understanding urban climate change, adjusting China’s urban energy consumption structure, and reducing the occurrence of extreme weather events in cities.
Currently, there are more studies on the estimation of anthropogenic heat emissions, and anthropogenic heat flux estimation methods can be divided into three categories: the energy consumption inventory method, the building model simulation method, and the surface energy balance equation method [10-13]. Currently, the energy inventory method is commonly used for the calculation of anthropogenic heat, which is divided into top-down and bottom-up [14-16]. Nighttime light remote sensing data can detect the light brightness information of the surface, which can be used to study population [17], GDP [18], economy [19], city size [20], carbon emission [21], energy [22], and pollutants [23, 24]. In this paper, an exploratory attempt is made to apply DMSP/OLS nighttime lighting data to the study of anthropogenic heat flux distribution in China. Many studies have shown that there is a significant correlation between nighttime lights and anthropogenic heat emissions. Some scholars have calculated anthropogenic heat flux data from nighttime lighting data in Beijing-Tianjin-Hebei [25], Hong Kong [26], and Xiamen [27]. Due to the fact that general linear models do not consider spatiotemporal non-stationary problems (the relationship between variables and results varies with time and space), their results cannot fully reflect the true characteristics of spatiotemporal data [28]. The Geographically and Temporally Weighted Regression (GTWR) model effectively solves this problem [29] and has been widely used by scholars, with good results [30-32]. This article also innovatively uses this method to study anthropogenic heat flux.
Due to the differences in the level of economic and social development between cities and the geographical environment they are located in, there are large differences in anthropogenic heat fluxes and their spatial distribution in different regions and cities of different sizes. Current studies still cannot accurately estimate the anthropogenic heat fluxes in different regions or describe the spatial and temporal variations of anthropogenic heat fluxes, and thus cannot fully reveal the spatial variability of anthropogenic heat emissions, hindering the integration of anthropogenic heat fluxes with other socioeconomic and natural elements, as well as comprehensive analysis. Therefore, fine and reasonable anthropogenic heat emission raster data are important for the numerical simulation study of urban climate and environment. In this study, the top-down energy inventory method is used to estimate the anthropogenic heat fluxes in each province of China from 2000 to 2020, and a new nighttime lighting dataset is constructed for each province by using remote sensing images. A spatialized model of anthropogenic heat fluxes is established based on the high correlation between nighttime lighting data and anthropogenic heat fluxes. This will provide important basic data support for urban climate and environmental research, which is of great significance.
Materials and Methods
Study Area
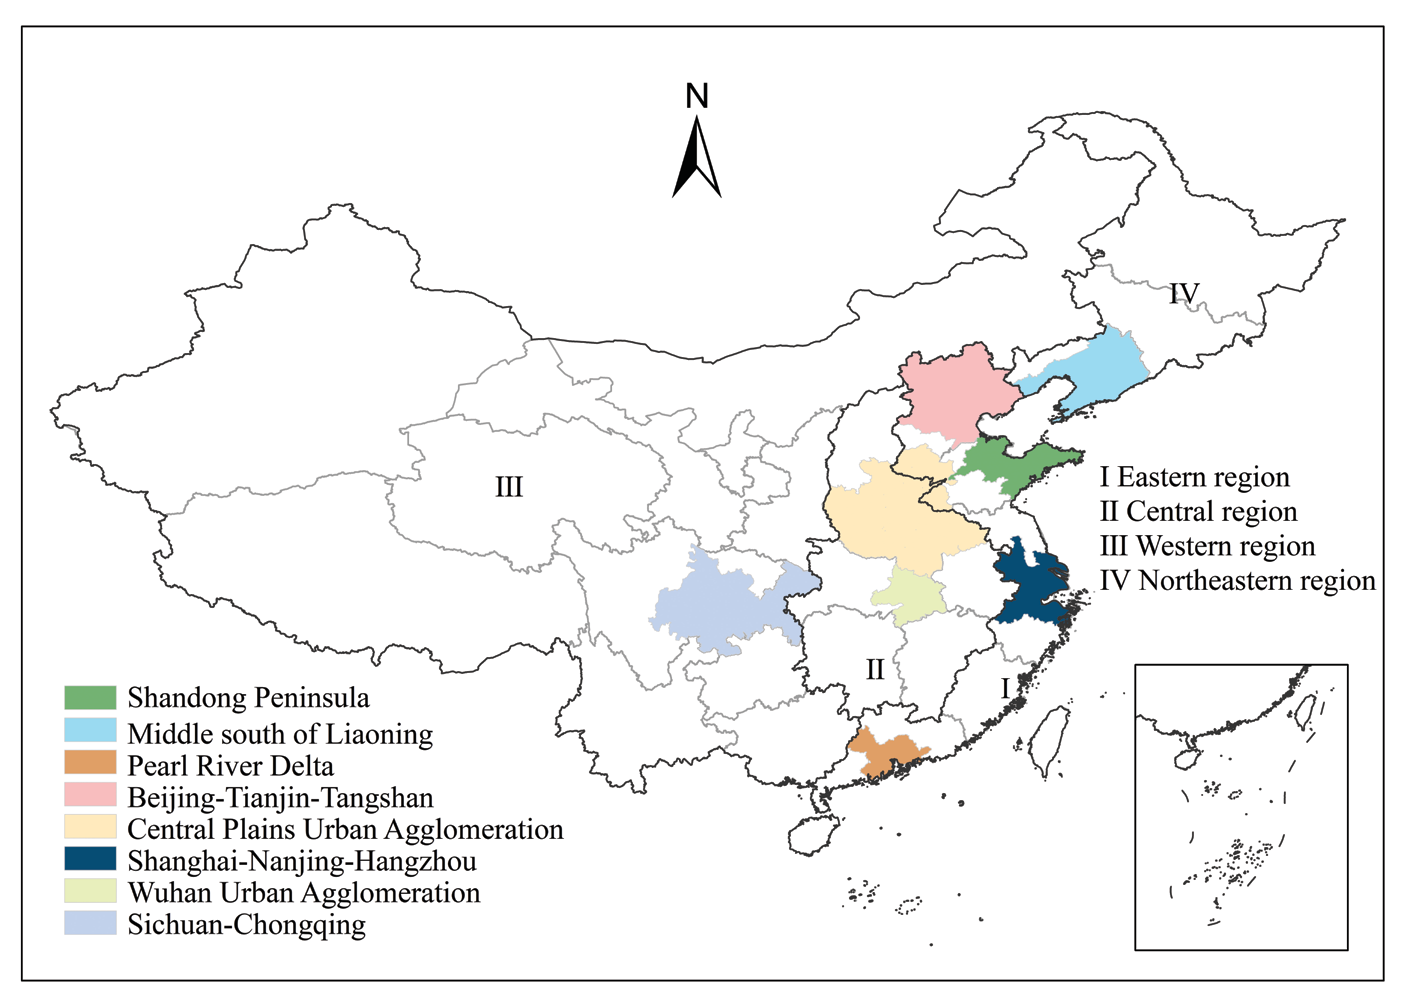
Considering the availability and continuity of data, the study period of this paper is 2000-2020, and the study area includes all regions of China excluding Tibet, Hong Kong, Macau, and Taiwan, with a total of 30 provinces.
Four regions, namely the Eastern Region, the Central Region, the Western Region, and the Northeast Region, were selected for this study according to their geographical divisions. and eight typical city clusters, namely Beijing-Tianjin-Tangshan, Shanghai-Nanjing-Hangzhou, Pearl River Delta, Middle south of Liaoning, Wuhan Metropolitan Area, Central Plains Urban Agglomeration, Shandong Peninsula, and Sichuan-Chongqing, were selected for this study according to their city cluster scales.
Data Sources
The energy consumption of each sector of heat flux was obtained from the website of the National Bureau of Statistics and the China Statistical Yearbook. (https:// data.stats.gov.cn/easyquery.htm?cn=C01).
Nighttime light remote sensing data have been widely used in research work such as urbanization process monitoring, but the incomparability of the two commonly used nighttime light remote sensing data (DMSP-OLS and NPP-VIIRS) limits the available time series length of nighttime light data. Chen et al. proposed an Auto-encoder (AE) based correction scheme for cross-sensor (DMSP-OLS and NPP-VIIRS) nighttime lighting data [33]. This new nighttime lighting data set solves the problem that the DMSP-OLS and NPP-VIIRS sets of nighttime lighting data cannot be used simultaneously, extends the length of time that the data are available, and provides a new source of data for related fields such as urban studies. (https://doi. org/10.7910/DVN/YGIVCD).
Research Methods
Firstly, anthropogenic heat flux data are calculated for each province, then a spatio-temporal geographically weighted regression model is used to construct a regression equation between provincial anthropogenic heat flux and nighttime lighting data, and finally the accuracy of the model is verified using the anthropogenic heat flux statistics of prefecture-level cities. The spatial and temporal variations of anthropogenic heat fluxes in China are analyzed based on the simulation results.
Calculation of Total Anthropogenic Heat Emissions
Based on the method of Xie et al. [34], assuming that all heat generated from human activities is emitted into the atmosphere in the form of sensible heat, the anthropogenic heat flux is divided into two parts: energy consumption and human metabolism:
In the formula: AHF is the total anthropogenic heat flux; AHFe is the anthropogenic heat flux released due to energy consumption; AHFm is the anthropogenic heat flux released due to human metabolism.
This study further subdivides the anthropogenic heat flux released by energy consumption into:
In the formula: AHFi, AHFt, AHFb are the anthropogenic heat emissions from industry, transportation, and construction, respectively. Among them, transportation includes transportation, storage, and postal industry, construction includes construction, wholesale, retail and accommodation, catering, and living, and industry includes agriculture, forestry, animal husbandry, fishery, water conservancy, electricity, gas and water production and supply, extractive industry, manufacturing, and other industries. Anthropogenic heat flux is the anthropogenic heat release per unit time and unit area.
The anthropogenic heat flux from the energy consumption of the above three sectors is calculated by the following formula (3):
In the formula: C is the calorific value of standard coal, taken as 292.7×10⁸KJ/kg; S is the area of the region; T is the corresponding time; Mk is the energy consumption of a sector in a region at a certain time, and the subscript k indicates different sectors (i for industry, b for building, t for transportation; the same below).
The anthropogenic heat emissions generated by human metabolism are:
In the formula: P1 and P2 denote the heat generated per unit time due to human metabolism in the active and sleep conditions, respectively; t1 and t2 are the active time and sleep time, respectively; and N is the total population of the region. According to related studies [35], the average power P1 of a person in the average condition is 175 W during activity, and the activity time t1 is about 16 h. The power P2 during sleep is 75 W, and the average sleep time t2 is 8 h.
Spatiotemporal Dynamic Evaluation of Anthropogenic Heat Flux
We calculated the anthropogenic heat flux in China from 2000 to 2020 and analyzed the spatial pattern of anthropogenic heat flux. The equation is described as follows:
Among them, Pi represents the anthropogenic heat flux of the year 2000 to 2020, and t represents the total number of years, set as 21. Describe the temporal variation of anthropogenic heat flux from 2000 to 2020 using Equation (6).
Pitem is the time variation of pixel i anthropogenic heat flux from 2000-2020.
Simulation Method
Due to the differences in economy, society, and natural environment of each city, spatial heterogeneity should be considered to identify the correlation between night light and artificial heat flux. Geographically weighted regression (GWR) models are most widely used in current spatial heterogeneity studies, but GWR uses cross-sectional data and is prone to anomalous data fluctuations and parameter excesses. The geographically and temporally weighted regression (GTWR) model introduces a temporal dimension, which can solve the above problems and make the estimation results more effective. This paper uses GTWR, an ArcGIS plug-in designed by HUANG et al. [29], to measure and simulate the results, and the results show that R2 is greater than 0.9 and the simulation results meet the requirements.
Accuracy validation is an essential step in model simulation. According to JI et al. [36], error correction was performed on the fitting equation obtained from GTWR simulation. Based on Arcgis10.8 software, using a grid calculator to substitute night light grid data into the fitting equation for the corresponding year, the estimated anthropogenic heat flux values for the years 2010 and 2019 nationwide can be obtained. By dividing the estimated iron stock by city, the simulated iron stock estimates for each city in 2010 and 2019 can be obtained.
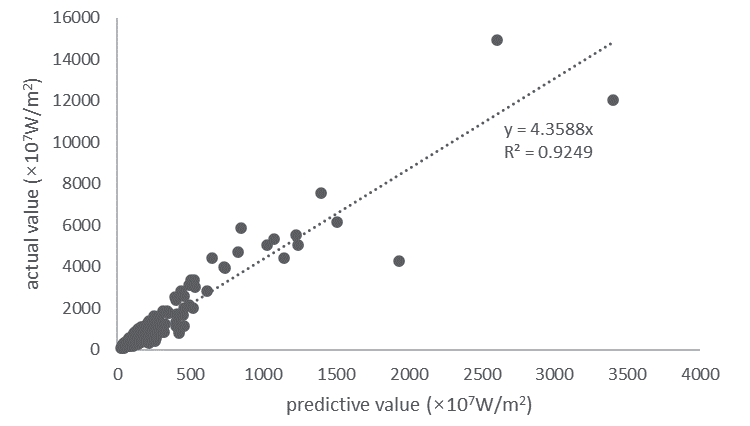
The goodness-of-fit R2 measures the correlation between the simulated and statistical values, and the simulated and statistical values are analyzed for correlation based on the simulated values obtained from the nighttime light data simulation, as shown in Fig. 2.
The data R2 of the 118 cities mentioned above reached 0.9249, and the simulation results all achieved good results, which proved that the national anthropogenic heat flux regression model constructed in this study has good mathematical and statistical results.
Results and Discussion
The spatial and temporal dynamics of anthropogenic heat fluxes in China from 2000 to 2020 are shown in Fig. 3. The anthropogenic heat flux data show obvious regional distribution characteristics. The eastern coastal region has the highest anthropogenic heat flux due to its high population density and high level of economic development. The central and northeastern regions lag behind the eastern coastal regions in terms of economic development and rank second in anthropogenic heat flux. The western region has a small population density and economic development far behind the eastern region, and its anthropogenic heat flux is also the lowest. As a whole, anthropogenic heat fluxes show a decreasing trend from the eastern region to the central and western regions. There are several obvious areas of high and low values of anthropogenic heat flux. The high value areas of anthropogenic heat flux are mainly located in the economically developed large cities such as Beijing, Tianjin, Hebei, Yangtze River Delta, Shanghai, Suzhou, Hangzhou, and Nanjing. The low value areas of anthropogenic heat flux are mainly located in the vast areas of southern Xinjiang-Tibet-western Qinghai and northeastern Xinjiang-northwestern Gansu-northern Inner Mongolia. Over the past 21 years, the spatial and temporal variations of anthropogenic heat fluxes in China have expanded significantly.
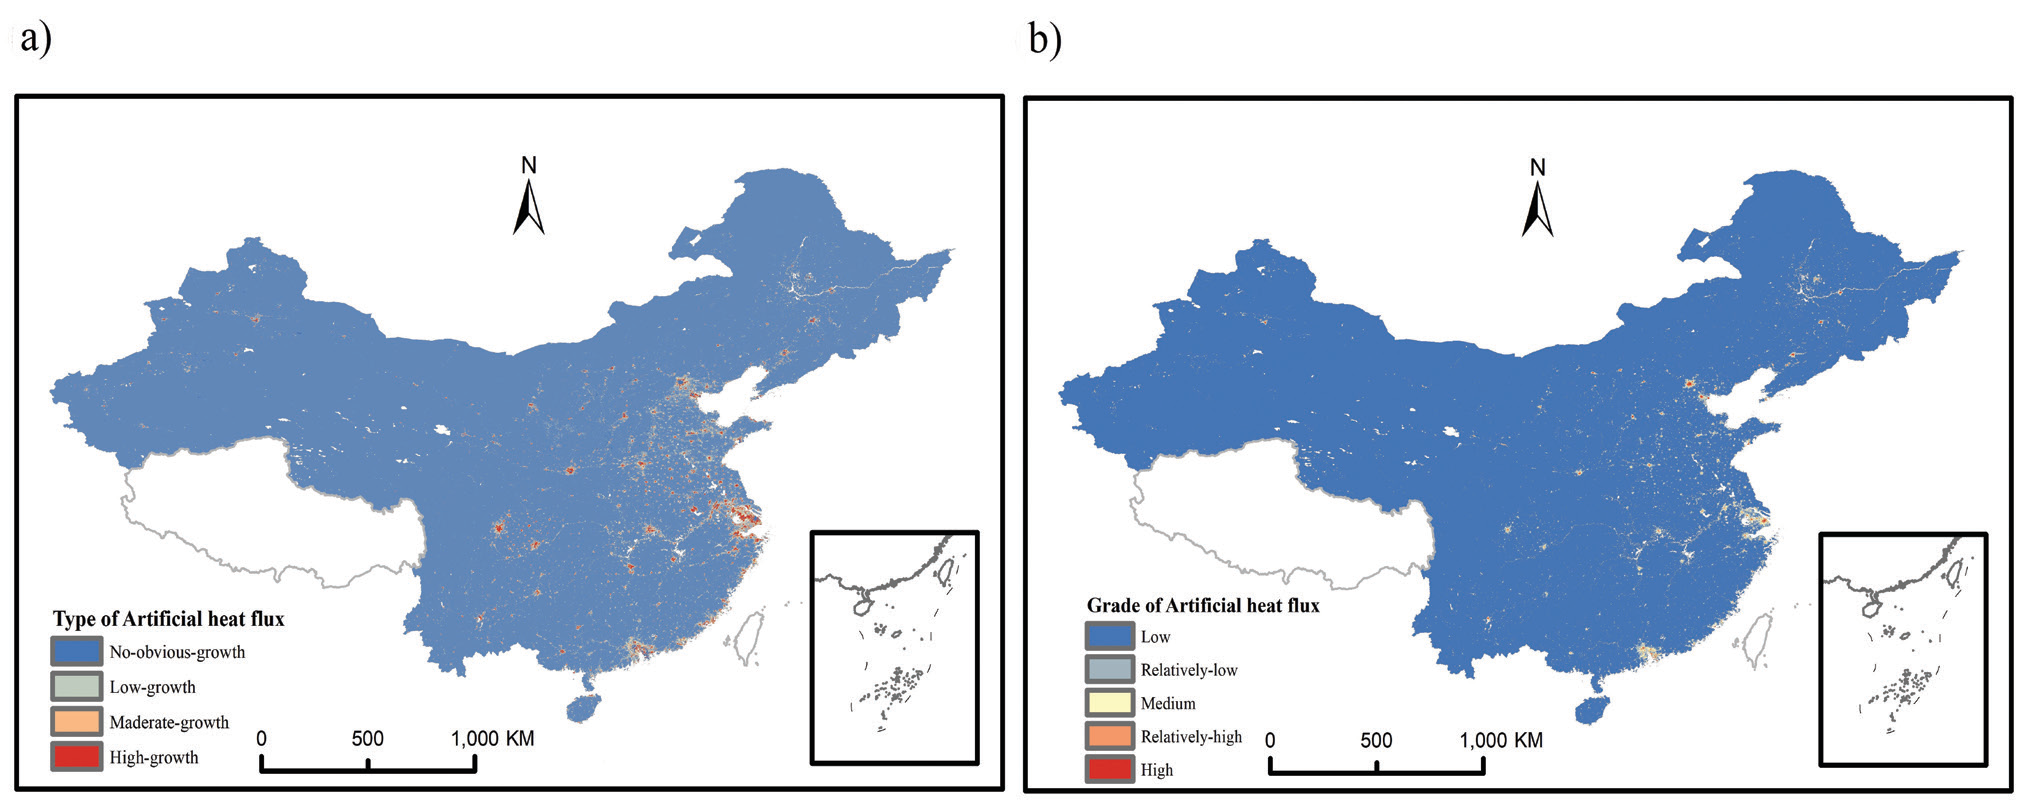
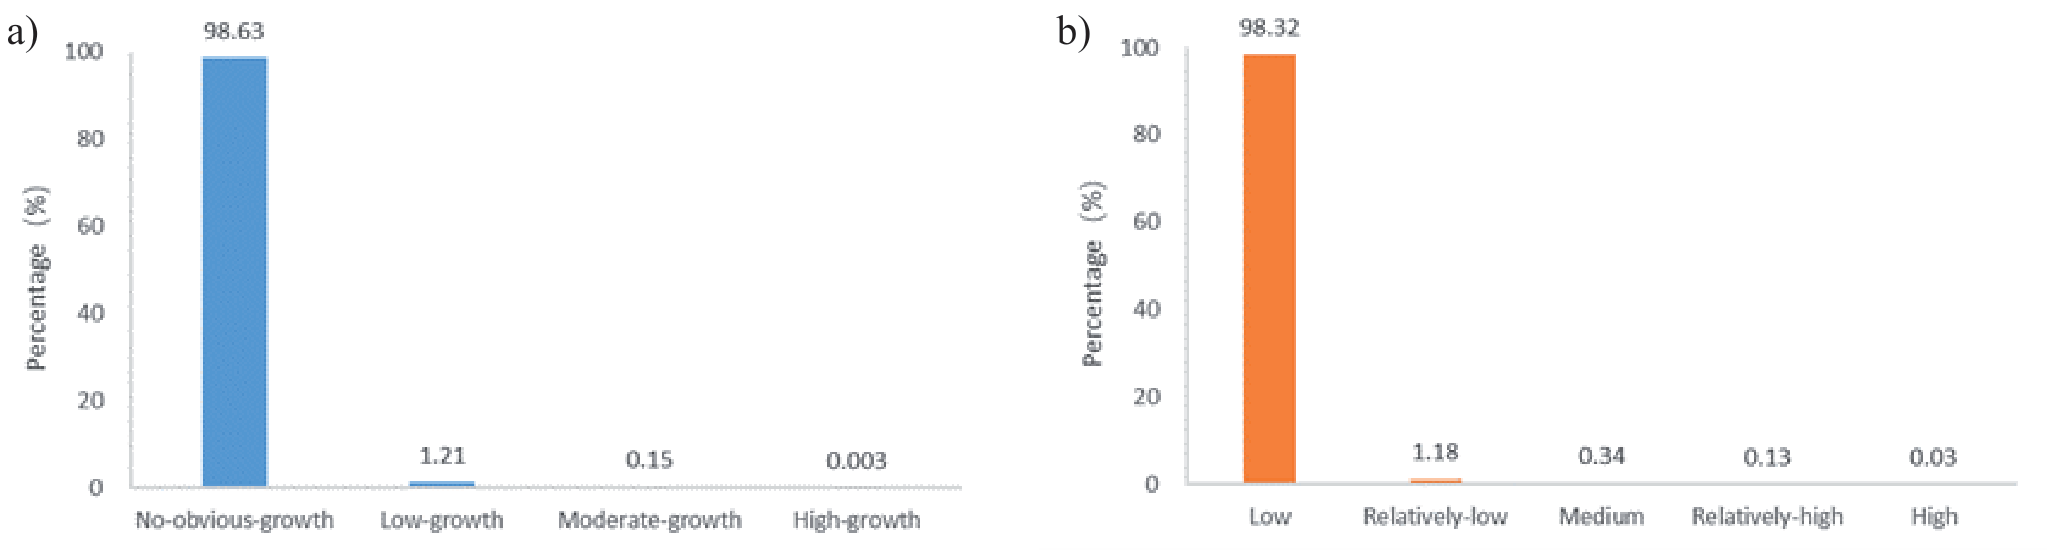
Compared with other statistical data classification methods, the natural breakpoint method has the smallest variance within categories and the largest difference between categories. The classification results were not influenced by human factors and there were obvious breaks between different categories. Therefore, this study chose the natural breakpoint method to study the variation of anthropogenic heat fluxes in different regions of China. The natural breakpoint method was used to rank the anthropogenic heat fluxes, and the temporal changes of anthropogenic heat fluxes from 2000 to 2020 were classified into four categories: no-obvious-growth, low-growth, moderate-growth and high-growth. The natural breakpoint method was again used to quantify the spatial variation of anthropogenic heat fluxes from 2000 to 2020. The anthropogenic heat fluxes were classified into 5 classes: low, relatively-low, medium, relatively-high and high. Fig. 4a) shows the temporal variation characteristics of anthropogenic heat flux from 2000-2020, and Fig. 4b). shows the spatial variation characteristics of anthropogenic heat flux from 2000-2020.
The four levels and five types of anthropogenic heat flux in China from 2000 to 2020 are shown in Fig. 4. and Fig. 5. In terms of the temporal change pattern, the high-growth and moderate-growth types account for 0.003% and 0.15% of the total area of the study area, mainly concentrated in coastal areas, some inland metropolitan areas, and developed cities, including Beijing, Shanghai, Guangzhou, Shenzhen, and provincial capitals. The no-obvious-growth type and low-growth type account for 98.63% and 1.21% of the total area in China, respectively, and are mainly distributed in the inland and western regions of China.
In addition, it can be seen from Fig. 5. that the spatial variation pattern of anthropogenic heat flux in China is similar to the temporal variation pattern of anthropogenic heat flux. Low grade and relatively-low grade anthropogenic heat fluxes are mainly distributed in the inland and western regions, accounting for 98.32% and 1.18% of the national area, respectively. High grade and relatively-high grade fluxes are mainly distributed in coastal areas, accounting for 0.03% and 0.13% of the total area of China, respectively.
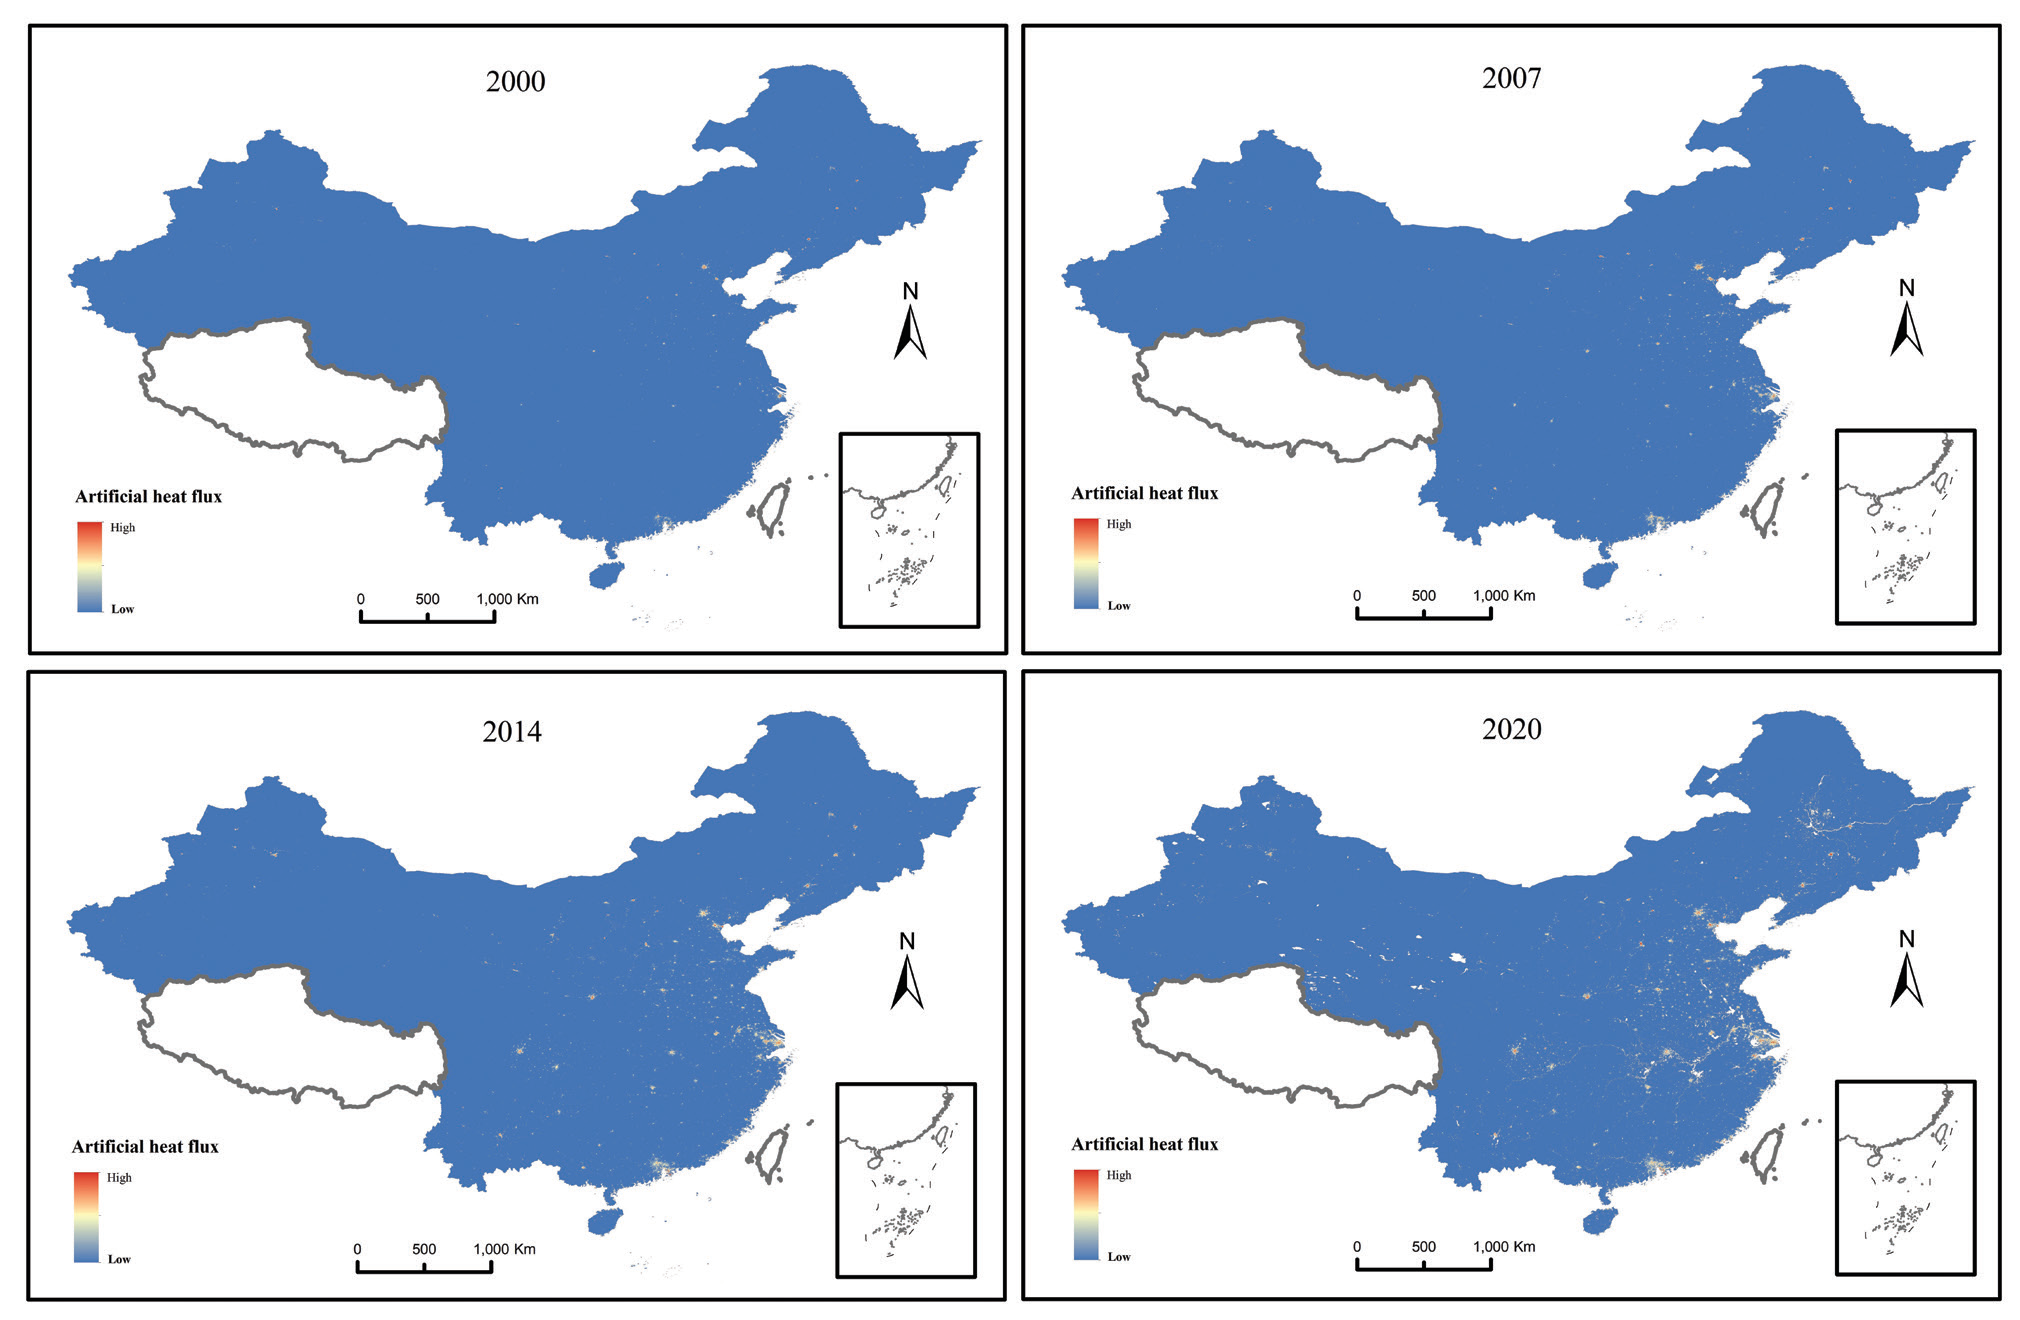
Fig. 4.
The temporal a) and spatial b) changes of anthropogenic heat flux in China from 2000 to 2020. Note: Negative growth is considered as no-obvious-growth.
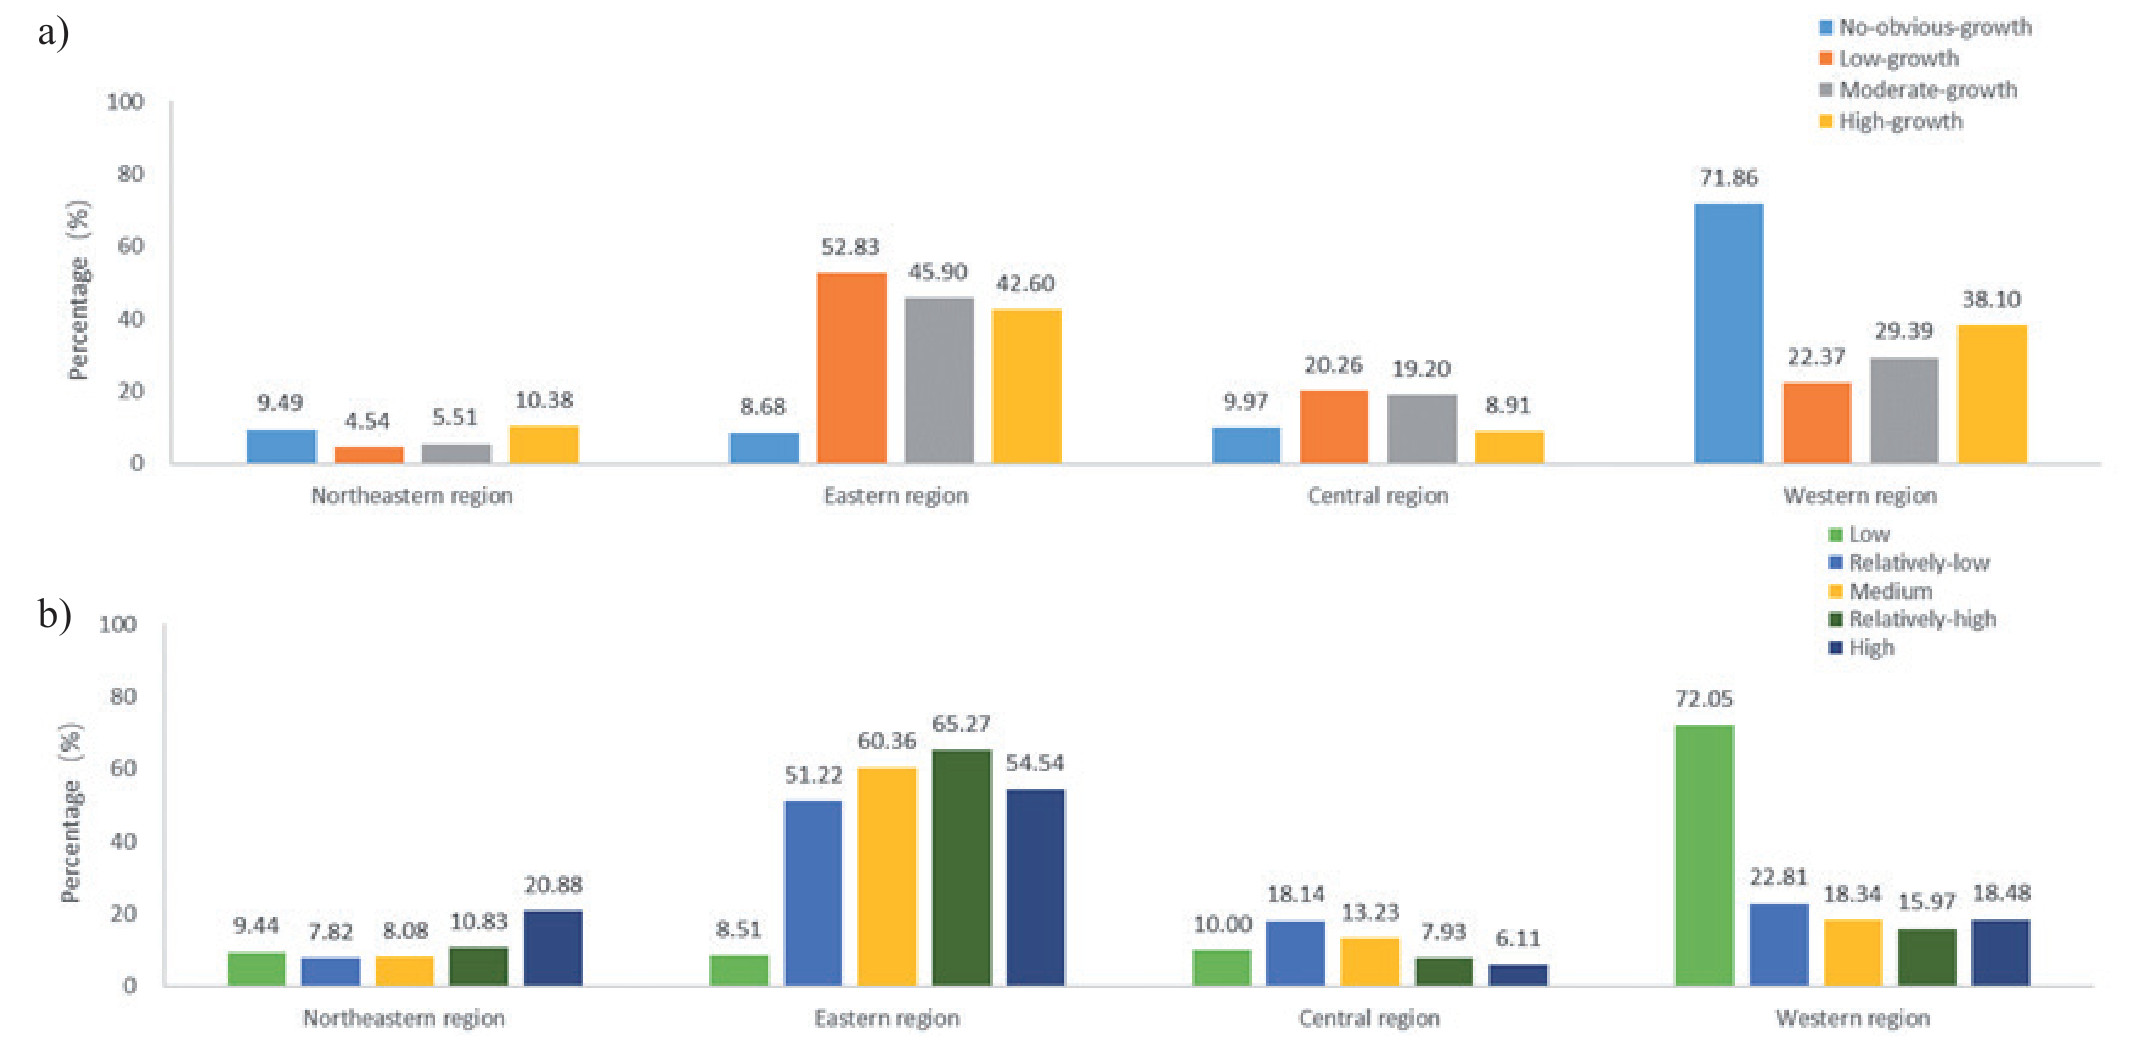
The spatial and temporal dynamics of anthropogenic heat fluxes at the regional scale and the percentage of area of each type and class in the four regions is shown in (Fig. 6a). In terms of temporal variation, the high-growth type is mainly distributed in the eastern and western regions, accounting for 42.6% and 38.1% of the total area of the high-growth type, respectively. The moderate-growth type is also mainly distributed in the eastern and western regions, accounting for 45.9% and 29.39% of the total area of this type. The low-growth type is mainly distributed in the eastern region, accounting for 52.83% of the total area of this type. The no-obvious-growth type is mainly distributed in the western region, accounting for 71.86% of the total area of this type. All four types of anthropogenic heat fluxes were lower in the northeast and central regions.
In terms of spatial variation (Fig. 6b), high grade, relatively-high grade, medium grade, and relatively-low grade were mainly distributed in the eastern region, accounting for 54.54%, 65.27%, 60.36% and 51.22% of the total area of this grade, respectively. The low grades are mainly distributed in the western region, accounting for 72.05% of the total area of this grade. The proportion of each grade in the central and northeastern regions is relatively low, and the distribution is more even.
In conclusion, the spatial and temporal variations of anthropogenic heat fluxes are mainly concentrated in the eastern and western regions, and the spatial and temporal variations of anthropogenic heat fluxes in the central and northeastern regions are not obvious.
From 2000 to 2020, the anthropogenic heat flux in China increased from 0.924 W/m2 in 2000 to 1.783 W/ m2 in 2020, with an annual growth rate of 4.56%. All anthropogenic heat flux emissions show an increasing trend. The top three anthropogenic heat fluxes in 2020 are: Shanghai, Tianjin and Beijing. Shanghai grows from 11.74 W/m2 in 2000 to 16.86 W/m2 in 2020, Tianjin grows from 3.14 W/m2 in 2000 to 6.48 W/m2 in 2020, and Beijing grows from 2.76 W/m2 in 2000 to 4.03 W/m2. The next three places in the ranking of anthropogenic heat flux in 2020 are: Qinghai Province, Xinjiang, and Gansu Province. Qinghai Province increased from 0.01 W/m2 in 2000 to 0.055 W/m2, Xinjiang increased from 0.027 W/m2 in 2000 to 0.108 W/m2 in 2020, and Gansu Province increased from 0.095 W/m2 in 2000 to 0.186 W/m2. In 2020, there were seven provinces with anthropogenic heat fluxes higher than the national average. The average annual growth rate of anthropogenic heat flux is lower than the national average in six provinces, and the bottom three are Heilongjiang (1.6%), Jilin (2.12%) and Shanghai (2.18%), while the top three average annual growth rates are Ningxia (30.13%), Qinghai (21.38%) and Inner Mongolia (19.37%).
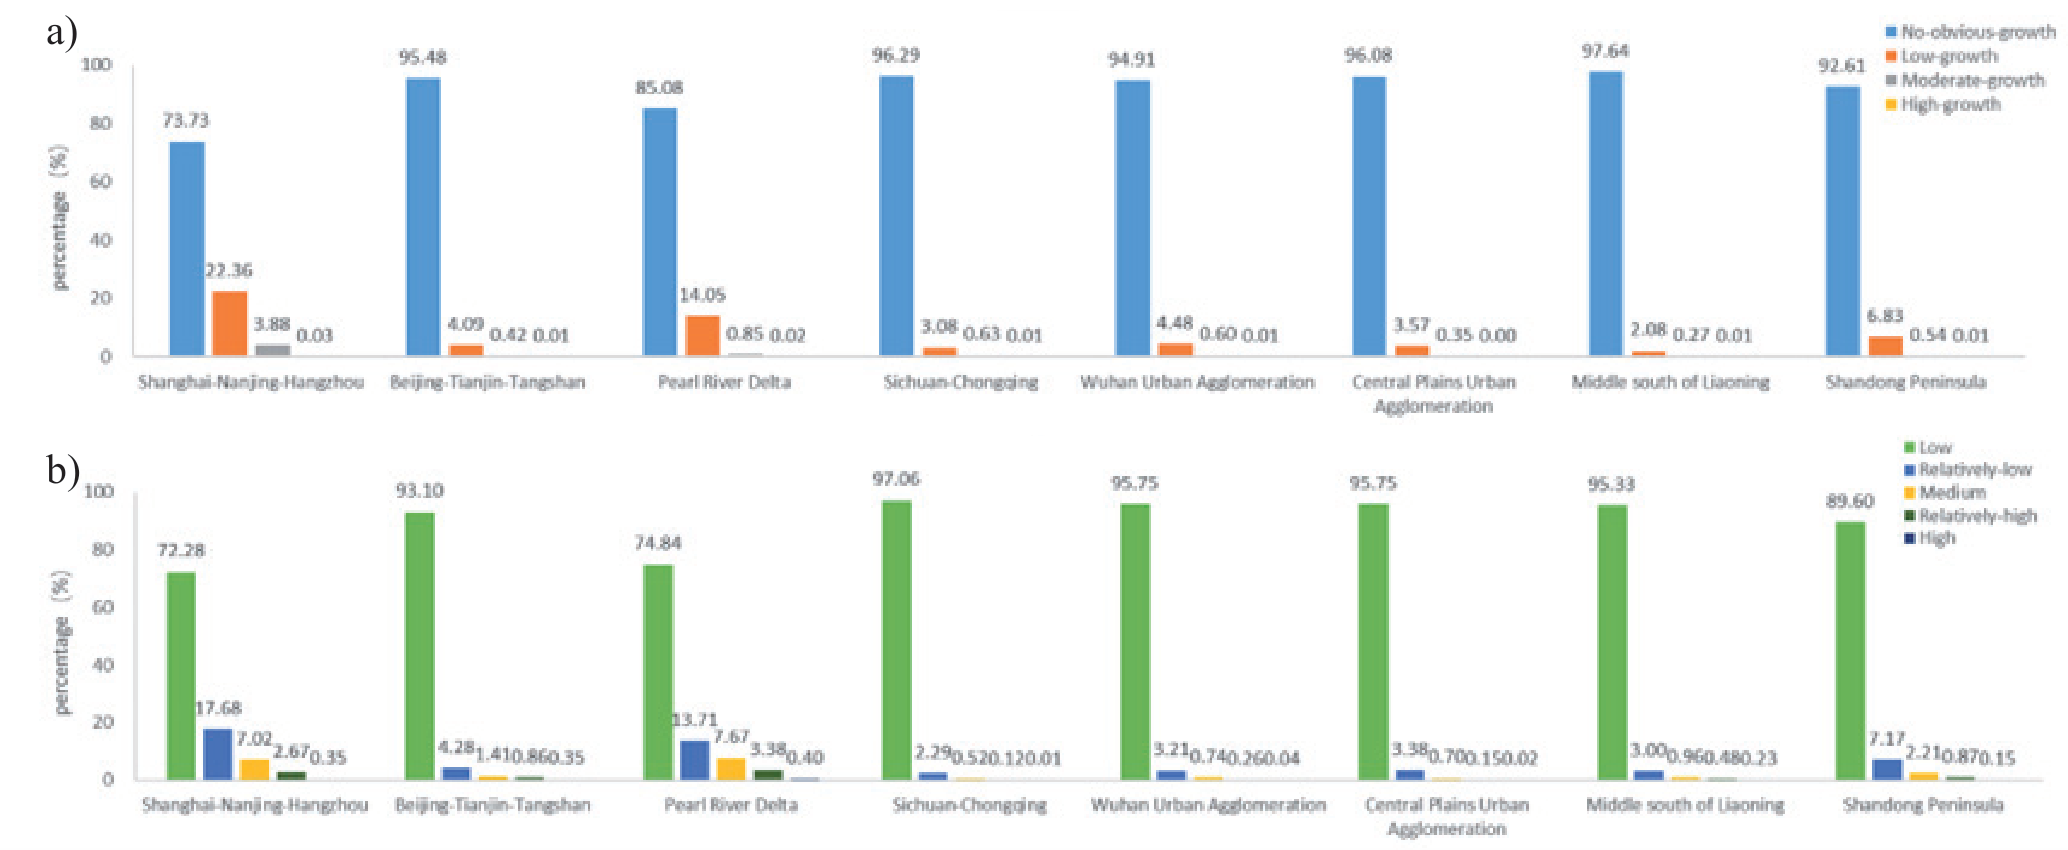
From 2000 to 2020, although the anthropogenic heat flux of these eight urban agglomerations continues to grow, the growth rate and increase vary greatly. In terms of area share, 97.64% of the urban agglomerations in Middle south of Liaoning, 95.11% of the urban agglomerations in Sichuan-Chongqing and 96.08% of the urban agglomerations in Central Plains are no-obvious-growth type. 22.36% of the area of Shanghai-Nanjing-Hangzhou and 14.05% of the area of Pearl River Delta are low-growth type. 3.88% of the area of Shanghai-Nanjing-Hangzhou and 0.85% of the area of Pearl River Delta are moderate-growth type. 0.03% of the area of Shanghai-Nanjing-Hangzhou and 0.02% of the area of Pearl River Delta are high-growth type. Among the eight major urban agglomerations, Shanghai-Nanjing-Hangzhou has the lowest percentage of low-growth type and Shanghai-Nanjing-Hangzhou has the highest percentage of high-growth type. In summary, Shanghai-Nanjing-Hangzhou and the Pearl River Delta have the most significant changes in anthropogenic heat fluxes.
97.06% of the area of the Sichuan-Chongqing urban agglomeration is at low grade of anthropogenic heat flux. 17.68% of the area of Shanghai-Nanjing-Hangzhou is at relatively-low grade of anthropogenic heat flux. 7.67% of the Pearl River Delta area is classified as a medium grade of anthropogenic heat flux. 3.38% of the Pearl River Delta area is of relatively-high grade of anthropogenic heat flux. 0.4% of the Pearl River Delta area is high grade of anthropogenic heat flux. The proportion of low grades of anthropogenic heat flux in the Sichuan-Chongqing urban agglomeration is the highest. The proportion of low grades of anthropogenic heat flux in Shanghai-Nanjing-Hangzhou is the lowest, and the Pearl River Delta has the second lowest proportion of low grades of anthropogenic heat flux. In summary, the high grades of anthropogenic heat flux are mainly distributed in the Shanghai-Nanjing-Hangzhou and Pearl River Delta urban agglomerations.
Based on the above analysis, it is not difficult to find that the anthropogenic heat flux in China has undergone significant changes over the past 20 years. The eastern coastal areas have a high population density, a high level of economic development, and the highest anthropogenic heat flux. The western region is sparsely populated, economically underdeveloped, and has the lowest anthropogenic heat flux. Due to economic development reasons, the average annual growth rate of anthropogenic heat flux in Heilongjiang and Jilin provinces in Northeast China ranks lower. Due to the saturation of economic development and population density in Shanghai, the average annual growth rate of anthropogenic heat flux is relatively low. Qinghai, Ningxia, and Inner Mongolia have experienced rapid development in recent years, resulting in higher annual growth rates of anthropogenic heat flux.
It can be seen that there is a certain correlation between economy, population density, and anthropogenic heat emissions. The high value areas of anthropogenic heat flux are mainly concentrated in economically developed urban areas, especially in the Shanghai Nanjing Hangzhou and Pearl River Delta urban agglomerations, as well as first tier cities such as Beijing, Shanghai, and Guangzhou. In addition, some cities or industrial areas with well-developed heavy industry and manufacturing industries may have smaller spatial areas and higher anthropogenic heat flux values, resulting in local anthropogenic heat flux even higher than that of certain large city centers. This article establishes a model between nighttime lighting and anthropogenic heat flux, and quickly and accurately obtains anthropogenic heat flux in prefecture level cities, which can provide reference for future related research.
Table 1.
Changes in growth of artificial heat flux by province (W/m2).
Conclusion
This article estimates the spatiotemporal distribution characteristics of anthropogenic heat flux in China using nighttime lighting data, and obtains the following conclusions:
From a spatial perspective, the anthropogenic heat fluxes show a decreasing trend from the eastern region to the central and western regions. The high-growth type of anthropogenic heat flux and high grade of anthropogenic heat flux are mainly distributed in the eastern region, and the low-growth type of anthropogenic heat flux and low grade of anthropogenic heat flux are mainly distributed in the western region. Among the eight major urban agglomerations, Shanghai-Nanjing-Hangzhou and the Pearl River Delta have the most obvious growth of anthropogenic heat flux and the highest percentage of high grade heat fluxes, while Middle south of Liaoning has the highest percentage of no-obvious-growth of anthropogenic heat fluxes, and Sichuan-Chongqing has the highest percentage of low grade anthropogenic heat fluxes.
From a time perspective, China’s anthropogenic heat flux increases from 0.924 W/m2 in 2000 to 1.783 W/m2 in 2020, with an annual growth rate of 4.56%. The bottom three in the average annual growth rate of anthropogenic heat flux are Heilongjiang (1.6%), Jilin (2.12%), and Shanghai (2.18%), and the top three in the average annual growth rate are Ningxia (30.13%), Qinghai (21.38%), and Inner Mongolia (19.37%).

