


Introduction
Coastal area management is critical since coastal areas host the majority of trade, tourist, and industrial activity. [1] estimated 23% of the global population resided within a 100-kilometer radius of the shoreline and <100 m above sea level. Population growth in coastal areas puts pressure on increasing demand for land for various residential and commercial activities [2]. On the other hand, coastal areas’ sensitivity to natural disasters such as climate change and sea level rise would result in floods, erosion, ecosystem loss, and other socioeconomic difficulties [3, 4].
Tidal floods in coastal areas are caused by high tides that impact regions lower than sea level during the highest tides. These floods occur regularly, particularly during periods of high sea levels [5]. Tidal floods often occur in delta regions, posing a threat to major cities worldwide, including Tokyo, Manila, Ho Chi Minh City, and Jakarta [6]. Tidal floods are exacerbated by rising sea levels resulting from global warming, land subsidence, and other natural phenomena [7]. This tidal deluge has many consequences, including social, physical, and economic effects on coastal populations. According to [8], tidal floods harmed dwellings, road infrastructure, public amenities such as schools and health services, sanitation, yards, dry fields, and ponds.
Previous studies on tidal flooding in coastal areas concentrated on mapping affected coastal areas [9-11] and adaptation to tidal floods [12-14]. Several studies have been conducted to assess coastal vulnerability indices in disaster management using spatial data and modeling [15-17]. Additionally, another study underscores the significance of understanding community resilience to flood disasters [18-20].
There is a close connection between resilience and vulnerability in disaster risk management [21]. As per the formal definition given by the United Nations Office for Disaster Risk Reduction (UNDRR), resilience is “the ability of a system, community, or society exposed to hazards to resist, absorb, accommodate, adapt to, transform, and recover from the effects of a hazard in a timely and efficient manner, including through the preservation and restoration of its essential basic structures and functions through risk management”. Whereas Vulnerability is defined as a condition caused by physical, social, economic, or environmental factors or processes that make individuals, communities, assets, or systems more vulnerable to the effects of hazards [22]. According to [21], adaptive capacity is a component of vulnerability and resilience, where poor adaptable capacity places a system or unit in vulnerability, but high adaptive capacity promotes resilience. Coastal resilience is described as the ability of socioeconomic and natural systems in the coastal area to deal with crisis scenarios such as sea level rise, catastrophic events, and human effects while preserving basic functioning and adapting to the crisis conditions [23].
Top-down and bottom-up methodologies are used in flood risk management and resilience evaluations [24]. According to [25], the top-down strategy involves quantitative data analysis at multiple levels of analytic units at the international, national, and local levels. Meanwhile, the bottom-up technique of qualitative analysis stresses community participation in understanding the social system of the community [26]. Using a qualitative methodology, [14] studied community choices for dealing with coastal flooding. According to the study’s findings, locals have made changes such as increasing the surface of their dwellings with wooden materials and freely building structures along the beach without government intervention. [20] investigated the socioeconomic resilience of coastal towns to flooding using a bottom-up method. [20] makes use of secondary data obtained from government entities. The majority of districts/cities have strong resilience, according to the conclusions of a quantitative analysis of socioeconomic resilience using nine indicators. Several researchers have used a combination of top-down and bottom-up techniques [24, 27]. [24] and [27] conducted their investigations in urban regions. However, there has been limited research on social resilience employing mixed techniques in rural areas adjacent to large cities (suburban areas).
Understanding social-environmental interactions and anthropogenic factors is a globally challenging issue. The DPSIR (Driver-Pressure-State-Impact-Response) framework is a qualitative method that serves as a conceptual framework for describing interactions between society and the environment [28]. This framework is highly flexible and effective in identifying chains of socio-ecological interactions and can provide a general context, thereby making it applicable to various regional problems. Since their formulation in the late 1990s, these guidelines have been widely adopted for ecosystem-based studies in various fields, such as assessing the ecological and socio-economic impacts of coastal and marine land use [29] and delta risk assessment to enhance the resilience of communities living in deltas [30]. DPSIR analysis conducted in the Yangtze River Delta (YRD) and Mekong River Delta (MRD) indicates that the driving factors for delta change are climate, sea level, and human activity. The risk of coastal erosion and land loss in the MRD is significantly broader and more severe than in the YRD. DPSIR recommends that, given the current condition of the MRD, which has exceeded the threshold for restoration, it is necessary to shift the mindset from Restoration to Adaptation. Adaptation strategies can help reduce risks and minimize impacts caused by climate change, such as the relocation of settlements from rapidly receding areas to higher ground [30].
Remote sensing data offers the advantage of providing spatial and temporal information, making it widely utilized across various sectors. It has been employed in numerous studies, encompassing analyses of changes and predictions of Land Use and Land Cover (LULC) [31], land cover assessments [32, 33], and evaluations of coastal flood vulnerability [17]. Currently, a plethora of satellite images are available, featuring diverse sensor types, spatial resolutions, and spectral resolutions, catering to a wide array of studies related to land and water. Landsat imagery is often utilized for LULC mapping due to its extensive historical archive spanning from the 1970s to the present, its availability at no cost, and its adequate resolution for LULC mapping purposes. Additionally, [17] employed Landsat, Sentinel, and Pleiades imagery to analyze coastal vulnerability.
The northern coast of Java Island, Indonesia, is a compelling area for researching tidal floods due to its dynamic characteristics, including sloping coastal morphology and small slope angles [34]. More than ten million people also occupy this area, so flooding results in large losses. The coast of Tangerang Regency, which is part of the north coast of Java Island, experiences great pressure from tidal floods because this area is a buffer area for Jakarta. Many Jakarta residents live in Tangerang Regency. Not much research on tidal floods has been carried out in this area, except for [15] and [35]. According to [35], the Tangerang coast is dominated by low-level hazard levels. [15] examined the coastal vulnerability index, and the result was that most of the Tanggerang coastal area was included in the medium Coastal Vulnerability Index (40%), low at 25%, and the remaining areas classified as very high, high, and very low vulnerability.
Given the necessity of data and information on tidal floods and population resilience for informed decision-making in sustainable coastal area planning, this research aims to: (1) calculate land use/land change (LULC) on the coast, (2) determine the level of socio-resilience in the coastal area of Tangerang, and (3) assess the perceptions and responses of individuals affected by tidal floods. By identifying the level of community resilience, stakeholders can develop effective risk management plans to mitigate the potential impacts of tidal flooding and provide valuable information for the affected community.
Material and Methods
Study Area
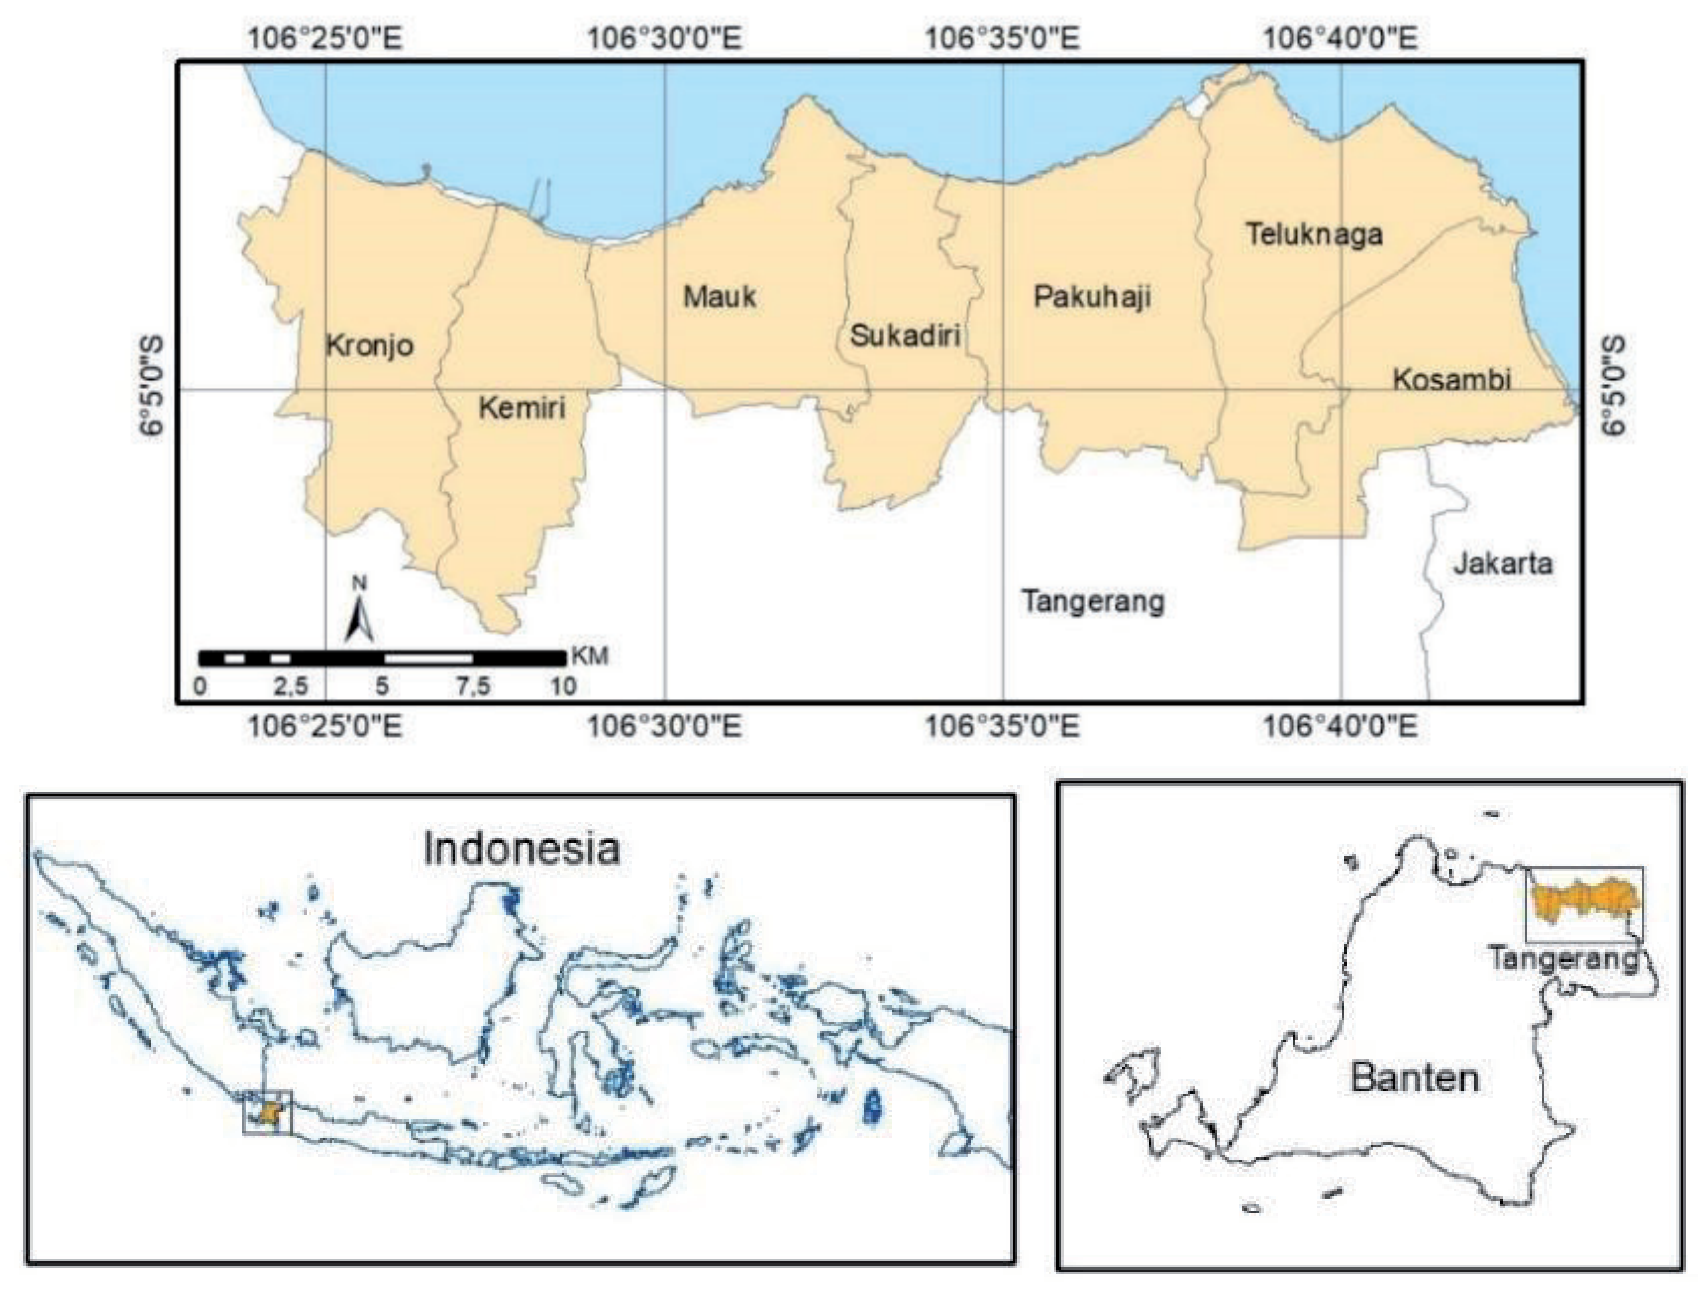
Tangerang Regency, situated directly adjacent to the capital city of Jakarta, spans geographically between coordinates 6°00’-6°20’ South Latitude and 106°20’- 106°43’ East Longitude [36]. With a coastline stretching approximately 50 kilometers, the regency encompasses a total of 29 subdistricts, of which only seven are coastal and directly face the sea. These coastal subdistricts include Kosambi, Teluknaga, Pakuhaji, Sukadiri, Mauk, Kemiri, and Kronjo (Fig. 1). The population of Tangerang Regency is 3,293,533 people [36], with approximately 20% residing in coastal areas. Geomorphologically, the Tangerang area is characterized by alluvial plains formed by numerous rivers that flow into the northern coast of Java, primarily comprising young, soft soils [37]. This study focuses on the vulnerability to tidal flooding in the seven coastal subdistricts.
Data Used
The study collected both primary and secondary data, with the main data gained through field observations, interviews, and questionnaires for respondents. The field survey, which lasted five days, was carried out in July 2022. Secondary data sources included the Central Bureau of Statistics (BPS), research reports, and scholarly journals. Purposive sampling was employed to select respondents based on criteria such as communicability, knowledge, familiarity with the topic, and direct exposure to coastal flooding. This method was chosen to ensure a targeted and informed representation of the affected population.
This research utilized Landsat as remote sensing data to generate land cover maps and predict changes in land cover. Researchers conducted field observations to verify the results of the image analysis. The collected data aimed specifically at mapping the socio-resilience of the research area. This included a focus on exposure and vulnerability, which are essential components for a comprehensive understanding of the region’s resilience to coastal flooding. Population density and the percentage of built-up area served as exposure sub-indicators. In contrast to the research by [20], this study incorporated a built-up area variable. This was done to account for environmental variables when assessing community resilience to coastal flooding. Based on research by [38], it was found that LULC changes had a significant impact on riverine flooding. Vulnerability was identified by considering vulnerable groups among the affected population. These groups included children under the age of five, the elderly population (60+), homeless persons, disabled persons, mangrove habitat quality, and the number of Base Transceiver Stations (BTS) (refer to Table 1). Most of the socio-economic data was sourced from the BPS (Central Bureau of Statistics).
Data Analysis
The study was divided into three stages, namely:
(i) LULC of coastal Tangerang Regency; (ii) Assessment of socio-resilience based on coastal Tangerang; and (iii) Analysis of socio-environmental characteristics of the Tangerang community to describe community adaptation to tidal floods. Qualitative and quantitative research methods were used in this study.
LULC of Coastal Tangerang Regency
There are many classification algorithms for Land Use/Land Cover (LULC) mapping, including k-Nearest Neighbor (kNN), Artificial Neural Network (ANN), Support Vector Machine (SVM), and Random Forest (RF) [39]. In this research, Random Forest (RF) was employed for the image classification of land cover. The advantages of RF classification in land cover mapping include higher classification accuracy, relatively low computational cost, and the ability to measure variable relevance [40, 41]. There are eight classes of land cover: bare soil, built-up, dry land farming, mixed dry land farming, paddy fields, ponds, shrub grass, and water bodies. The study utilized Google Earth Engine (GEE) technology to obtain cloud-free satellite images. This technology aggregates all images over 12 months into a single, cloud-free representation, ensuring the production of a year-representative image. Landsat imagery was utilized to acquire data on LULC change between 1990 and 2021.
Socio Resilience of Coastal Tangerang
The identification of socio resilience was accomplished using a quantitative approach based on the criteria listed in Table 1. The Geographic Information System (GIS) application utilized a scoring method and multi-criteria analysis, considering the specific criteria outlined in Table 1, to identify areas of socio-resilience. This method entailed rating various characteristics associated with socio-resilience and assigning scores on a scale from 1 to 5. Areas with higher scores, indicating higher exposure/vulnerability, were interpreted as having lower socio-environmental resilience, aligning with the understanding that high vulnerability is associated with poor resilience [20, 42]. Conversely, lower scores suggested higher socio resilience. The formula for spatial analysis is as follows:
Where SRscore is the socio resilience value, s represents the score for classes 1 to 5, and n is the number of variables. Socio resilience is categorized into five levels: very low, low, moderate, high, and very high.
Socio-Economic Environment Characteristics of the Tangerang Community Related to Tidal Floods
This research uses in-depth interviews and observations conducted with the people of Tangerang Regency who live in coastal flood-prone areas to assess their responses and adaptation strategies to the dangers of tidal floods. Qualitative descriptive methods explain the community’s characteristics based on the results of the interviews. The qualitative methodology was used in this study to investigate the relationship between people’s resource use activities and coastal flood resilience. A total of 18 key informants were selected, consisting of local residents affected by the flood, youth leaders, heads of neighborhood associations, as well as officials at the subdistrict/village level and the Regional Disaster Management Agency of Tangerang. The in-depth interview focused on obtaining information about the adaptation strategies carried out by the local community to reduce the tidal flood risk. The questionnaire consisted of the following components: The information gathered includes the height of the rob inundation, the duration of the rob event, the coverage of rob-affected areas, and the distance of communities from the coast. A qualitative approach, employing DPSIR analysis, is utilized to analyze the data gathered from agency reports and interview results. The DPSIR framework was developed by the Organization for Economic Cooperation and Development (OECD) in 1993. This framework evolved from PSR [43] to the DPSIR framework [28]. According to [44], DPSIR is considered one of the original tools for adaptive management of environmental problems.
Table 1.
Variables used to measure socio-environmental resilience (Modification from [20]).
Results
LULC of Coastal Tangerang Regency
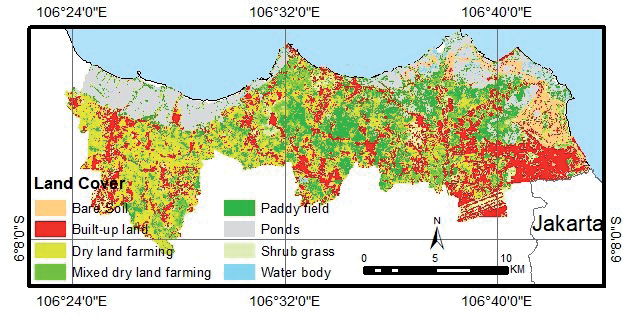
The results obtained from estimating Land Use/ Land Cover (LULC) changes in the period from 1990 to 2021 indicated that bare soil expanded extensively, covering 5.48% in 2022 compared to 0.1% in 2021 (Table 2). Ponds dot almost the whole Tangerang shoreline. Meanwhile, the most densely populated area is in Tangerang’s western region, which borders Jakarta (Fig. 2). According to Landsat data, 21.61% of the coastal area will be built up by 2021. The expansion of built-up areas is quite rapid, with an increase in built-up areas of 869% between 1990 and 2021. The rapid growth of built-up areas can alter environmental patterns. According to research by [45], the Normalized Difference Built-Up Index (NDBI) is positively correlated with land surface temperatures (LST), indicating that built-up areas have the potential to form urban heat islands (UHI).
Paddy field area, on the other hand, declined by 71% (Table 2). It is necessary to recognize that the high growth of built-up areas and bare soil will enhance the vulnerability of the Tangerang coast in the future. This is in accordance with research by [46] showing that built-up areas are very vulnerable to flooding. Land use changes may have a negative influence on the surrounding ecosystem and degrade the quality of the coastal environment [47]. As a consequence, rising building areas will result in increased surface runoff and decreased absorption of groundwater [48].
Socio Resilience of Coastal Tangerang
Socio resilience analysis used eight variables, which are the population density (people/km2), percentage of built-up area, children under the age of five, the elderly population (60+), homeless persons, disabled persons, mangrove habitat quality, and a number of Base Transceiver Station. The population density in all of Tangerang Regency’s coastline administrative units was greater than 1,000 people per square kilometer in 2021, as shown in Fig. 3a) [36].
All Tangerang coastal subdistricts had a proportion of children under the age of five ranging from 5% to 10% (Fig. 3b) and a percentage of individuals over the age of 60 ranging from 5% to 10% (Fig. 3c). In Kemiri, Kronjo, and Sukadiri, the number of disabled people was under 250 each. Meanwhile, in Kosambi, Mauk, Pakuhaji, and Teluknaga, there are between 250 and 500 disabled people (Fig. 3d). The number of homeless people varies substantially in each Tangerang subdistrict. The number of homeless people in Kosambi and Sukadiri ranged from 101 to 200. Kronjo and Mauk had between 201 and 300 homeless people. More than 400 people were homeless in Pakuhaji and Teluknaga. Only one subdistrict had between 301 and 400 homeless people (Fig. 3e). Teluknaga has the greatest number of Base Transceiver Stations of any coastal subdistrict in Tangerang (Fig. 3f).
Tangerang Regency has an abundance of mangrove resources, which are scattered throughout coastal subdistricts both inside and outside of forest regions. According to [49, 50], there are three types of mangroves in coastal Tangerang: low, medium, and high conditions. Tangerang Regency only has mangrove ecosystems in Kosambi, Teluknaga, Pakuhaji, Mauk, Kemiri, and Kronjo subdistricts. Sukadiri subdistrict has no mangroves, as indicated by the mangrove distribution map (Fig. 3g). The habitat quality of the Kronjo Subdistrict ranges from low to medium. Mangrove habitats of higher quality were discovered in the Mauk and Kosambi subdistricts [50].
Table 2.
Land cover on the coastal of Tangerang Regency.
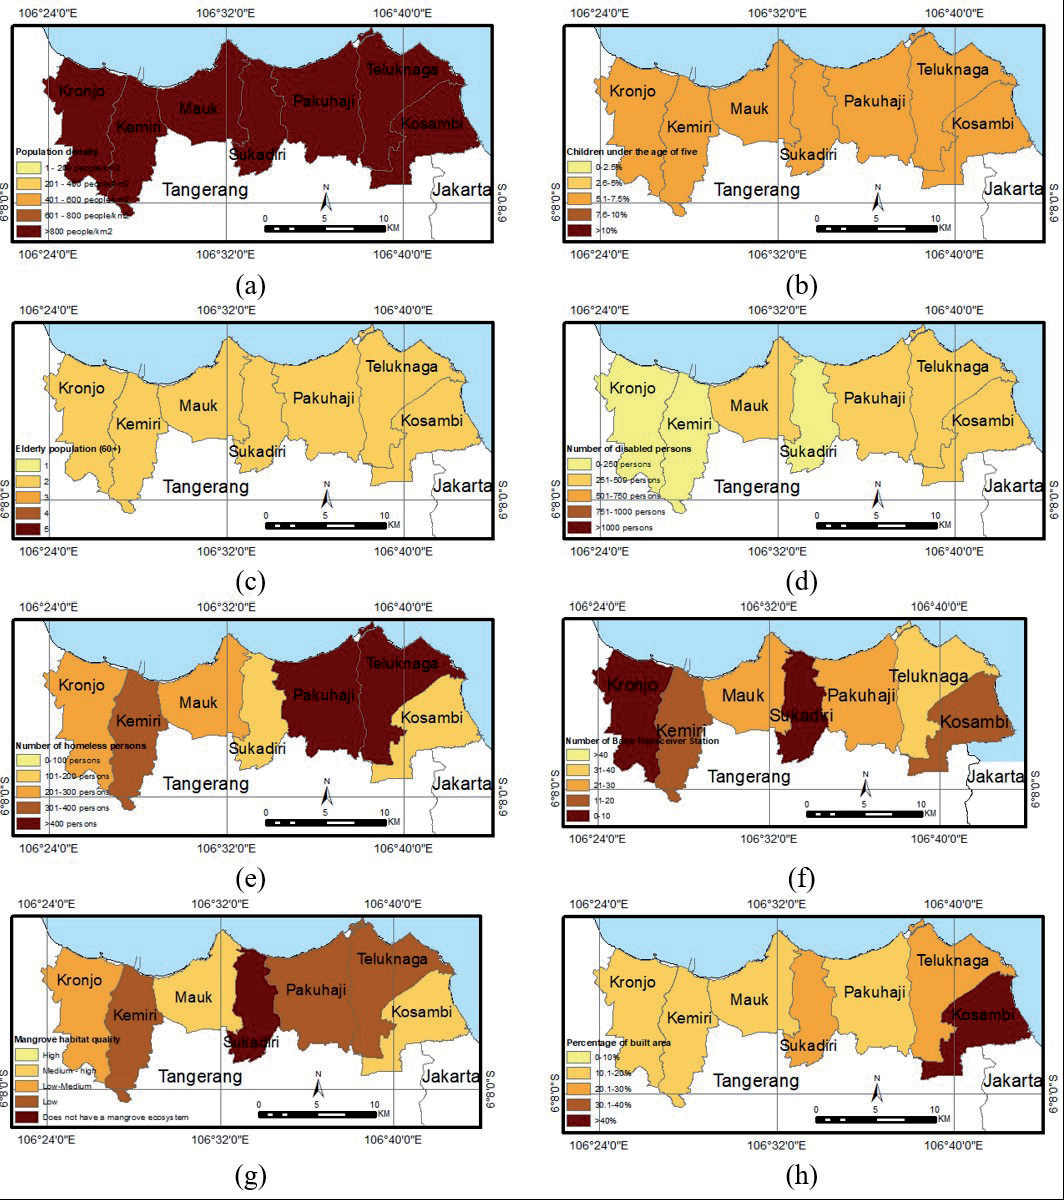
Based on the results of the LULC analysis, Kosambi has the highest built-up area on the Tangerang coast, accounting for more than 40% of the total area. Sukadiri and Teluknaga’s built-up areas ranged from 20.1% to 30%. Meanwhile, the built-up areas in Kemiri, Kronjo, Mauk, and Pakuhaji range from 10.1% to 20% (Fig. 3h).
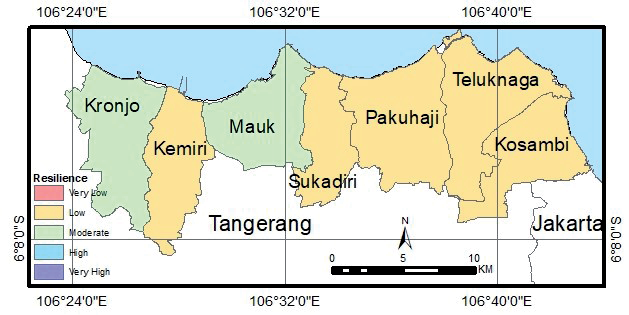
This study has incorporated exposure and vulnerability parameters that are integrated with GIS software to examine the resilience index comprehensively. Fig. 4 depicts the overlay results. A higher social resilience index score indicates greater vulnerability to coastal flooding. The findings of the analysis around Tangerang’s coast are classified as moderate and low resilience (Fig. 4). Kronjo and Mauk show moderate resilience compared to other subdistricts with low resilience.
The Socio-Environmental Conditions Related to Tidal Floods
Observations in the coastal area of Tangerang show that the community in this regency is vulnerable to tidal floods, which are influenced by the socioeconomic conditions of the community, as evidenced by the vulnerability of physical buildings to disasters. According to the findings of a field survey conducted in July 2022, the towns most affected by coastal flooding were located on the eastern shore of Tangerang Regency, which borders the City of Jakarta, specifically in the subdistricts of Kosambi, Teluk Naga, and Pakuhaji. Dadap Village in Kosambi suffered the most from coastal flooding. Tidal floods occur often every day in Dadap Village between 19.00 and 24.00. Meanwhile, in the Teluknaga subdistrict, the tidal floods are often in Tanjung Pasir, Muara, and Lewa.
Abraded beaches were found in Pakuhaji, Suryabahari Village, and Kramat Village. The Anom shore in Kramat Village, which is located 2 kilometers from the shore, has been abrasive for a long time. Embankments and breakwaters are constructed to reduce seawater runoff. The majority of the coast of the Sukadiri subdistrict has breakwaters to reduce ocean runoff. Settlements are located far enough away from the ocean to avoid harm from seawater discharge.
Mauk subdistrict has a few food kiosks on the beach, though not as many as Sukadiri. Milkfish ponds are right adjacent to the sea in Ketapang Village are overwhelmed by seawater (abrasion). Ponds can be found near the Kemiri and Kromjo subdistricts’ beaches. Mangroves in good condition can be seen along the road leading to Cup Island Beach in Kromjo Village, a beach tourism destination. Embankments were built along areas of the beach to reduce abrasion.
Tidal floods, attributed to high tides, occur monthly. According to interviews with key informants, the majority (66.67%) experienced flooding due to high tides. A significant portion (89%) have been dealing with floods for over 5 years, with 11% experiencing them for 2-5 years. Some respondents faced flooding for 2-6 hours, while others endured it for more than 6-12 hours. In interviews, all respondents reported flood levels reaching 30 cm to 60 cm, irrespective of their proximity to the beach – whether within 1 km or beyond.
Flooding is a common occurrence in Tangerang Regency, particularly along the eastern coast. Despite monthly floods, evacuations are infrequent. Residents, even in the face of frequent flooding, choose not to evacuate due to their status as Indigenous people living close to their workplaces. This sentiment is evident in the interview results, where 61% of respondents chose not to evacuate during floods, while only 39% sought refuge in school buildings, offices, or sports facilities. Many residents who chose not to evacuate expressed a reluctance to move, driven by their status as native inhabitants of the area.
Residents in the area have employed various strategies to adapt to frequent flooding, primarily focusing on minimizing the inflow of water into their homes. These efforts include raising the floor level and constructing embankments. The interview findings reveal that 45% of respondents built embankments, and 28% elevated their houses to mitigate water ingress. Conversely, 27% of respondents did not undertake any preventive measures.
Houses are damaged by coastal floods, which include sinking foundations, cracked ceramic tile floors, and damaged walls and doors. Aside from that, often flooded floors can harm the foundation structure. Local communities suffer economic losses as a result of the finances required for house repairs. Approximately 50% of the respondents reported economic losses ranging from IDR 500,000 to IDR 1,500,000, while 17% reported losses exceeding IDR 3,000,000. As a result, they attempted to mitigate the impact by creating embankments on their own as an adaptation to floods.
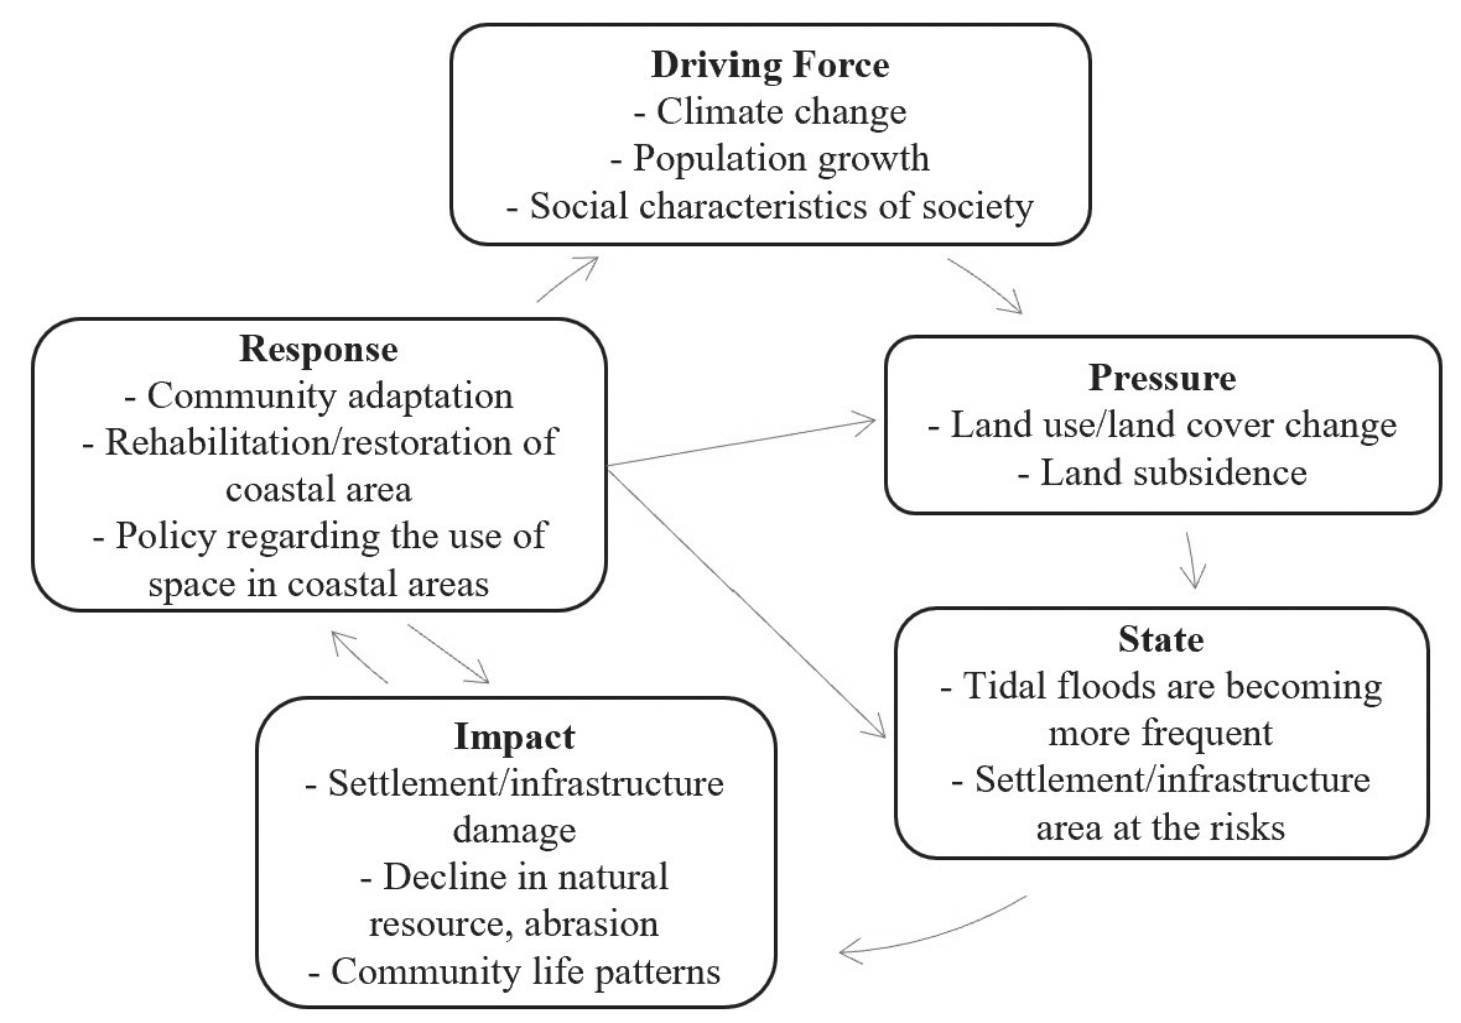
The DPSIR framework was developed based on the results of interviews with key informants, as explained above. The detailed list of DPSIR elements for tidal floods is shown in Fig. 5. The driving forces behind tidal floods in Tangerang Regency were identified as climate change, increased population numbers, and the social characteristics of society. Based on a DPSIR analysis, the driving force behind tidal flooding is climate change. Tidal floods are caused by rising sea levels globally [51]. This sea level rise is caused by the phenomenon of global climate change, which is characterized by an increase in the Earth’s average temperature. According to [52], during 2010-2019, the rate of ocean surface warming has accelerated to 0.280±0.068ºC per decade, 4.5 times higher than the long term. Sea surface temperatures have also increased in Indonesia. An increase in population will increase the need for housing, causing changes in environmental conditions. Changes in environmental conditions exert pressure on coastal areas, manifested through alterations in land use/land cover, and land subsidence [53]. The state defines these conditions as the environment. Currently, on the Tangerang coast, coastal flooding is becoming more frequent, posing a risk to settlements and infrastructure.
The impacts resulting from coastal flooding include damage to settlements/infrastructure, a decline in natural resources such as mangrove ecosystems, and changes in the lifestyle of coastal communities. Responses to address these issues take the form of community adaptation to coastal flooding, repair/ rehabilitation of coastal areas, and the implementation of policies to regulate the use of space in coastal areas.
Discussion
This research uses qualitative and quantitative approaches on the coast of Tangerang Regency. According to the research findings, most Tangerang subdistricts have low resilience, which is attributed to the high population density. The subdistricts that is considered moderately resilient are the Mauk subdistrict because the condition of the mangroves is still good [50], and the Kronjo subdistrict has a low number of disabled [36]. However, the findings contradict those of [54]; they suggest that the mangroves in the Mauk subdistrict are in poor condition. Mangroves are degrading due to activities such as reclamation for settlements, removal of pond land, and the dumping of solid and liquid waste on the coast. Efforts are needed to repair Tangerang Regency’s mangrove ecosystem to ensure the sustained economic and ecological significance of mangroves. It is necessary to strive for these low and moderate resilience conditions to become a high resilience class. Therefore, it is necessary to increase the capacity for adaptation to coastal flooding by the community and local government by implementing mitigation policies in areas that are vulnerable to tidal floods. Building social and economic adaptability requires a balanced approach, encompassing public infrastructure, compensation and funding systems, and institutionalization [54]. [55] stated that the ability to adapt to coastal flooding must be prepared before, during, and after a storm.
Based on information from local residents, the height and area of the inundation have expanded in the past two years. Tangerang’s tidal floods, which occur every month, are most likely caused by rising sea levels caused by global warming and land subsidence. According to [56], the average worldwide sea level rise has reached 2.6 mm/year. Meanwhile, [53] discovered that land subsidence on Jakarta’s north coast and Tangerang Regency has reached 6 cm/year. This tendency toward land subsidence increases vulnerability to floods not only in Indonesia, but also in numerous coastal towns around the world [56]. It is anticipated that coastal flooding will increase in frequency and extent in the future, requiring appropriate management of coastal flood vulnerabilities.
Local populations have long adapted to coastal flooding occurrences, whether through physical adaptation to the environment, economic adaptation via changes in livelihoods, or social adaptation through temporal adjustments to natural catastrophes. As stated by [51], adaptation carried out by the people in Demak, who regularly experience coastal flooding, includes physical, economic, and social dimensions. When floods occur, those accustomed to coastal flooding choose to remain at home and protect their valuables from flooding. Physical adaptations by the community involve erecting cement barriers in front of doors, storing valuables and electronics in safe locations away from floodwaters, and making repairs to elevate the position of their houses [55, 57, 58]. Additionally, adaptation to various coastal flood circumstances can be achieved through the construction of polders and pumps or by migrating to higher ground [4]. Societies mobilize economic resources to adapt to flooding [51]. According to [59], efforts to anticipate risks, mitigate impacts, and implement gradual strategies for adaptation, evolution, and growth can be evaluated as indicators of community resilience.
However, an interesting observation arises from the fact that, despite experiencing tidal flood disasters regularly, residents exhibit reluctance to relocate to new areas. This phenomenon is not limited to the research location but is also evident in other places, such as Demak. The primary reason for residents’ reluctance to move elsewhere is the scarcity of alternative living options, coupled with the necessity of continuing their livelihoods as fishermen, which requires them to reside in coastal areas [51].
This study examines coastal flooding at the subdistrict level, indicating a necessity for further research at a finer granularity, such as the village level, to comprehend the heterogeneity of resilience to catastrophes. Due to constraints regarding the completeness of available secondary data, resilience analysis remains constrained. Additional research is required to develop comprehensive resilience indicators encompassing environmental, physical, economic/ financial, social, and institutional dimensions [57, 60, 61]. Investigating adaptive capacity further presents an intriguing avenue in the field of coastal flood disaster management.
Conclusions
Development in the coastal areas of northern Java is relatively fast. This is evidenced by the increase in built-up areas, which tend to rise every year. The coast of Tangerang Regency, which directly borders the capital city of Jakarta, has experienced an average growth rate of more than 20% per year in the last 30 years. Increased built-up growth has negative effects on the environment, in the form of decreasing water catchment areas. DPSIR has been used to analyze the causes and consequences of resilience to tidal floods. The driving forces behind tidal floods in Tangerang Regency were identified as climate change, increased population numbers, and the social characteristics of society. The impact of tidal flood disasters in coastal areas includes damage to settlements, infrastructure, and public facilities. This is detrimental both to the community as users and to the government as providers of public facilities. Economic issues may also arise in areas inundated by tidal floods, such as traffic jams caused by water pooling on roads. Stagnant water can also lead to the formation of slums and increase the susceptibility to diseases. Solutions to these concerns include community adaptation to coastal floods, rehabilitation of coastal areas, and the implementation of regulations governing the use of coastal space.
Socio-environmental resilience assessment with respect to flooding is one tool to determine the ability of socio-economic and natural systems to face various disaster scenarios in a timely and efficient manner, including the preservation and restoration of structures through risk management. The results of the analysis of socio-environmental resilience in Tangerang are in the low to moderate class. Flooding is attributed to a combination of physical factors, including tidal waves, rising sea levels, and land subsidence. As the height and area of flooding expand year after year, coastal management must consider mitigating actions, whether by local communities, non-governmental organizations, or regional and national governments. Tangerang necessitates a mitigation strategy that encompasses physical, economic, and social approaches. Based on interviews with local communities, it is possible to conclude that community preparedness for coastal floods is rising, as is the ability to learn from prior flood occurrences. This competence must be enhanced in order to lessen the danger of disasters.

