

Introduction
Mineral resources are a crucial component of social and economic development, and their development and utilization have played a significant role in China’s economic growth [1]. However, irresponsible and unsustainable mineral exploitation, production, and management practices have resulted in the formation of mining wastelands, including tailings ponds, waste residue, and waste rock fields from non-ferrous metal mining and smelting. These wastelands occupy a considerable amount of land and cause ecological damage [2], biological imbalances, and environmental pollution in surrounding areas [3, 4]. Heavy metals, which are persistent and potentially toxic pollutants, are present in the soil for extended periods and accumulate continuously, leading to contamination of the food chain and endangering ecological safety [5–7]. Heavy metals also pose a direct threat to human health through contact, inhalation of dust, and consumption of contaminated water and food [8-10]. Further, ingesting crops grown on contaminated soil is a significant pathway for heavy metal ingestion [11]. In China, mining wasteland covers over 1.5 million hectares, and this area is increasing by 47,000 hectares annually [12]. In recent years, heavy metal pollution incidents have become increasingly frequent in the surrounding areas of mining areas [13–15].
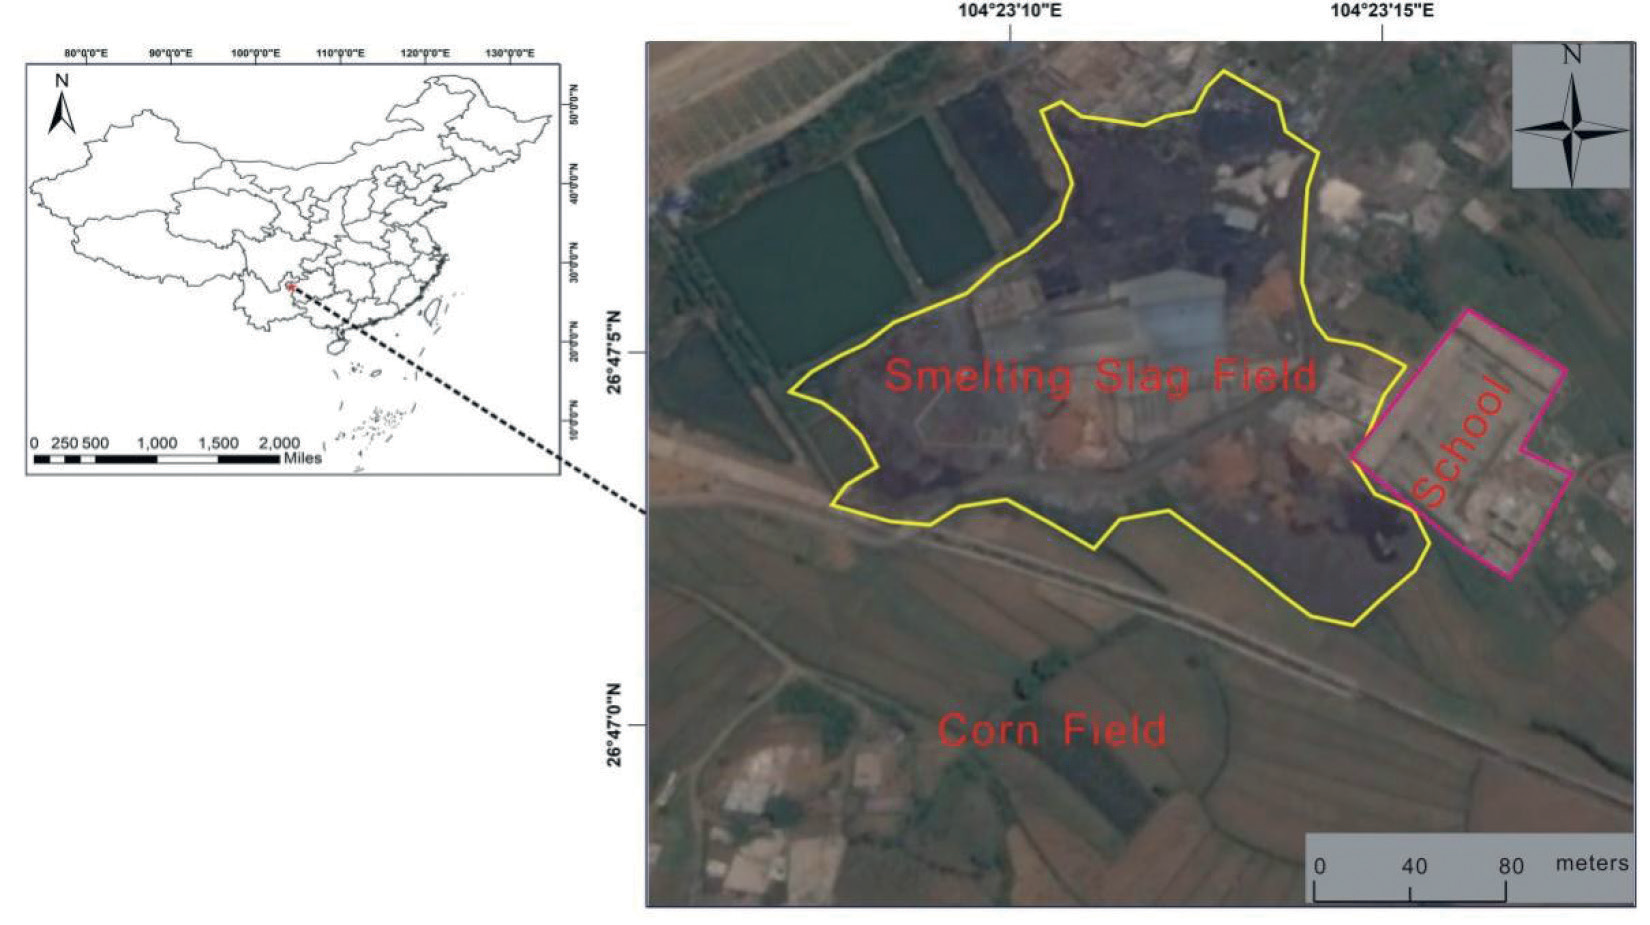
Northwest Guizhou is a rare zinc-rich deposit in China, with a history of indigenous zinc smelting dating back over 300 years [16]. However, due to outdated smelting technology, the recovery rate of zinc from indigenous zinc smelting is low. This results in the wastage of associated heavy metal elements such as lead, cadmium, and copper, as well as a lack of environmental protection facilities. This predatory and unitary mining activity not only generates a large amount of waste and loss of resources in the lead-zinc mining areas but also leads to the permeation or flow of heavy metal elements into the soil near the mining area through surface water, resulting in excessive heavy metal content in the soil and plants nearby [17, 18]. Furthermore, the unreasonable discharge of ‘three wastes’ in the ore dressing and smelting process exacerbates the pollution of heavy metals in the environmental soil.
This study focuses on the waste slag heap and surrounding farmland of an indigenous zinc smelter in Northwest Guizhou as the research area. It analyzes the content and enrichment of heavy metals in the waste slag-soil-crop system through field sampling and laboratory tests. The pollution characteristics of heavy metals in the soil and crops were evaluated using the single/comprehensive pollution index method. Additionally, the potential impact of heavy metals on adult and child health was analyzed using the human health risk assessment model. The aim is to provide a scientific basis for farmland environmental management, agricultural product risk prevention, and regional sustainable development in this area and similar areas affected by indigenous zinc smelting in Northwest Guizhou.
Materials and Methods
Study Area
The study area was situated in Maoshui Village (26°46′N, 104°23′E), Weining County, Guizhou Province, China. It features a typical karst landform with an elevation of approximately 2140 m. The area experiences a subtropical monsoon humid climate, characterized by an average temperature of 11.1℃, a frost-free period of 178 days, an annual average sunshine time of 1812 hours, and an annual rainfall of 1100 mm. The zinc smelting slag heap covers a total area of about 10,000 m2, with an average height of around 10 m, and has been accumulating for over 30 years. East of the slag heap lies Maoshui Primary School, serving over 300 teachers and students, with several peasant households nearby. Some crops have been planted at the edge of the slag heap, while to the southeast and south of the slag heap, there are extensive corn fields (Fig. 1).
Field Sampling
In May and November 2020, waste slag soil, crop rhizosphere soil, and crops were collected from the zinc smelting waste slag dump and its surrounding area through field investigations and sampling, including:
1. 7 waste slag samples from different sites, each composed of 4 subsamples.
2. 11 crop samples were collected at the periphery of the slag heap, including nine crops such as corn, potato, soybean, kidney bean, radish, cabbage, rapeseed, cauliflower, and Chinese cabbage. Among them, radish samples were further categorized into radish tubers and radish leaves (one sample each due to the abundance of radish and corn cultivation in the local area). Additionally, rhizosphere soil samples of the respective crops were collected, with 4 sub-samples taken for each crop. In total, 44 crop sub-samples and 44 corresponding crop rhizosphere soil samples were collected.
3. Starting from the slag heap as the reference point, samples of farmland soil and edible corn were collected from corn fields in the southeast direction of the slag heap at various distances (0 m, 10 m, 30 m, 60 m, 100 m, 150 m). At each distance site, 4 corn samples and 4 soil samples were collected, resulting in a total of 24 corn seed samples and 24 soil samples.
Sample Treatment and Analysis
The collected slag and soil samples were transported to the laboratory and air-dried. Subsequently, the gravel, plant roots, and other impurities were removed from the slag soil. After thorough mixing, the slag and soil were ground with a mortar and passed through a 0.25 mm nylon sieve. The resulting material was sealed and numbered for storage.
The collected crop samples underwent a series of rinses, first with tap water three times, followed by three rinses with deionized water. The plant samples were then divided into two parts for subsequent water content and heavy metal content analysis. After natural drying, the crop samples were subjected to high-temperature desiccation at 105℃ for 30 minutes and then dried at 65℃ for 3 days until a constant weight was achieved. Each plant sample was subsequently milled to a fine powder prior to chemical analysis.
For the plant samples, digestion was carried out using a 4:1 ratio of concentrated HNO3 to HClO4. The residuals were re-dissolved by HNO3 (2%) and diluted with distilled water. On the other hand, the soil samples were digested using a concentrated mixture of HNO3, HClO4, and HF (at a ratio of 6:2:2) to analyze the total heavy metal content.
Water used for dilution and dissolution was purified using a Millipore deionizing system at 18.2 MΩ. The HNO3, HF, and HClO4 utilized were super pure reagents. The total metal concentrations in digestive solutions were determined using inductively coupled plasma optical emission spectrometry (ICP-OES, Optima 5300DV, PerkinElmer, US) and inductively coupled plasma mass spectrometry (ICP-MS, ELAN DRC-e, PerkinElmer company, US) at the Center for Environmental Remediation, Institute of Geographic Sciences and Natural Resources Research (IGSNRR), Chinese Academy of Sciences. Certified reference materials (GSS- and GSV-) obtained from the Center of National Standard Reference Materials of China, as well as blank samples, were included in each batch of analyses for quality assurance procedures. Good agreement was obtained between our method and certified values. All samples were analyzed in duplicate, and the analytical precision was accepted when the relative standard deviation was within 5%.
Data Analysis
Single Pollution Indices
The level of soil contamination by each metal was assessed using the single pollution load index (Pi), which is the ratio of metal concentrations in the surveyed soil to those in the reference soil [19]:
where Ci and Si represent the contents of heavy metal in the survey and reference soils, respectively.
Nemero Composite Pollution Index
The Nemero composite pollution index (PN) was employed to evaluate the overall pollution status of the soils or plants for all the heavy metals. This method not only takes into account the average level of pollution from various heavy metals but also identifies the most severe contamination in the soil or plants caused by a single heavy metal. The calculation is as follows [20]:
Where Pi was the single pollution index for each metal.
Health Risk Assessment Model
(1) Expose the model and parameters
This paper calculates the human health risk for children and adults through three exposure pathways of respiratory inhalation (ADDinh), hand-to-mouth ingestion (ADDing), and dermal contact (ADDdrem), using the average value of heavy metal content in slag [21]. The assessment of carcinogenic and non-carcinogenic risk follows the methodology introduced by USEPA (1989), and the calculations are presented in Eqs. (3)-(5) [22] :
where C represents the metal concentration in the samples, IngR denotes the ingestion rate, InhR represents the inhalation rate [17], PEF is the particle emission factor, SA is the surface area of skin exposed to pollutants, SL is the skin adhesion, ABS is the dermal absorption factor, EF is the exposure frequency, ED is the exposure duration, BW is the body weight, and AT is the average time for non-carcinogens or carcinogens [23]. The unit conversion factor is represented by CF.
(2) Health risk characterization model
The health risks associated with heavy metal exposure in the human body are divided into non-carcinogenic risk (HI) and carcinogenic risk (RISK). The formula for assessing non-carcinogenic risk assessment is as follows [22]:
Where HQ, ADD, and RFD represent the non-carcinogenic risk quotient, daily intake of metal, and reference dose of metal, respectively. The RfD values for selected heavy metals in different exposure pathways are provided by USEPA. HQn is the total non-carcinogenic risk value of a single heavy metal superimposed by the above exposure pathways, while HI is a comprehensive evaluation of the total non-carcinogenic risk from multiple exposure pathways of multiple heavy metals. When HQ or HI is less than 1.00, there is considered to be no significant health risk to the human body. Conversely, when HQ or HI is greater than 1.00, there is a non-carcinogenic risk to the human body.
The danger to human health from exposure to heavy metal contamination was quantified by calculating a carcinogenic risk factor (RISK):
Where ADD is the chronic daily intake (mg/kg/d) and SF is the carcinogenicity slope factor [24]. Lower RI values indicate safer conditions. Values of RI between 1E-06 and 1E-04 indicate an acceptable degree of carcinogenic risk. However, RI values greater than 1E-04 indicate environments posing a carcinogenic risk for human beings [25].
Edible Safety Evaluation Methods
The safety evaluation of vegetable consumption utilizes the Target Hazard Quotient (THQ) method released by the US EPA (2000). This method assesses food safety by comparing the absorbed dose of contaminants to the intake dose, calculated by dividing the human intake dose of contaminants by its reference dose. If THQ is less than or equal to 1, it indicates no significant health risk in the exposed population. If THQ is greater than 1, there is a health risk, with a higher THQ value indicating a more serious risk to human health from that pollutant. Similarly, if the Total THQ (TTHQ) is less than or equal to 1, it indicates no potential health effects, while TTHQ greater than 1 indicates a high probability of negative effects on human health. When TTHQ exceeds 10.0, it indicates the presence of chronic toxic effects.
The formula for calculating the health risk of a single heavy metal is as follows [26]:
where EF is the exposure frequency (350 days/year); ED is the exposure duration (70 yrs) [27]; FIR is the food ingestion rate (vegetable consumption values for adults and children are 301.0 and 231.5 g/person/day, respectively); C is the metal concentration in the edible parts of vegetables (mg/kg); RFD is the oral reference dose (Pb, Cd, Cu, Cr, Ni, and Zn values were 0.004, 0.001, 0.040, 0.003, 0.002, and 0.300 mg/kg/day, respectively) [26, 28]; WAB is the average body weight (55.9 kg for adults and 32.7 kg for children); and ATn is the averaged exposure time [29].
Where EF represents the exposure frequency (350 days/year) [25], ED is the exposure duration (70 yrs), FIR is the food ingestion rate, C is the metal concentration in the edible parts of vegetables, RfD is the oral reference dose, and WAB is the average body weight. ATn represents the averaged exposure time [29, 30].
The formula for calculating the health risk of a multiple heavy metal is as follows:
Results and Discussion
Statistical Analysis of the Heavy Metal Content in Slag and Crop Rhizosphere Soils
The descriptive statistics of the heavy metal contents in the slag and crop rhizosphere soils are presented in Table 1. It is evident that the mean contents of six heavy metals in the waste slag and crop rhizosphere soil all exceeded the background values of Guizhou Province. Notably, Cd, Pb, and Zn were identified as severe pollutants, with their mean contents far exceeding the background values of Guizhou Province and the screening values of soil pollution risk of agricultural land in China’s National Soil Quality Standard (GB15618-2018). Consistent with the previous studies, the concentration of heavy metals in the soil near mining and smelting sites of metal mines is typically high, primarily attributed to mining activities and improper disposal of slag, resulting in heavy metal levels in the soil exceeding regulatory standards [31–33]. Furthermore, in comparison to waste slag, the concentration of heavy metals in crop rhizosphere soil exhibited significant variability, with the maximum contents of Pb and Zn being 18.9 and 24.4 times the minimum, respectively. This could be attributed to variations in the accumulation of heavy metals in the soil by different crops.
Table 1.
Heavy metal content in waste slag and crop rhizosphere soil (mg·kg-1).
Evaluation of Heavy Metal Pollution in Crop Rhizosphere Soil
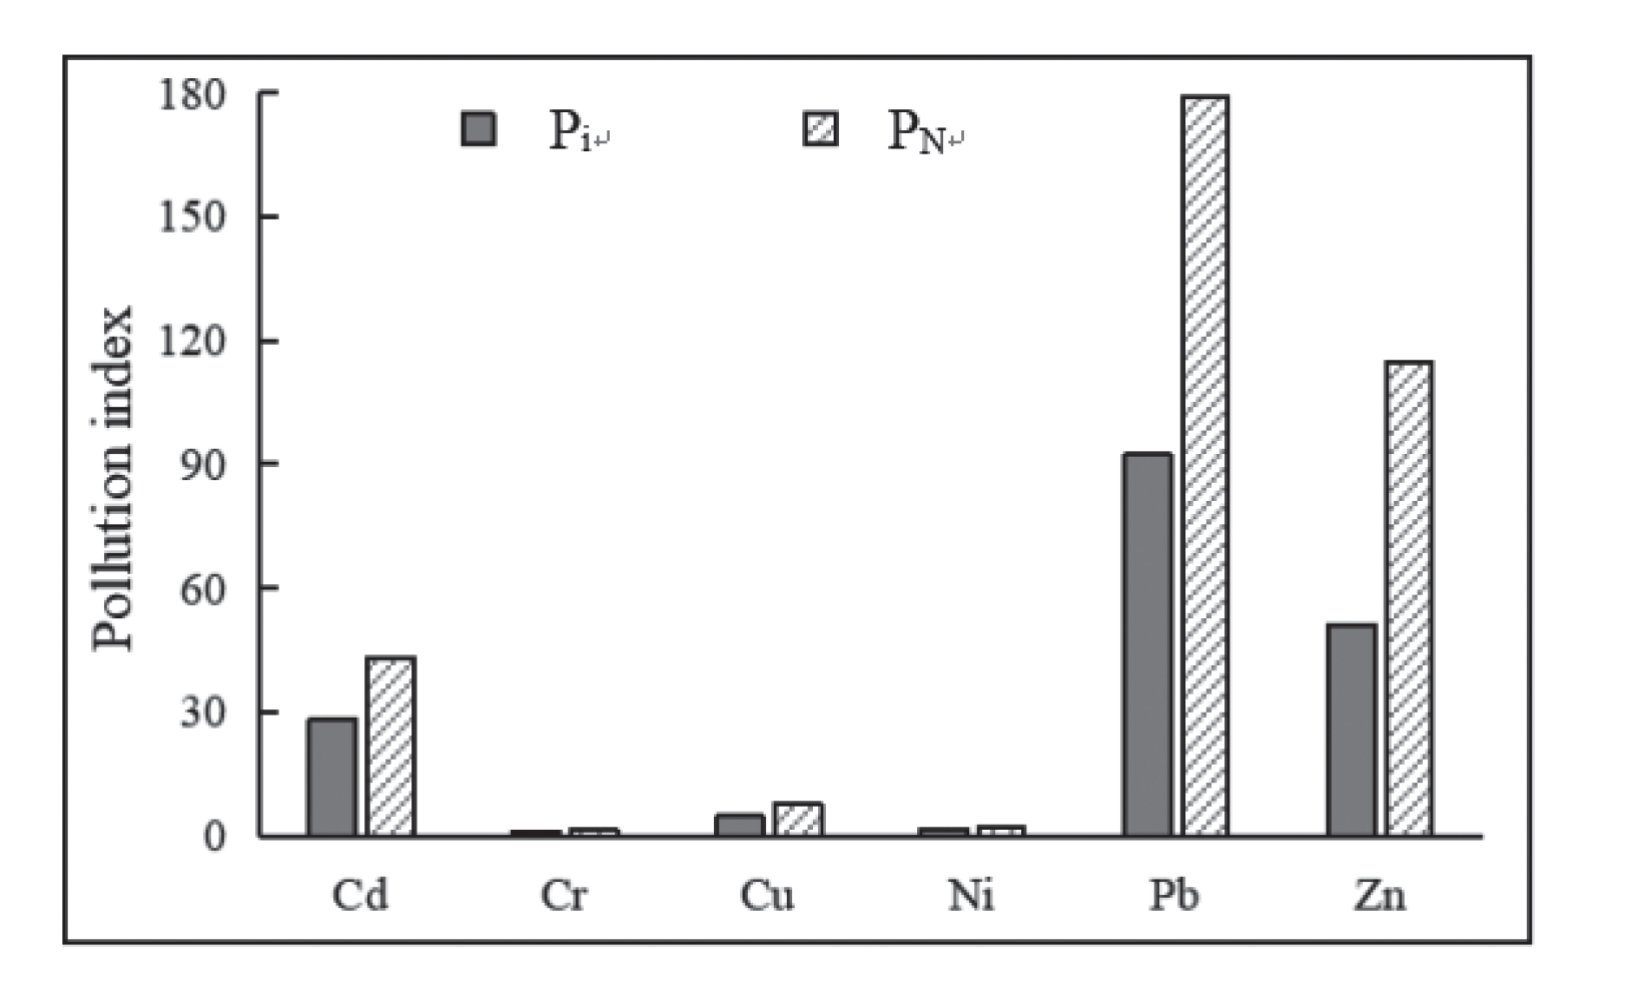
The average single pollution index and Nemerow comprehensive pollution index of each heavy metal element in the crop rhizosphere soil are depicted in Fig. 2. The results demonstrate that the rhizosphere soil of the crops was contaminated by heavy metals to varying degrees. The average single pollution index of each metal element exceeded 1, with the pollution index ranking as follows: Pb (92.4) > Zn (51.1) > Cd (28.2) > Cu (4.7) > Ni (1.6) > Cr (1.2). This indicates that Pb, Zn, Cd, and Cu are considered heavy pollutants, while Ni and Cr are categorized as light pollutants. The comprehensive pollution index revealed that the pollution levels of Pb, Zn, Cd, and Cu were severe, with composite index values of 179.0, 114.9, 43.4, and 7.8, respectively. In contrast, Ni and Cr were identified as moderate and light pollutants, respectively. The results of both the single pollution index and comprehensive pollution index were consistent, indicating that the crop rhizosphere soil in this region is heavily polluted with Pb, Zn, Cd, and Cu, while Ni and Cr show lower levels of pollution. It is imperative for government authorities to take necessary measures to control the pollution.
Table 2.
Human health risk index of different exposure paths of waste slag.
Table 3.
Heavy metal contents and pollution index of crops.
Human Health Risk Assessment of Waste Slag
The total non-carcinogenic risk HIs for each heavy metal multi-exposure pathway in waste slag were 28.89 and 16.81 for children and adults, respectively, significantly exceeding the critical values. This indicates a substantial non-carcinogenic health risk, with a higher non-carcinogenic risk for children than for adults (Table 2). It is therefore recommended that local people, particularly teachers and students in nearby primary schools, should avoid prolonged exposure to this environment, and corresponding preventive measures should be implemented. The non-carcinogenic risks resulting from different exposure pathways varied significantly, with hand-oral ingestion being a more frequent route for children, while dermal ingestion was more common for adults. The order of non-carcinogenic risk was Pb > Cr > Zn > Cd > Cu > Ni in children and Pb > Cd > Cr > Zn > Cu > Ni in adults. Specifically, Pb was identified as the primary non-carcinogenic risk-contributing element, accounting for 95.9% and 96.7% of the total risk values for children and adults, respectively, with other elements posing risks within acceptable limits.
Regarding the carcinogenic risk index, the ranking of the four carcinogenic heavy metals in soil for both children and adults was as follows: Pb > Cr > Cd > Ni. The carcinogenic risk index of Pb for adults fell between 10-6 and 10-4, indicating a low carcinogenic risk within an acceptable range. The carcinogenic risk index of the other three elements for children and adults was less than 10-6, indicating no significant carcinogenic risk to the human body.
Table 4.
Health risks of heavy metals ingestion in slag heap crops.
Statistical Analysis and Evaluation of the Heavy Metal Content in Crops
The heavy metal contents in the crop products collected in this study ranged as follows: Cd 0.04–2.42 mg∙kg-1, Cr 0.36–3.47 mg∙kg-1, Cu 0.35–9.89 mg∙kg-1, Pb 0.57–13.77 mg∙kg-1, and Zn 6.94–79.37mg∙kg-1 (Table 3). These values were compared to the standard limit values for Cd, Cr, Cu, Pb, and Zn, and individual contamination indexes and comprehensive contamination indexes for each crop were determined according to the National Food Safety Standard Limits of Contaminants in Food (GB-2762- 2017) and the relevant national food safety limit health standards for zinc in food (GB13106-91) and copper in food (GB15199-94). As there is currently no standard limit for Ni in food or agricultural products, and the content of Ni in the measured crops is generally low, the crop pollution assessment does not include this element.
As shown in Table 3, the average individual pollution index ranking is Pb (23.84) > Cd (4.59) > Cr (1.45) > Zn (1.00) > Cu (0.17). The single contamination index of Pb for all crops was >1. These findings suggest that agricultural products in the vicinity of the slag heap are notably impacted by the contaminated soil environment, aligning with previous research [34-37]. Notably, rape recorded the highest value of 68.87, followed by Chinese cabbage at 60.53. The analysis revealed that Pb was the primary pollutant affecting crops in this area, posing the highest risk to rapeseed and four-season cabbage.
The comprehensive pollution index indicates that the pollution index of most crops is greater than 3, indicating a severe degree of pollution. Rape had the highest pollution index (50.16), followed by Chinese cabbage, while corn grains exhibited a relatively low level of heavy metal pollution. Consistent with the findings of the single pollution index, the results suggest that crops in this area are either slightly polluted or above the threshold for heavy metals. Similar to the research by Hu et al. [38], the present study demonstrates that different crops possess varying capacities for accumulating heavy metals, with rape and four-season cabbage exhibiting a stronger propensity for accumulation. Cultivating rape and four-season cabbage in this region poses a higher health risk to humans, whereas cultivating corn carries a relatively lower health risk.
Food Safety Evaluation of Agricultural Crops
Among the 13 crop samples, the composite risk index of heavy metal elements ranged from 3.67 to 44.55 for children and 1.26 to 33.93 for adults, indicating a higher risk of heavy metals in crops (Table 4). The health risk value of Pb pollution was generally high, being the largest contributor to the composite risk index, followed by Cd and Cr. The health risk value of Cu and Zn was relatively low. The risk index for children was higher than that for adults for all crops, indicating that crops contaminated with heavy metals are more likely to pose health risks to children.
Looking at specific crop varieties, the comprehensive risk indexes of radish leaf, rape, Chinese cabbage, and cabbage for both children and adults were all greater than 10, indicating that consumption of these crops could lead to chronic toxicity. The composite risk index of rape contaminated by heavy metals was the highest, followed by leafy greens such as Chinese cabbage, cabbage, flowering cabbage, and radish leaves, while that for corn grains was relatively lower.
Therefore, from the perspective of food safety, the consumption of crops grown in slag heap soil could pose a health threat to human beings, especially children, with chronic toxic effects. Until the contaminated soil is effectively controlled, it is not recommended to grow crops for agricultural use at the site. It is suggested that relevant departments should control and reasonably manage the land parcel to reduce the risk of harm to local residents.
Evaluation of Heavy Metal Pollution in Corn and Soil at Different Distances from the Slag Heap
The heavy metal contents of the soil and corn grain samples collected at various distances (0–150 m) from the slag heap were determined and analyzed (Fig. 3a and 3b). However, even at 150 m, the contents of Cd, Pb, and Zn in the soil still exceeded the national soil environmental quality standard value, and the content of Pb in the corn grains also exceeded the standard limit. The results reveal that Cd, Pb, and Zn are the primary pollutants originating from the slag heap in this area, mirroring the risk assessment findings of the majority of lead-zinc mining regions where combined pollution of Cd, Pb, and Zn are the main pollutants [32, 39].
The heavy metal pollution status of corn at various distances from the slag heap was assessed, taking into consideration the standard limits for various heavy metals in food (Fig. 4). The corn within 0–30 m of the slag heap was classified as severely polluted, while the pollution degree was moderate at 100 m. Analysis of the heavy metal pollution index of the farmland soil at each sample point revealed that the soil’s pollution index was significantly higher than that of the corn at the same point. At a distance of 150 m from the slag, the individual pollution indexes of Cd, Pb, and Zn were recorded as 10.82, 16.66, and 14.81, respectively, with a combined pollution index of 18.11, indicating extremely heavy pollution (Table 5). The results showed that corn had a weak ability to enrich heavy metals, but still had a high safety risk. Therefore, eating corn within 150 m from the slag heap still posed a high health risk to human health.
Edible Safety Evaluation of Corn at Different Distances from the Slag Heap
As the distance from the slag heap increased, the health risk index of heavy metals in corn grains gradually decreased (Fig. 5). However, at 150 m, the TTHQ values for children and adults remained greater than 1, indicating that consuming corn grown on farmland soils within 150 m of the slag heap poses a health risk to humans. In terms of specific elements, Cr had the highest health risk index value, followed by Cd and Pb. Conversely, the THQ values for Cu and Zn were less than 1, indicating that these elements do not pose a health risk to adults.
Fig. 3.
Heavy metal contents in farmland soil (a) and corn (b) at different distances from slag heap (In the figure, the contents of Cd, Cr, Cu in soil and corn, and Pb in corn are multiplied by 10 times).
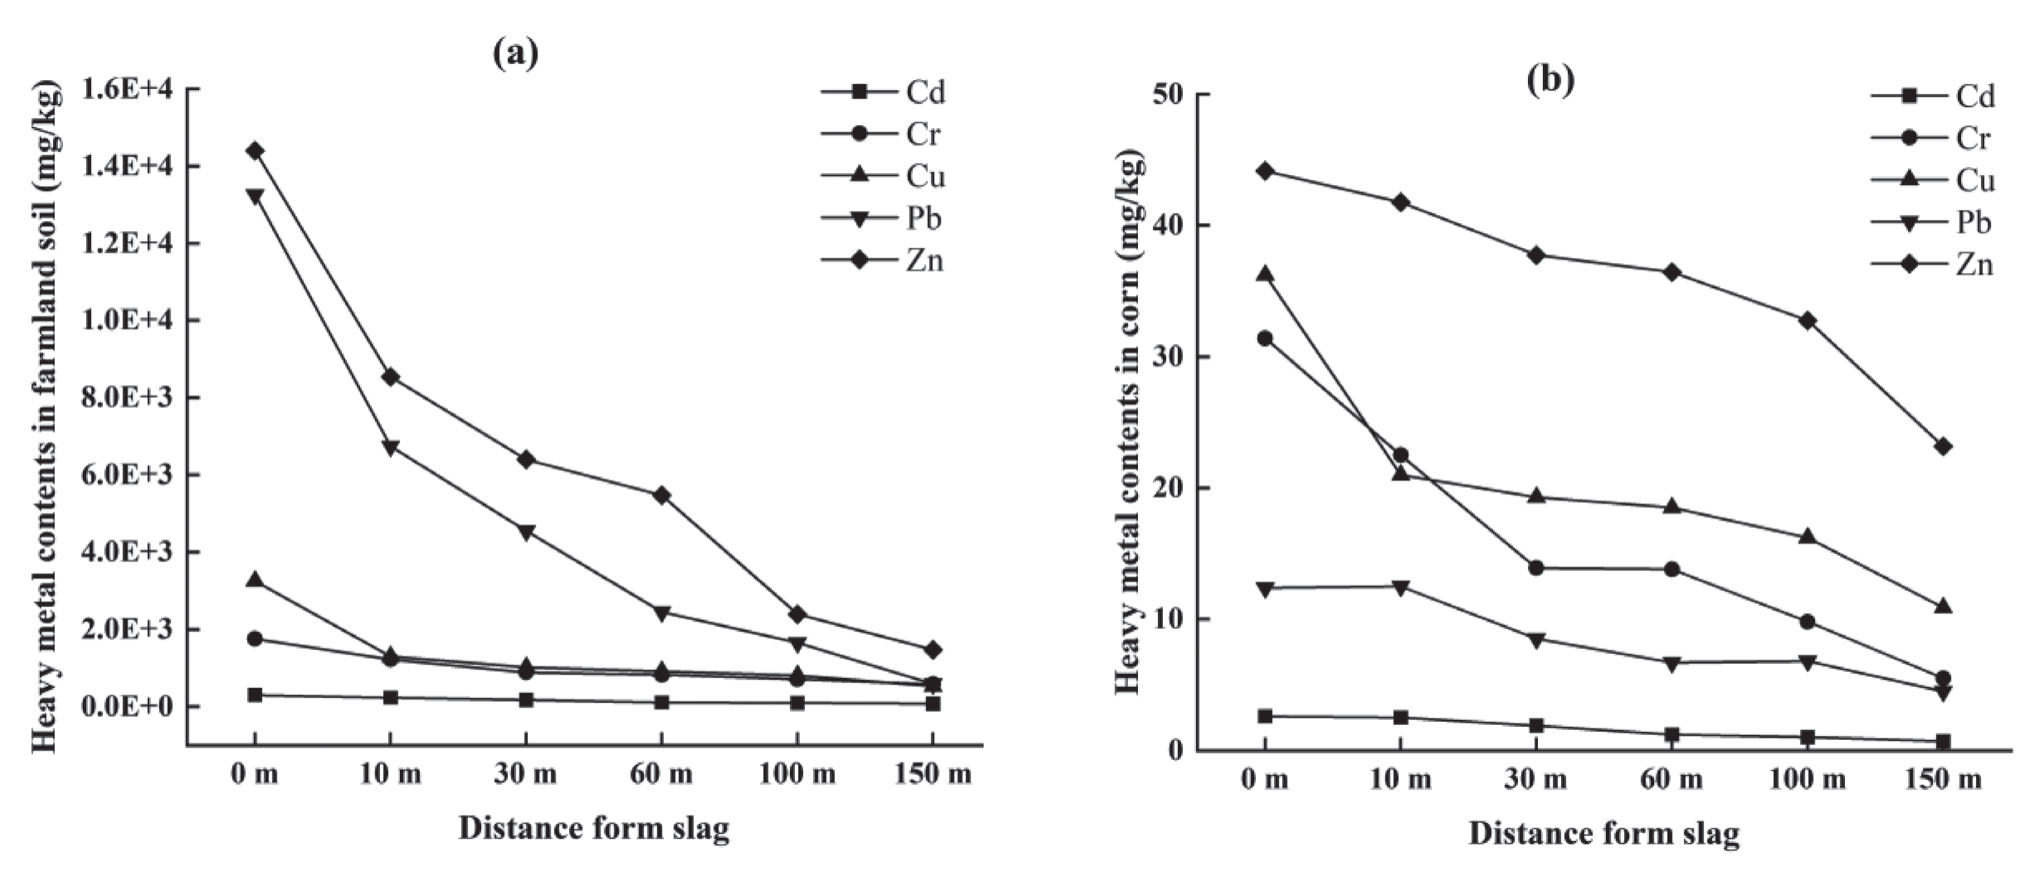
Table 5.
Evaluation of heavy metal pollution in farmland soil at different distances from the slag heap.
Fig. 4.
Heavy metal pollution index of corn at different distances from slag heap, Pi(a), and PN (b).
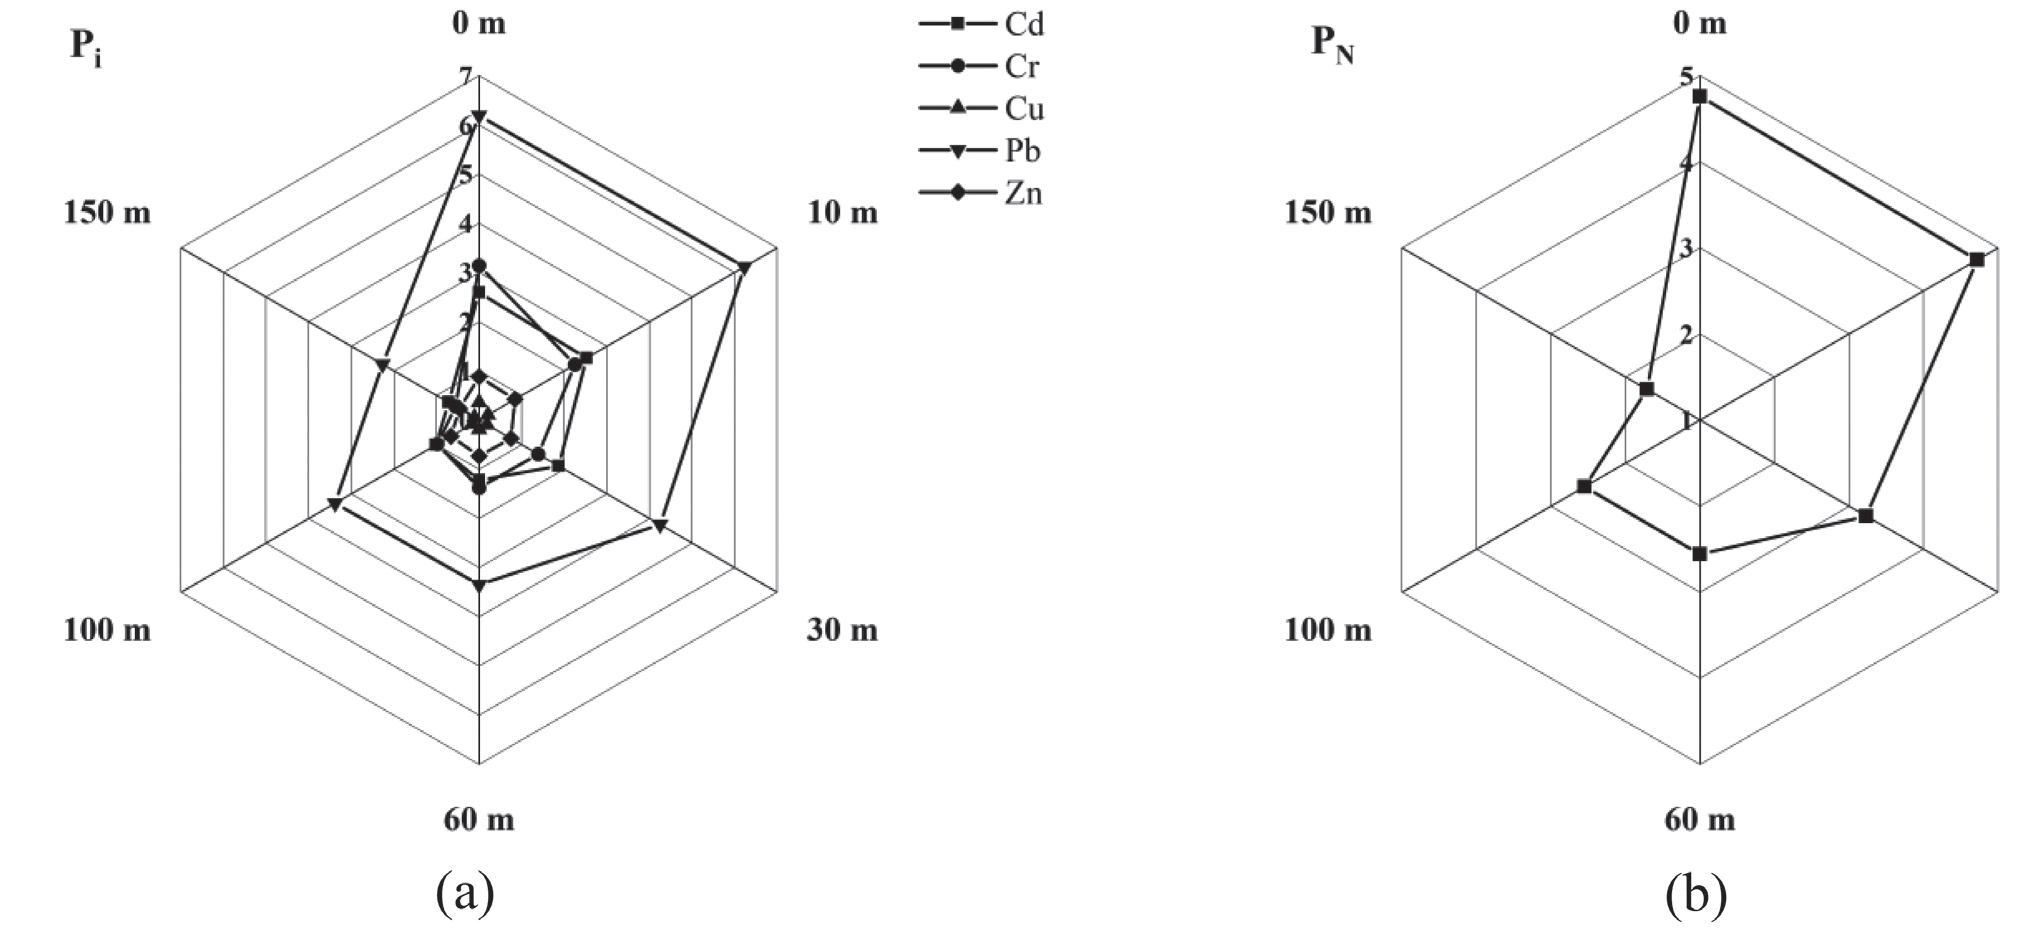
Fig. 5.
THQ values for children (a), adults (b), and TTHQ values (c) of heavy metal intake from corn at different distances from the slag heap.
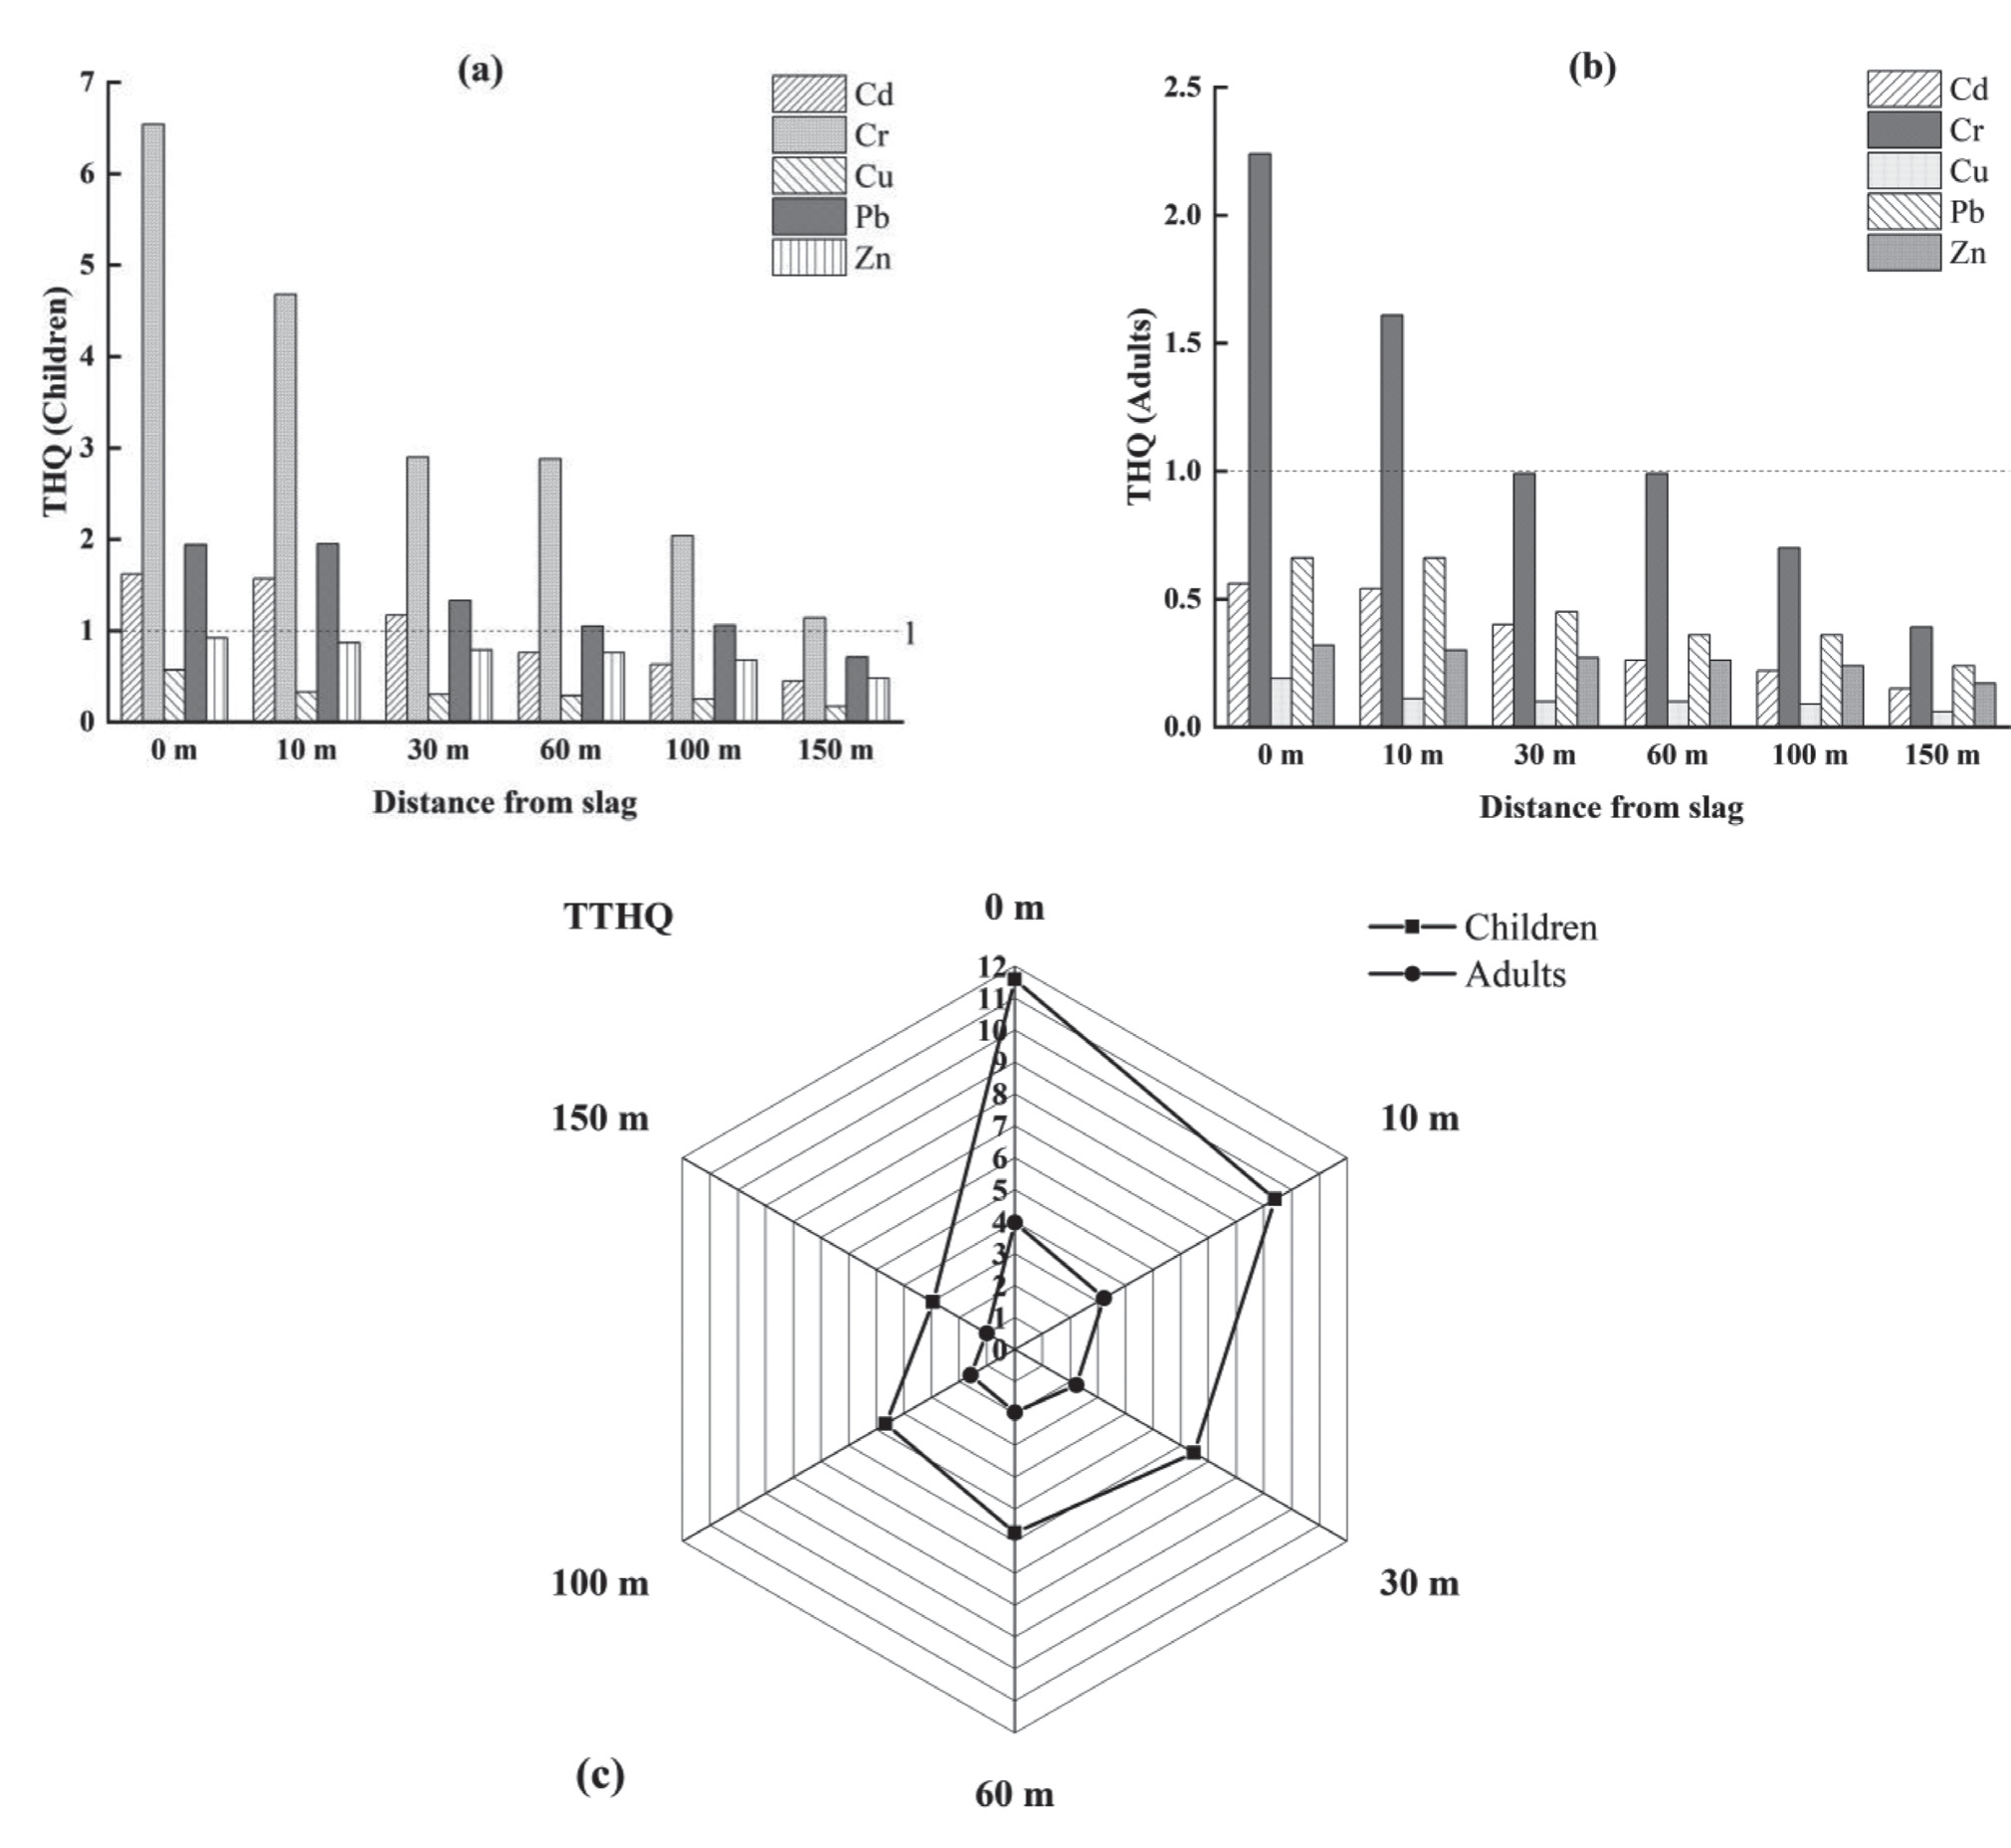
Comparing the TTHQ value for children with that for adults, it is evident that the health risks for children caused by local corn intake are higher than those for adults. A comprehensive health risk assessment of various heavy metals reveals that the TTHQ value for children is close to 10 at 10 m, indicating that corn planted in a 10 m area poses significant health risks to children and can cause chronic poisoning.
Conclusion 1. The indigenous zinc refining waste typically contains high levels of heavy metals, with severe contamination of Cd, Pb, and Zn. The non-carcinogenic risk for children and adults exposed to the environment in the area by each pollutant is 28.89 and 16.81, respectively, both of which are unacceptable risks. The primary non-carcinogenic risk-contributing element is Pb, while the carcinogenic risk of heavy metals is within the acceptable range. The surrounding arable land is polluted by a combination of heavy metals, with Pb pollution being particularly prominent, followed by Zn, Cd, and Cu, all of which exhibit heavy pollution.
2. The average single heavy metal contamination index of crops grown in the soils of the smelting waste
margins was ranked as Pb > Cd > Cr > Zn > Cu, with
most crops exhibiting a contamination index greater
than 3, indicating heavy contamination. Specifically,
the heavy metal pollution indexes of rape and Chinese
cabbage were higher, while the pollution index of corn
grains was relatively lower. In terms of crop-related
human health risks, all crops displayed health risk index
values greater than 1 for both adults and children, with
higher health risks for children compared to adults.
3. In the large corn fields located south of the slag heap, the heavy metal content in the soil and corn grains decreased as the distance from the slag heap increased. However, at 150 m away from the slag heap, the levels of Cd, Pb, and Zn in the farmland soil still significantly exceeded the national standard value for soil environmental quality, indicating severe pollution. Consequently, consuming corn from this area can still pose health risks to humans.

