


Introduction
Worldwide, maize (Zea mays L.) ranks top among cereals in terms of total cultivated area [1] and grain production, especially in Turkey. Recently, it has become a crop of immense economic pertinence for being a constituent of staple food, feed for ruminants, and raw material for fermentation to produce a wide array of industrial products. In addition, maize grains contain an abundant concentration of starch (65-73%), and its wet milling yields industrial starch (sweeteners, value-added starch, etc.) that is utilized in preparing textile wrap, paper lamination, and laundry finishing. Moreover, dry-milled products of maize include breakfast food like porridge, along with many value-added brewing and animal feed products. Furthermore, maize demand has increased tremendously over time because its kernels are being used to extract edible oil and prepare numerous food additives and pharmaceutical products [2, 3]. Nevertheless, maize yield remains suboptimal owing to poor plant nutrition management [4, 5]. Recently, the deficiency of micronutrients has been attributed to the lower grain yield of maize under the Mediterranean climate [6-8]. Although maize requires a minute concentration of micronutrients, its deficiency tends to impart adverse effects on the growth and nutritional quality of maize grains [9, 10].
Among micronutrients, boron (B) is a key micronutrient that promotes plant growth and reproduction by triggering carbohydrate metabolism and translocation [11]. It also enhances cell formation, maintains the integrity of plasma membranes, triggers pollen tube growth, and induces robust pollination through pollen tube development and seed formation of cereals [12, 13]. The optimum availability of B promotes meristematic growth, cross-links molecules of cellulose in the cell wall, and serves as a precursor to activate enzymes in a cell membrane through the incorporation of diol-containing groups. Furthermore, B is regarded as a prerequisite for rhamnogalacturonan and pectin assembly, which contribute to the strengthening of the cell wall. Moreover, suboptimal B availability leads to disruption of assimilates translocation rate, and thus yield and quality of crops deteriorate. Also, a deficiency of B declines the biosynthesis of indole acetic acid and cytokinin, which reduces the nutritional value of the grain. There exists a narrow range between toxicity and deficiency levels of B in plant tissues and soil, and therefore its dose needs to be optimized for promoting plant growth while avoiding toxicity. Every fertilizer treatment has its various advantages and few disadvantages [14], nevertheless, foliar and soil application methods have been most widely used to rectify B deficiency.
The foliar spray of B as boric acid (H3BO3) has been found superior in maize compared to soil application for curing B deficiency [6, 15]. Additionally, foliage B application remained superior in terms of efficacy under dry conditions owing to the restricted absorption of B by plant roots in dry soils [16]. For achieving the potential nutritive quality of maize grains, B application in optimized concentration holds bright perspectives as an effective and eco-friendly approach [17]. Previously, the B toxicity level for maize has been reported to be 100 mg kg-1 dry weight [18]. Moreover, B relationships with other micronutrients are critical for determining its optimum dose under various pedo-climatic conditions [17]. The B uptake by maize plants is influenced by the concentrations of other micronutrients in the soil solution [18]. This fact gives the hint that the relationships between micronutrients can be potentially used to boost B uptake under B-deficient conditions. Additionally, it becomes equally important to study the impact of B application on nitrogen (N), potassium (K), calcium (Ca), and zinc (Zn) uptake. Numerous contrasting studies have reported antagonistic and synergistic influences of soil and foliar applied B on various macronutrient uptake [6, 19]. However, there is a huge research gap regarding the impact of B uptake on micronutrient concentrations in maize grains, which needs more field investigations.
The effect of micronutrients, including B, varies widely concerning crops, varieties, application methods, doses, soil content, and agro-climatic conditions. Even though B deficiency rectification studies have been conducted for a long time, research about the effects of B on the nutritive value of maize is only relatively few but also reports contrasting findings. There has been, however, little information reported on the boron requirements for maize in Turkey. At present, information is scant about pedo-foliar applied B effects on the quality traits of maize. This fact becomes even more important for micronutrients like B having residual effects on subsequent crops. These aspects need to be confirmed by on-farm research trials to assess the impact of soil and foliar applied B on maize. Therefore, in this context, the present study was focused on evaluating the effect of soil and foliage applied B for improving the nutritional quality of maize under Mediterranean conditions.
Experimental
Site Description
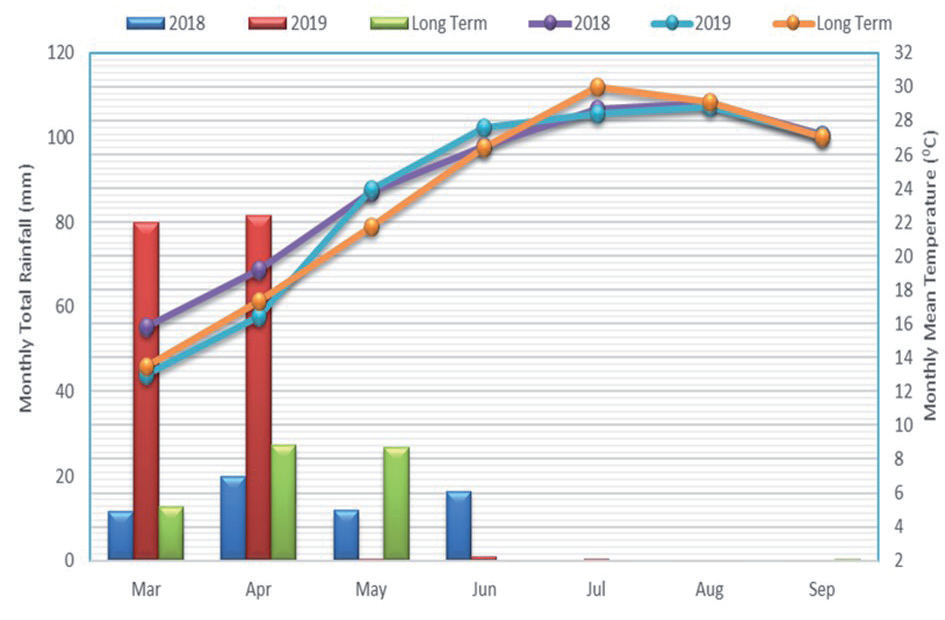
For investigating maize response to the application of B as foliar and basal dose, a trial was conducted at the Agronomic Research Area, Hatay Mustafa Kemal University, in Hatay (Mediterranean agro-climatic condition) of Turkey (36°15’N and 36°30’). The trial was executed during two consecutive seasons, i.e., 2018 and 2019. The trial’s locality has a typical Mediterranean climate with a hot dry summer and a mild-rainy winter (Fig. 1). The soil of the experimental site was tested, and its pH was 7.68-7.72, whereas total salt contents were 0.035-0.037%. Likewise, clay, sand, and silt contents were 27.20-27.22%, 43.96-44.00%, and 28.80-28.82%, respectively. Moreover, lime and organic matter contents were 27.60-29.80% and 1.08-1.12%, respectively, while CEC content remained between 19.62-19.76 me 100 g-1 and the available boron contents between 0.51-0.57 mg kg-1. Before sowing in April 2018, the land was fertilized with 80 kg ha-1 of N, P2O5, and K2O each. The seeds were sown on 30th March 2018 and 14th May 2019 maintaining 5 m long 4 rows with 70 cm row distance. Fertilizers were applied as basal doses during sowing (80 kg N, P2O5, and K2O ha-1 (Nitrophos or NPK 15-15-15). Urea (184 kg ha-1) was applied as top-dressing at the V6 stage of maize (25 April 2018 and 10 June 2019).
Field Study and Data Collection
Performer maize variety was used as planting material, which was obtained from Syngenta Seed Company. All the agronomic practices were performed uniformly except those under investigation. Throughout the plant growing period, adequate plant protection measures were taken to avoid yield loss due to weeds and pests. In the experiments, weeds were controlled by hand and harrowing. Pests were not used in the experiments in both years. Harvest was made by hand-picking on 30th August 2018 and 2nd September 2019.
Experimental Design and Treatments
Field experiments were laid out in a split-plot design with three replicates in both years. The treatments included five levels of boron, viz., 0, 3000, 6000, 9000, and 12000 g ha-1, that were applied in the soil as main plot treatments before seed germination, and foliage applied B had three levels, including 0, 3000, and 6000 g ha-1 B that were sprayed on foliage as sub-plot treatments at the V8 growing stage (eight leaves with visible collars). Di-sodium octaborax tetrahydrate (Na2B8O13.4H2O) was used as a source of soil-applied B, whereas disodium octaborate tetrahydrate [ETIDOT-67 (Na2B8O13.4H2O)] was used as foliage applied B that were collected from Eti Mine Works General Directorate, Ankara, Turkey. All agronomic management practices were performed as per recommendation and as necessary. The crop was harvested on 30 July 2018 and 2 September 2019.
Data Collection
For chemical analysis, maize kernels were ground in a mill by passing through a 1 mm sieve. Starch, protein, and fat analysis were determined according to the NIR Perten DA 7250 (Near Infrared Reflactometer) procedure. Mineral elements like phosphorus (P), potassium (K), sulfur (S), magnesium (Mg), calcium (Ca), zinc (Zn), manganese (Mn), copper (Cu), iron (Fe), and boron (B) were determined in grain according to standard protocols. A metal-free agate vibrating cup mill (Pulverisette 9, Fritsch GmbH, Germany) was used to grind the grain samples, and acid digestion was performed in 2 mL of H2O2 (30%) and 5 mL of HNO3 (70%) with the help of a closed-vessel type microwave reaction system (Mars Express, CEM Corp., Matthews, NC, USA). The digested samples were thereafter diluted to 20 mL by pouring ultrapure (18.2 MΩ) water, and subsequently, an inductively coupled plasma optical emission spectrometer (Vista-Pro Axial, Varian Pty Ltd., Mulgrave, Australia) was used for measuring the mineral concentrations.
Statistical Analysis
All the recorded data were subjected to statistical analysis by using the MSTAT-C package of Michigan State University, USA, and two-way analysis of variance (ANOVA) was done by using the same computer software program [20]. The ANOVA was a Randomized Complete Block in a split-plot design with five main plot treatments (soil boron treatments) and three sub-plot treatments (foliar boron treatments) for traits replicated three times. The differences among different treatment means were separated by using the LSD (least significant difference) test at the probability level of p≤0.05.
Results and Discussion
Protein Contents
Soil applied B had a positive effect on all the quality parameters of maize (Table 1). The protein content (g ha-1) was significantly influenced by the soil application of B in 2019, but the values were higher in 2018. However, the maximum protein content (9.12 g ha- 1) was recorded with 3000 g ha-1 of B application in 2018. Foliar application of B also imparted positive effects on the protein content of maize, as the foliage application of B with 6000 g ha-1 remained the highest performer during 2018, while all foliage-applied B doses remained non-significant during 2019 (Table 1). These findings are in line with previously reported results whereby B application significantly improved the nutritional quality of cereals [21]. It was found that the influence of B application rates on the nutritional quality of cereal crops inferred that B increased protein content in the grain and stover of mustard, indicating B’s important role in protein synthesis [19, 22]. In addition, it was inferred that B fertilizer’s solubility and reactivity are crucial factors that affect nutritional quality rather than the dose and application time of B [23]. The increase in protein content by exogenous B application is supported by the findings of Muhammad et al. [24], and mineral fertilization significantly increased the content of protein [9]. Furthermore, B application was attributed to its involvement in enzymatic systems responsible for protein synthesis, which ultimately led to higher protein contents.
Fat Contents
The fat content of maize significantly varied due to different levels of foliage and soil-applied B, and the fat content remained higher in 2018 than in 2019 (Table 1). The maximum fat (4.13 g ha-1) was achieved by soil-applied B (6000 g ha-1); the treatments 3000 and 9000 g ha-1 performed statistically the same in fat content as 6000 g ha-1 during 2019, while all the treatments remained non-significant during 2018. Contrarily, foliage applied B 3000 g ha-1 remained outstanding B dose while the non-significant variation was recorded for all the foliar treatments during the subsequent season. Our findings of an increase in grain fat content due to the exogenous application of boron follow the conclusions reported by Oyinlola [25], who reported that higher fat content was recorded by exogenous application of B and its deficiency was attributed to a significant reduction in fat content [26]. Moreover, Tahir et al. [27] inferred that B application (3000 g ha-1) through foliar means improved the fat content of maize due to its involvement in enzymatic reactions, which triggered fat synthesis.
Starch Contents
Significant variation of starch was observed by soil-applied B in both seasons (Table 1). Soil applied B (6000 g ha-1) gave the highest value of starch in the first season, while the highest dose of B (12000 g ha-1) recorded the maximum value in the subsequent season. In 2018, foliage applied B reduced starch content, while 6000 g ha-1 of foliage applied B recorded the highest value in the following year. These findings corroborate with those of Asad et al. [28], who reported that exogenously foliage applied B-triggered starch synthesis along with promoting sugar translocation from sources to sinks, which improved the nutritional value of cereals.
Boron and Calcium Contents
A significant effect of soil and foliar applied B was observed on maize grain B content that was positively improved with increasing doses of B during both seasons (Table 1). The highest doses of B applied in soil (12000 g ha-1) and foliage B (6000 g ha-1) showed the highest B content in maize grain, while the control treatment recorded the minimum B content, and this trend was witnessed during both seasons. These findings are in line with the previously reported conclusion that foliage application of B improved micronutrient status in sunflowers [6, 13]. Furthermore, it was found that B uptake by the crop plants was dependent on B concentration in the soil solution and not on the total B contents in the soil. Moreover, the soil solution’s B concentration was recorded to have a direct association with the B content of maize grains.
Likewise, the calcium content of maize was also significantly influenced by different doses and application techniques of B in both seasons (Table 1). The highest Ca content was recorded with 9000 g ha-1 of soil-applied B and the lowest with the highest level of soil-applied B (12000 g ha-1). As far as foliar applied, it revealed that the 3000 g ha-1 B dose showed the highest Ca content and the lowest was observed in the control treatment. Contradictory results have been by Sotiropoulos et al. [29], who observed that Ca presence in nutrient solution caused a significant decline in B concentration of kiwi and thus found to have a positive influence in alleviating B toxicity. Siddiqui et al. [17] reported that Ca had a strong interactive effect with B content and played a critical role in alleviating B toxicity in radishes. It was suggested to apply B in low doses to boost Ca content. This improvement was attributed to their physiological roles in cell walls and membrane formation. However, higher B content decreased the Ca uptake. Similar findings were reported as higher B reserves in soil decreased B accumulation in the plant; moreover, higher Ca content lowered the soil pH. Soil pH is one of the factors that affect B availability in soil solution [6, 30].
Table 1.
Effect of soil and foliar application of boron on the proteins, fat, starch, B, Ca, Cu, and Fe contents of maize grain.
Copper and Iron Contents
Application of B as soil and foliar spray significantly increased copper (Cu) concentration in maize grain (Table 1). However, the maximum Cu was recorded for 9000 g ha-1 of soil-applied B, which was followed by a 12000 g ha-1 dose during both seasons. The control treatment had the least Cu content in comparison to all treatments. During the first season, the control treatment recorded the highest Cu content remarkably than all doses of foliage applied B, while the B dose of 6000 g ha-1 remained the highest value during the subsequent season. These findings are contradictory to those of Khan et al. [31], who concluded that the foliar application of micronutrients performed better than soil application regarding the micronutrient status of cereal grain.
Similar to calcium content, the iron (Fe) content of maize grain was positively influenced by the B applied through soil or foliar means in varying doses (Table 1). For soil-applied B, the maximum Fe content was recorded at 12000 g ha-1 dose during the first season, while 6000 g ha-1 B soil-applied remained outstanding during the second season. Foliage applied with 6000 g ha-1 B exhibited unmatched values of Fe during both seasons, and the lowest corresponding values were recorded at 0 and 3000 g ha-1 B in 2018 and 2019, respectively. Previously, Bilen et al. [32] have also reported similar findings, as the B application triggered the rate of photosynthetic rate, which was attributed to a higher concentration of Fe in plant leaves.
Potassium
The application of different B levels in soil and foliage means showed a significant variation in the K content of maize grain over the control treatment (Table 2). The maximum K content was noted for B (3000 g ha-1), which was statistically at par with 12000 g ha-1 doses of B in 2018, while the same K content of 0.34 g ha-1 with different levels of B during 2019. Foliar feeding of B showed increasing trends of K during 2018 and decreasing trends in 2019. Krudnak et al. [33] inferred that B application significantly increased the nutritional quality, including macronutrient contents of sunflower achene.
Magnesium and Manganese Contents
Soil, as well as foliar-applied B in different doses, remained ineffective for the Mg content of maize during both seasons (Table 2). These findings are in contradiction with those of Patil et al. [34], who opined that B and Zn co-application could potentially boost the nutritional profile of sunflower grains.
The results indicated significant variations of Mn concentration in maize grain in response to soil and foliage applied B varying levels (Table 2). The highest Mn was obtained from treatment of 12000 g ha-1 B, which was statistically similar to the 9000 g ha-1 dose during the first season, while the maximum value was obtained from 3000 g ha-1 treatment in the second season. Contrarily, foliar application of B (6000 g ha-1) resulted in the highest Mn content in both seasons. Ganie et al. [35] reported that foliar applied B remained effective in boosting the quality of fruits in terms of micro and trace mineral contents.
Table 2.
Effect of soil and foliar application of boron on K, Mg, Mn, P, S, and Zn accumulation content in maize grain.
Table 3.
Interaction effect of soil and foliar applied B on Fe, K, and Mn content of maize kernels.
Table 4.
Interaction between soil and foliar applied B regarding P (g kg-1) and Zn content (g kg-1) of maize kernels in both the years.
Table 5.
Interaction between soil and foliar applied B regarding protein (g kg-1) and fat (g kg-1) content in maize kernels.
Table 6.
Interaction between soil and foliar applied B regarding Fe, K, Mn, and P uptake (g kg-1) in both years.
Phosphorus, Sulfur, and Zinc Contents
Significant variation of P content was observed among the B treatments applied through different modes. However, the highest P content was recorded at 3000, 6000, and 9000 g ha-1 doses of B, while the lowest was at control and 12000 g ha-1 doses of B in 2018. The influence of B on the P content was non-significant in 2019. A non-significant impact of B as the foliage was observed for P content during the first season, but in the subsequent year 6000 g ha-1 was the most effective treatment by recording the highest P content. Boron application led to an increase in the concentration of P in the leaves of jojoba [36]. It was suggested that the 2240 g ha-1 B dose assisted in preventing yield reduction and deterioration of mineral contents in maize, especially when B was applied in conjunction with K fertilizers [17].
The sulfur concentration was not significantly increased by the application methods as well as doses of B during both seasons. Previously, no supplementary or antagonistic impacts of B and S have been reported in maize. Kumar et al. [37] reported the positive role of B in the quality improvement of groundnuts through its involvement in the biosynthesis of protein.
The soil-applied B remained ineffective in terms of the Zn content of maize during both seasons (Table 2). Contrarily, foliar applied B imparted a positive influence on the Zn content, as the 6000 g ha-1 dose showed the highest value, which was statistically similar to the 3000 g ha-1 dose in 2018 and the control treatment in 2019. Faisal et al. [6] reported the simulative impact of micronutrients including B on the nutritional status of sunflowers under temperate conditions in Pakistan and suggested that foliar-applied B can potentially boost the yield and mineral content of crops provided their dose optimization is done keeping in view the B content in soil solution.
Interaction Effect of Soil and Foliar-Applied Boron
The soil and foliar applied B significantly improved the quality parameters of maize grain. The data regarding the interaction of soil and foliar B application about different nutrient concentrations (Fe, K, Mn, P, Zn), as well as the protein and fat content of maize, have been presented in Tables 3, 4, 5, and 6. The recorded findings revealed that the interaction effect between soil and foliar sprayed B was significant for all quality traits under investigation.
Previously, contradictory findings have been reported regarding the antagonistic effects of micronutrients in alleviating B toxicity. It was inferred that P remained effective in lowering the B deleterious effects by suppressing B absorption [38]. Ali et al. [1] recorded that soil and foliar applied B had positive effects on leaf P concentration. It was also observed that B application significantly improved B, N, P, K, and Na contents, whereas \ Ca and Mg contents significantly declined, as reported by Bhupenchandra et al. [39]. The application of B also promotes the absorption of N and improves the yield parameters of peanuts [40]. However, increasing doses of macronutrients, especially K doses, imparted an antagonistic effect on the uptake of B by maize, which reduced the B content of grains. Besides, researchers have also related the K effect on B toxicity or deficiency in the context of K influence on cell permeability, which primarily gets regulated by B [6, 41-43]. However, the B application imparted non-significant differences in the concentration of B in grain legumes. Contrastingly, cereals tend to show sharp differences in micronutrient concentration of grain in response to B application [44-46].
Conclusions
This multi-year field trial was executed to assess the impact of soil and foliage-applied boron on the nutritional quality traits of maize grains under Mediterranean conditions in Turkey. The findings of our experiment were in line with the postulated hypothesis, as foliar and soil application of B remained effective in boosting the mineral contents of maize grains. The results revealed that B application by both means (soil and foliar) increased the quality traits of maize grain over the control. For most of the response variables, the maximum values were recorded by soil-applied B (9000 g ha-1). Regarding the quality traits, it became clear that foliar application of 6000 B g ha-1 was congenial for boosting maize grains’ nutritional value. Thus, based on recorded findings, it could be recommended to apply soil and foliage applied B (9000 and 6000 g ha-1, respectively) to achieve high-quality maize grains (especially starch, P, K, Ca, B, Cu, and Fe content) under Mediterranean agro-climatic conditions. However, other sources and doses of B along with the stage of crop plants need to be investigated to develop B application as an effective strategy to boost the nutritional quality of maize, leading to alleviating malnutrition globally.

