

Introduction
Irrigation seems to hold an irrevocable position in providing safety for world food in the arid and semi-arid production zones due to the ongoing damages caused by contemporary climate change effects on natural resources. However, after several years of irrigation, soil salinity may grow into a significant issue. Secondary salinization refers to soil salinity caused by human activities such as irrigated agriculture, which is a severe challenge to sustainable irrigated agricultural production, with estimates of 20% of irrigated land worldwide suffering from secondary salinization [1-3]. The degradation of soil caused by secondary salinity is enhanced when coupled with insufficient drainage. In this respect, there is a need to quantify the spatial distribution of salinity at the farm level in order to recognize its extent and determine the most effective soil, water, and crop management programs for restoring agricultural productivity [4]. Increased soil salinity reduces crop, pasture, and tree yields and ultimately enhances desertification in arid and semi-arid environments. Thus, rapid, reliable, and cost-efficient mapping by electromagnetic (EM) bulk salinity assessment has become a prominent issue in intensely cultivated areas with soil salinity as the limiting factor and is preferred to the time-consuming and expensive soil analysis for periodic monitoring [5]. This is a useful technique that enables the monitoring of apparent soil electrical conductivity (ECa) by creating an electrical current in the soil [6], consequently processing it into an output voltage, and evoking an electromagnetic field linearly related to depth-weighted soil apparent salinity [7]. Although it does not require a radioactive source, the EM approach is more secure than other monitoring methods [8], which quickly and accurately measure the field apparent soil conductivity for selected points [9]. The over-ground horizontal (ECah) and vertical (ECav) positioned devices represent the 1 and 2-meter depths of the soil profile, respectively. Moreover, measurements generated via the EM38 actually stand for the apparent salinity and the correctly calibrated standard soil extract salinity [9].
According to Ratshiedana et al. [6] and Padhi and Misra [8], the use of the EM38 in the field to determine the ECa is an attractive and precise agriculture technique. Çetin et al. [9] and Kaman et al. [1] have also reported that this method produces reliable estimates for extensive soil salinity surveys without requiring the collection of a large number of soil samples. Kachanoski et al. [10, 11] had earlier stated that the spatial fluctuation of the water content within the upper 0.5 and 1.7 m of the soil profile was substantially correlated with fluctuations in bulk soil electrical conductivity as measured by the EM38. In this regard, the EM38 methodology is extensively used for a variety of aims, namely for vertical and horizontal salinity in the soil as well as leaching, salt buildup, and water content changes versus crop yields [9, 12-19]. Nevertheless, sodicity [20, 21], acidity [22], moisture monitoring [23], variations of texture and compaction along a soil pedon [24-27], and finally improving soil maps [28] are the other relevant fields of application for the EM38 methodology. In conclusion, regional studies of particular significance with environmental implications and ecosystem services are needed in order to improve the implementation of the EM38 methodology and adapt to the above-mentioned conditions.
Turkey has very good climatic and ecological conditions, which increase the potential for the production of numerous fruits, particularly citrus. In the 2020–21 production season, Brazil (34%), China (15%), the EU (13%), and the USA (8%) are expected to produce most of the citrus crops globally. Turkey is the eighth-largest producer of oranges in the world, with 1.4 million tons produced annually [29]. The Mediterranean Coast, where the Mediterranean Exporter Unions are based and where 80% of Turkey’s citrus fruit is cultivated, takes a significant position in Turkey’s fresh fruit exportations. In this context, irrigation, soil salinity, and aeration of the root zone are the crucial components of commercial production in most citrus-producing regions across the world, especially in the Mediterranean part of Turkey. Sufficient soil moisture levels are essential for optimal fruit growth and yield. High soil water contents due to excess irrigation cause the buildup of soil salinity and, thus, negatively affect crop yields, degrade the land, and pollute the groundwater. In this context, there are effective approaches to dealing with problems such as salinity, direct precipitation, and excess irrigation applications around the trunks and within the root zones necessitating optimal aeration management in farming practices. Ridge planting is becoming increasingly popular among Mediterranean orchard farmers, and it is a frequently used practice [30]. There have been some contradicting comments about the benefits of ridge planting among researchers, but farmers currently prefer to apply this technique. One of the primary reasons that some farmers are engaged in ridge farming systems is that the ridge fields canalize enhanced water flows into the furrow area, which subsequently functions as an infiltration zone [30]. This leads to more efficient irrigation water use and increased crop yield while avoiding salinity and water logging [31-34]. The reduction of soil compaction caused by machinary traffic in the tree row, which can be particularly significant in young orchards, is the other advantage of the ridge system [35]. According to Perry [36], ridge planting can be used in orchards with a high water table so that the salinity problem can be eliminated. Moreover, Hudson’s [37] study revealed that graded ridges typically increase surface runoff when compared to flat planting.
Consequently, in this study, the EM38 was used to detect the distribution of soil salinity on a field scale under two cultivation practices on the ridge and in conventionally farmed citrus fields to a depth of 2 m during the irrigation period in the Lower Seyhan Plain (Kara Yusuflu village) of Adana, Turkey. The goals of this work were to (a) investigate the functional relationship of ECa and ECe, (b) map and monitor soil salinity using EM38 in both vertical and horizontal dipole modes, as well as reflect the salinity change during the irrigation season of a citrus orchard under two cultivation practices, and (c) finally, determine whether flat or ridge transplantation of citrus is more effective in terms of the subject under consideration.
Materials and Methods
Experimental Area
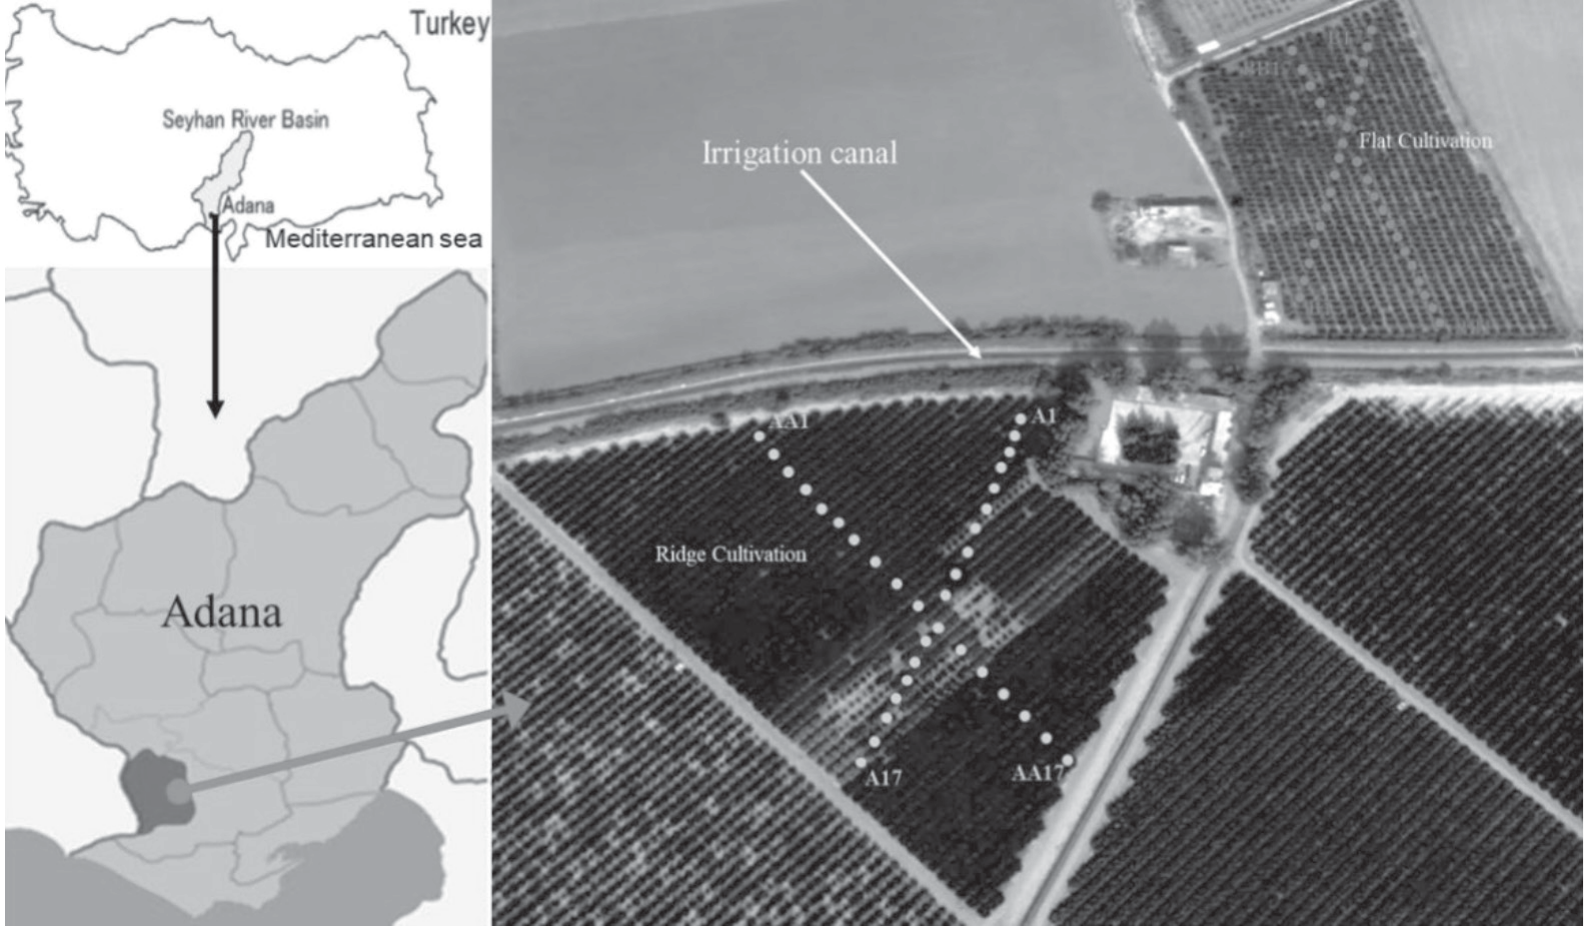
The study area is located in the Seyhan River Catchment, in the 30 da of drip-irrigated flat and 47 da ridge-cultivated citrus orchards of Karayusuflu village (Fig. 1). Both fields are located between the southern latitudes of 36°52’14”-36°51’56” and the eastern longitudes of 35°12’43”-35°13’04” of the Adana town (10 m a.s.l.) (Fig. 1) in the Mediterranean part of Türkiye. The deep, productive alluvial soils, smooth topography, and mild temperature allow the cultivation of a variety of crops [38] in the region. However, major drainage and salinity problems have occurred due to excessive irrigation water application and management obstacles at both the system and farm level since the completion of the irrigation project in the 1960s, despite the availability of good-quality irrigation water [38]. The experiment was setup at a representative ridge and flat citrus plantation in the lower part of the Seyhan Basin. August is the hottest (28.7ºC annual ave.), and January is the coolest (9.5ºC annual ave.) month of the study area, with an annual average precipitation of 647 mm. The climate in the area has been classified as Mediterranean semi-arid, with cold and rainy winters and hot and dry summers. However, year-to-year fluctuations in precipitation have major consequences for agricultural production, necessitating supplemental irrigation for optimum citrus production.
The main experiment sought to monitor salinity at the ‘w murcott’ mandarin orchards planted on ridges and flat fields in the 2016 irrigation season. Accordingly, irrigation began in the trial areas at the end of April and continued until October. The irrigation water was provided from a 200-meter-deep well for both fields. From March to June, 4 irrigations were conducted each month, and from June to October, 12 irrigation treatments were undertaken per month for both experimental fields. Each application lasted for 5 hours over two laterals irrigated by 2l t/h flow rate drippers using C2S1 well water [39]. The recorded rainfall was 9.3, 19.8, 4.5, 41.3, 0, 0, and 56.3 mm in April, May, June, July, August, September, and October, respectively, during the 2016 citrus irrigation season.
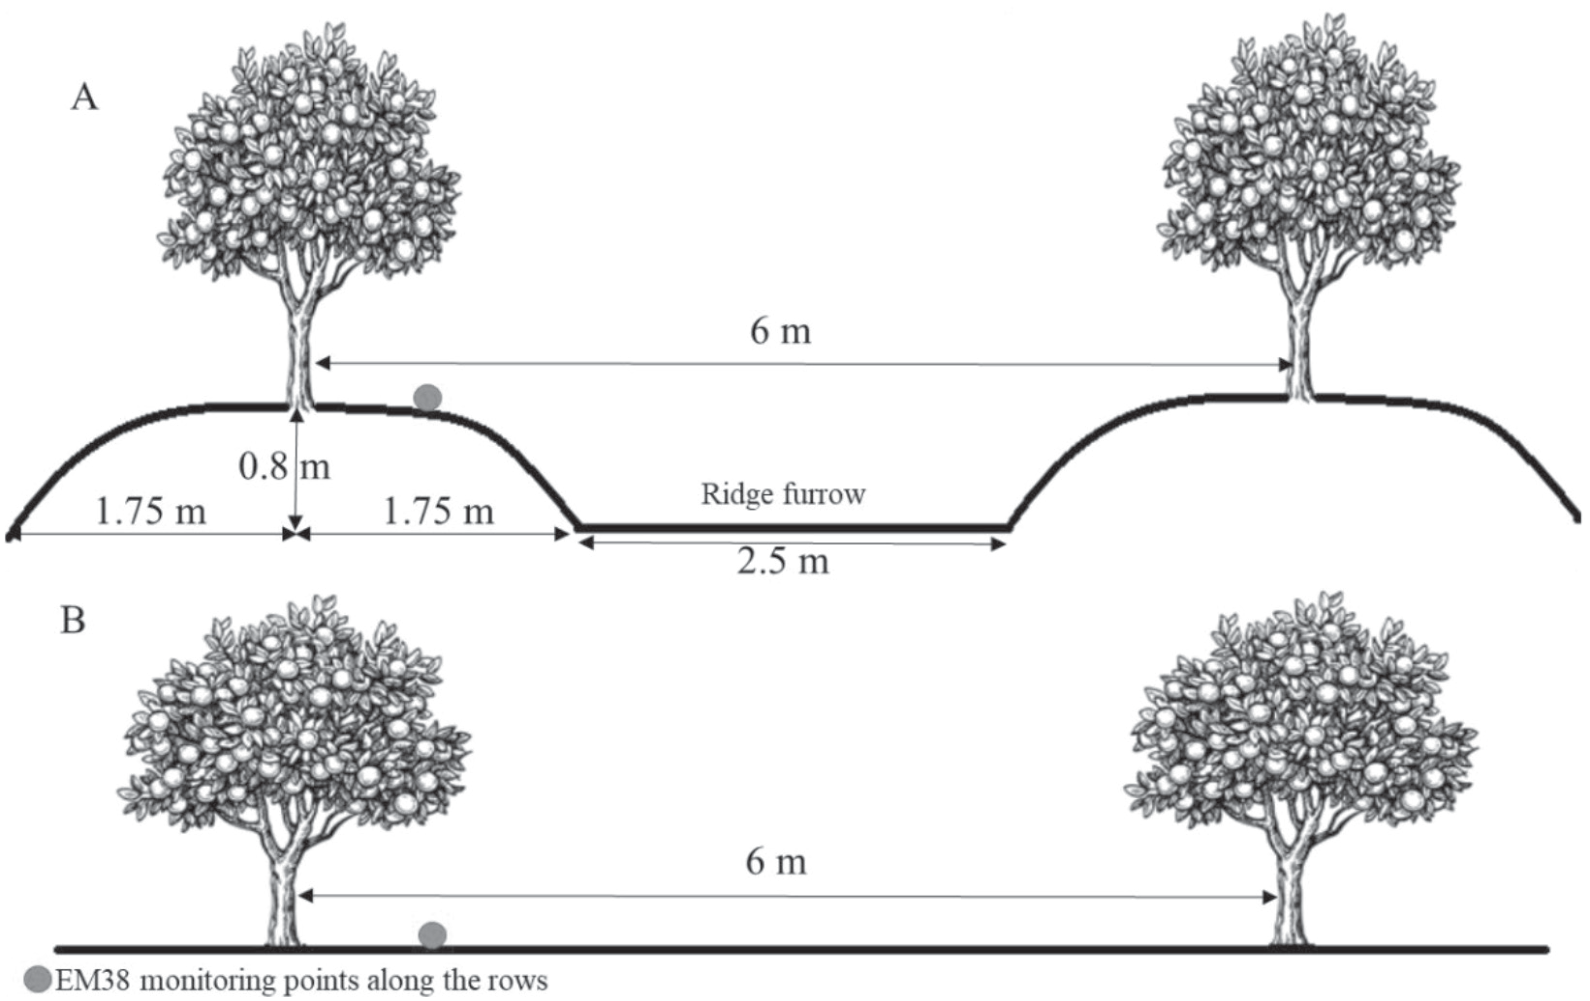
In both fields, the soils classified as Calcaric Fluvisols (Recent Holocene-River Terrace Soils pH 7.4-7.6 and high content of exchangeable Na) were mainly formed by delta plain deposits [40]. The main constraint for the cultivation process is the soil’s low permeability due to its relatively dense clayey (32%) structure and quite high CaCO3 (15%). Based on the meteorological information for the research location, the soil moisture and temperature regimes in the region are Xeric and Thermic, respectively [9]. The citrus plantation is 10 years old and has a 4x6 m allocated field area for each tree in the planting design. For the ridged cultivation, the orchard was planted on ridges of 0.8 m height and 3.5 m width with a NW-SE spatial orientation (Fig. 2).
Function of the EM38
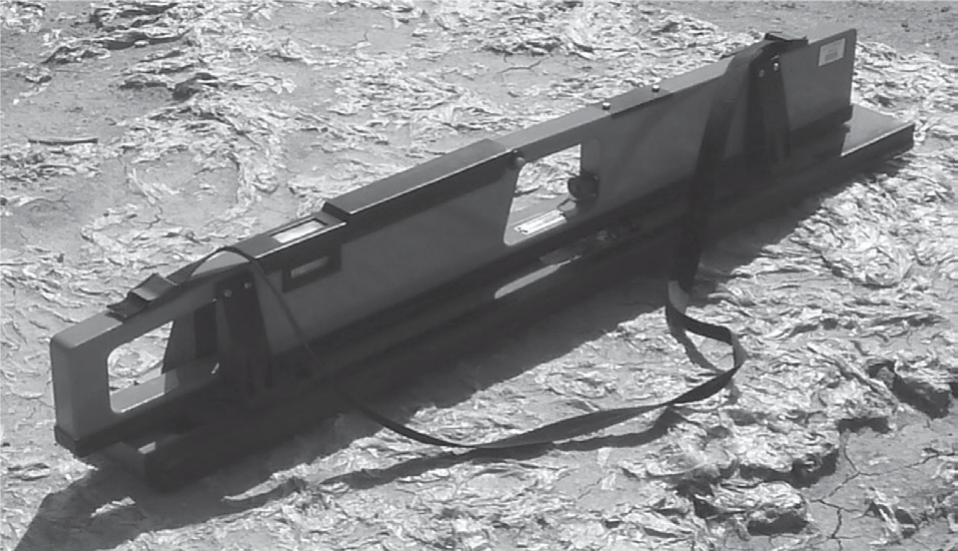
The EM38 was developed to be operated manually: it may be readily integrated into a mobile surveying system that also gathers geo-referenced coordinate location data using a global positioning system [41] (Fig. 3). The Geonics EM38 electromagnetic induction meter, which includes a transmitter and repeater coil separated by 1 m, was utilized in this study for the Eca readings [8]. The coils could be arranged perpendicular (V-V orientation) or parallel (H-H orientation) to the earth’s surface. The transmitter coil receives an alternating current at a frequency of 14.6 kHz with a sinusoidal current, which excites the transmitter coil. As a result, the magnetic field around the coil changes over time [7], and consequently, the ratio of the two magnetic fields quadrature components is detected by the EM38 [42]. The equipment was operated in two measurement modes, vertical and horizontal, where the measured values of ECaV in the vertical dipole mode were primarily determined by the soil characteristics at 1.5 m depth and the ECaH in the horizontal dipole mode correlated with soil characteristics within 0.75 m of the surface [6, 8]. More crucially, these approaches make it possible to gather comprehensive ECa data in tolerable time frames, greatly enhancing the spatial resolution of the EM38 survey maps [41].
Soil Salinity Measurements
Soil ECa values were monitored with an EM38 placed on the ground in horizontal-ECaH and vertical-ECaV orientations at 34 sampling points on two transect lines (ridge cultivation field A and AA; flat cultivation field B and BB transects) for each field at the beginning of the irrigation season in April and the end of the irrigation season in October, 2016 (Fig. 1). Rainfall and/or capillary rise from near-surface water tables revealed that inadequate soil moisture did not limit electrical conductivity at any of the locations. During the measuring process, all metal objects that could affect the electromagnetic field of the EM38 were removed as a precaution. Sampling of the soils was conducted at 10 out of the 34 locations for each field (flat and ridge), representing the complete citrus orchard and their EM38 readings. Subsequently, soil sampling was undertaken by an Edelman hand auger, and calibration of the EM38 was carried out for two different months (April and November). Gravimetric soil samples were collected from the representative pedon at 0-30, 30-60, and 60-90 cm depths, respectively, and placed precisely beneath the EM38 reading point. The cause of the increasing soil moisture with depth determined at all sites was the shallow ground water table. The locations of the soil sampling sites and the ECa readings identified by UTM were determined by the GPS.
Ground soil samples were sieved at 2 mm following air drying and saturated for extraction. Saturated pastes of 100 g sieved soil sub-samples, were kept in the laboratory for 12 hours for equilibrium and electrical conductivity (ECe) measurements in their extracts. Consequently, the average ECe values were determined at depths of 0-30, 30-60, and 60-90 cm for the EM38 calibration process.
Calibration of the EM38
The average ECe values of the three soil depths were calibrated against the EM38 readings from 10 soil sample locations twice for the beginning and ending of the irrigation season, along with EM38 readings at the same time (flat and ridge cultivation), including ECaH and ECaV. Accordingly, curve estimation processes were used in choosing the appropriate models for the soil profile [43]. In this respect, apparent conductivities measured at soil sampling sites served as the independent variables, whereas the mean ECe values, i.e., the dependent variable (ECe = f(ECaH) or ECe = f(ECaV)), pertained to a certain depth. To investigate the impact of horizontal and vertical EM38 measurements on soil salinity at a soil depth, all possible models are anticipated to provide values of good fit, including linear, curvilinear, exponential, and power curves. The correlation of these two variables was initially examined on scattered graphs to help select the best-fitting model. The model with all of the parameters significantly different from zero (P<0.01 level) and with the smallest mean square error (MSE) was selected as the best representative model for calibrating the EM38 with ECe.
Spatial Variability of Soil Salinity
Spatial maps of soil characteristics are essential in agriculture for monitoring soil quality, planning land use, and determining cropping pattern sustainability [41]. Thus, the ECe maps created using the Kriging interpolation technique were examined in order to study the geographical distribution patterns of soil salinity [44]. The ECeH and ECeV values, which were derived from the ECaH and ECaV readings, respectively, led to the creation of the contour maps for flat and ridge cultivation. The stochastic ideal interpolation technique known as kriging is widely used to interpolate weather and soil variables. Nowadays, Kriging has become a very popular interpolation method due to its useful characteristics: each estimate is provided with confidence information in which the quantified uncertainty increases with the distance from the observation points; an estimated spatial image of a variable links up continuously with the observations at the observation points; it is a statistical method from which statistical tests (variances of the parameter estimates) can be derived; Kriging provides a measure of uncertainty of the estimated surface; the technique is powerful and can be easily programmed. The semi-variogram is derived from the input data at known locations and typically represents a sample of points that are irregularly spaced, i.e., illustrates the average differences of the values at points changing by the distance between the sampling sites while also providing a description. The Kriging method is based on the rate at which the variation between points varies over space.
Results and Discussion
The primary factor in dry and semi-arid soil degradation is soil salinity [45]. The actual yield reduction due to salinity could vary significantly and will be determined by a variety of management factors, but will be primarily determined by soil salinity levels and the degree of leaching achieved with rainfall and irrigation water. Thus, it is crucial to monitor the salinity of the soil during the irrigation season under ridge and flat cultivation. Tables 1 and 2 reflect the vital statistics of ECaH and ECaV and the salinity measurements obtained at the 10 sampling points for the flat and ridge cultivation fields along the selected soil depths. In order to ensure that soil water contents were consistent and near field capacity, the EMI surveys were conducted one day following irrigation. The saturated soil paste extract’s electrical conductivity values, or ECe, dropped with soil depth, indicating low levels of salt accumulation and vertical variability in the deeper layers of both fields. The drop with depth was also recorded by Jahanbazi et al. [46], where the maximum EC values were recorded in the surface layer of the soil profile after irrigation. This may be due to the higher soil water-holding capacities of the clayey upper layers of the soil coupled with the limited precipitation, which causes extremely low runoff, leaching, and drainage in the soil profile. As noted by Li et al. [47] and Jahanbazi et al. [46], excessive evapotranspiration at the soil surface or upper layers may cause an accumulation of salt in the upper horizon due to the higher evaporation than precipitation. Simultaneously, following the irrigation event, the dissolution of previously deposited evaporated salts led to an increase in pore-fluid EC [48]. Further, as explained by Li et al. [47], the maximum drip irrigation water volume that might have contributed to the salt buildup at a depth of 0 to 30 cm could have resulted from a maximum wetting depth of roughly 30 cm for each irrigation. The mean ECe values of the depth averages of the experimental site soils increased from 451.1 in April to 469.2 µmhos cm-1 in November for the flat and from 312.1 to 325.0 µmhos cm-1 for the ridge cultivation. The bulk profile of 0-90 cm and the salinities for the three soil depths showed a right-skewed distribution for both cultivations. A pattern like this could be explained by successive random dilutions, which are mostly caused by micro-relief, flat terrain, and low-quality groundwater [9, 49]. Over different time periods, the EMv and EMh signal measurement averages and coefficients of variation are fairly comparable. The homogeneity in soil salinity for both research areas was confirmed by the highly acceptable coefficient of variations of ECaH, ECaV, and ECe (especially for ECe). ECaV and ECaH increased significantly as well, by 18% and 17% for the flat cultivation and 27% and 20% for the ridge cultivation, respectively, based on the average values of the EM38. However, soil salinity values still remained lower in the ridge planting area, as reflected in Tables 1 and 2, which also mentioned by Zhu et al. [50] that drip irrigation combined with ridge cultivation produced a better soil environment, which influenced the ecosystem’s development and moved it in a stable, healthy, and sustainable direction. However, the reason for the higher increase in salinity in the ridge plantation in the EM38 readings may be due to the retention of the high soil water content for a longer period of time with a more gradual decrease. On the other hand, flat cultivation’s high water content rapidly decreased after irrigation, as mentioned by Jiang et. al. [51]. Moreover, Hudson [37] introduced the same approach, as the ridges are expected to decrease runoff and increase water storage. Ratshiedana et al. [6] further explain this relationship by pointing out that high EM38-based ECa in this situation may indicate enhanced soil water content, and they revealed r2 values for ECa and soil water content varied from 0.71 to 0.95 under various moisture conditions, indicating a strong relationship between the two variables. When we evaluated the averages of the three depths of the ECe sampling values for both fields, the salinity increased approximately 4% for the flat cultivation and 2% for the ridge cultivation during the irrigation season. This reflects that the effect of soil water content on EM38 salinity measurements for both the horizontal and vertical readings is evident. In this context, as Visconti and Paz [52] mentioned, the fundamental characteristics of soil, like the soil water content, that are known to influence soil electrical conductivity were linearly related to EMI measurements. Furthermore, ECe values are higher in the 0-30 depth for the ridge and the flat fields. The reason for this may be explained by the Newete et al. [53] study, which stated that the patterns of soil electroconductivity were generally similar to those of soil moisture contents, with soil depths between 30 and 40 cm reporting the highest values of water contents. Additionally, the preliminary findings revealed that the high soil moisture content is one of the major factors contributing to the buildup of soil salinity [54]. For all that, irrigation most frequently indicated significantly higher ECa for the trial areas, as revealed by Padhi and Misra [8].
Table 1.
Apparent soil salinity readings at horizontal (ECaH) and vertical-dipole positions (ECaV) of the salinity monitoring sites and soil sampling points (depths), and ECe values obtained from soil samples taken at the sampling sites for flat cultivation. Salinity readings are in µmhos cm-1, SMD: Salinity Measurement Depths.
Table 2.
Apparent soil salinity readings at horizontal (ECaH) and vertical-dipole positions (ECaV) of the salinity monitoring sites and soil sampling points (depths), and ECe values obtained from soil samples taken at the sampling sites for ridge cultivation. Salinity readings are in µmhos cm-1, SMD: Salinity Measurement Depths.
Although significant dispersion was observed for the EM38 readings, the graph-wise distribution of the points for the ECaH vs ECaV measurements along the monitoring sites for flat and ridge cultivation demonstrated that the relationship between variables was linear with a coefficient of correlation >90% (Fig. 4). This correlation was similarly determined by Herrero et al. [12], reflecting the distribution of salinity at the sampling sites. Thus, the majority of salinity profiles were found to be uniform (EMaH~EMaV), based on our findings. In addition to this, the vertical EM38 readings were higher than the horizontal ones, as also reflected by Slimane et al. [55], which documented that the vertical readings were related to the water content of the whole profile. Gangrade [56] also performed EMI measurements and revealed that the coefficient of correlation for the water content ranged from 0.36 to 0.78, indicating a substantial link between the conductivity values and the water content. Moreover, this may be due to the higher water table level that would affect the vertical readings, as noted by Kaman et al. [1]. Nevertheless, if the soil surface was dry, the EMaH signal could have been underestimated, and vice versa, if the 150 cm deep soil contained saturated layers, the EMaV value would increase and cause an overestimated salinity in the soil.
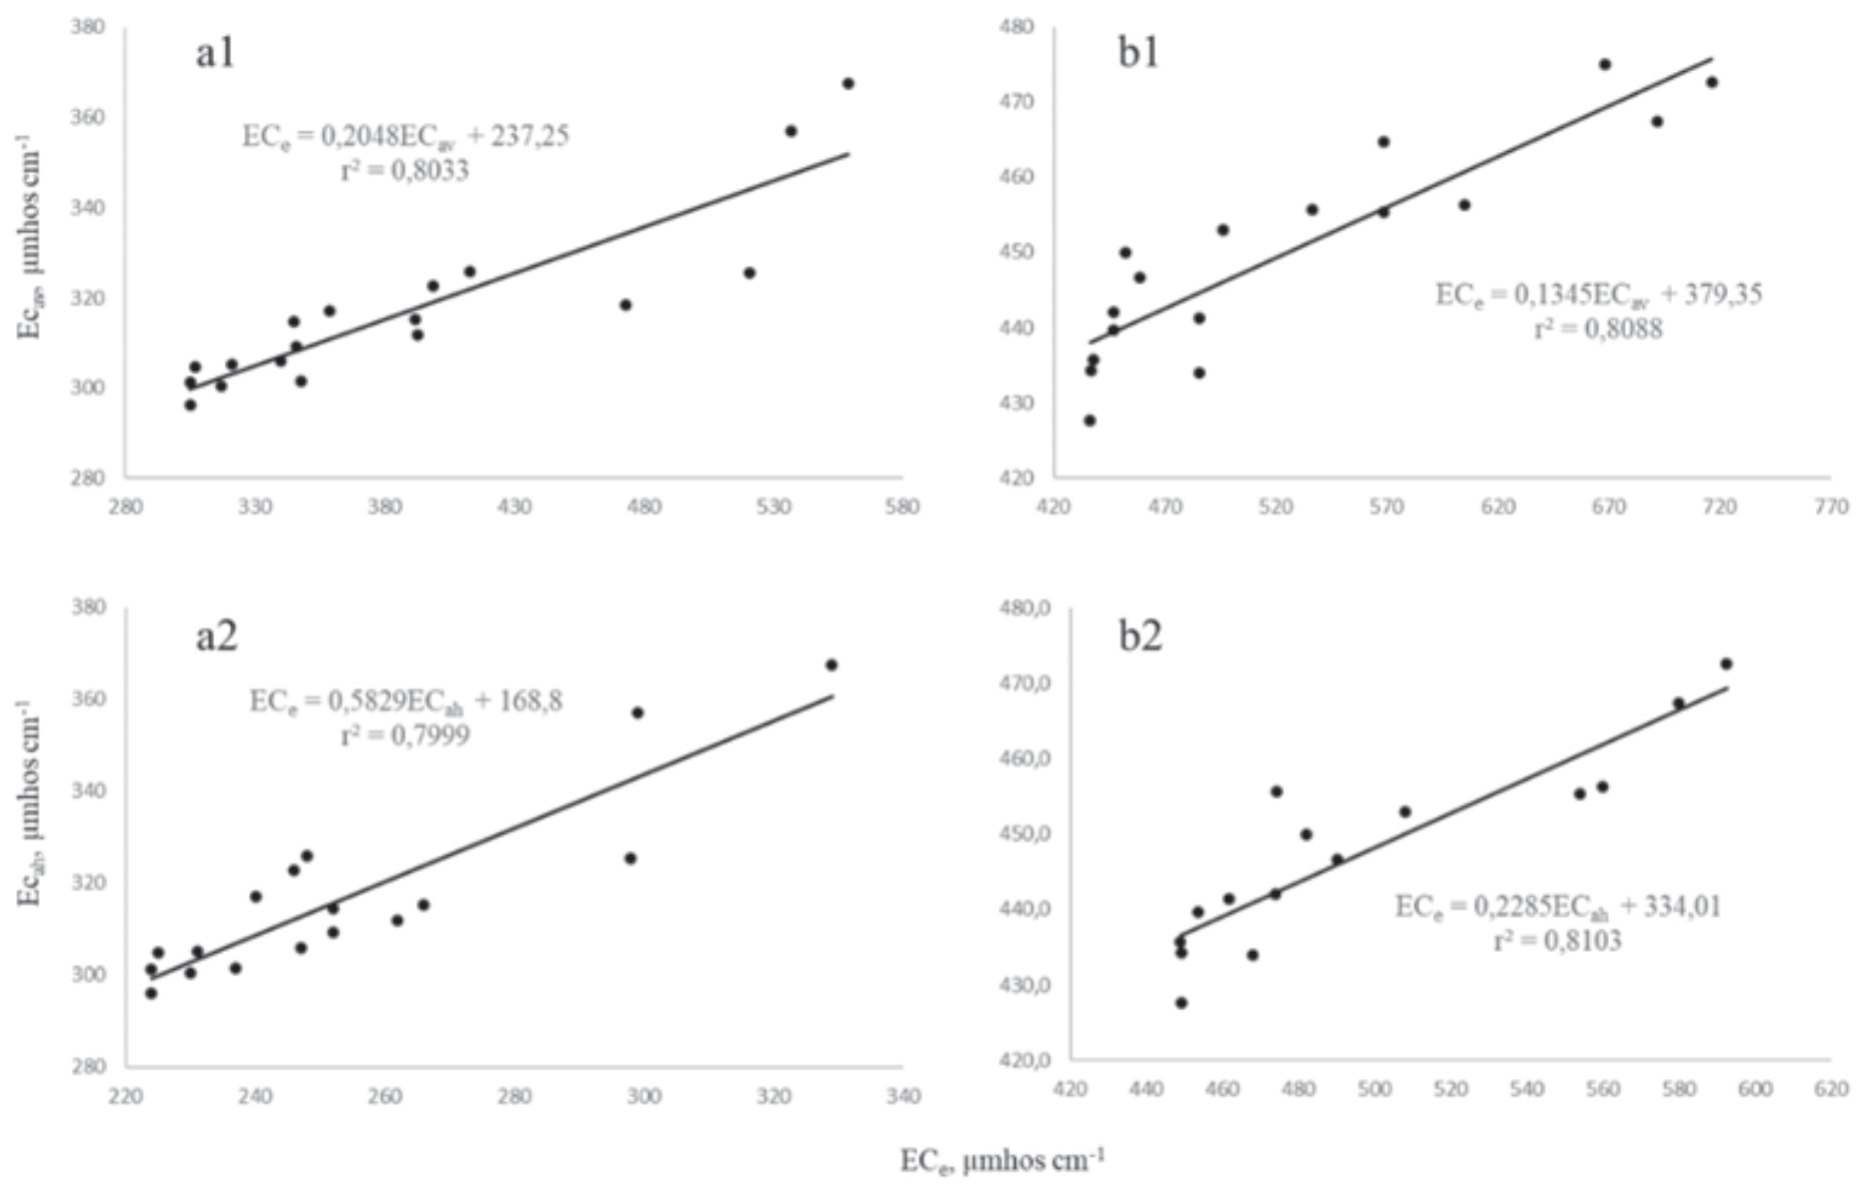
The EM38 device’s wide applicability was assessed in field plots of the Lower Seyhan Plain soils that were uniformly salinized. Thus, in order to derive calibration equations for ECaH or ECaV, ECe was measured at each of the twenty (ten from the beginning of irrigation, ten from the end of irrigation) soil sampling points (Fig. 5). The significant linear correlation (r2 was found between 0.7999 and 0.8103) between the electrical conductivity values measured in the field using the EMI method and laboratory measurements of saturated paste indicated that the EM38 apparatus and the Kriging method were suitable for estimating in-situ measurements of soil salinity and enabling the monitoring of the permanent soil salinity of croplands, as also stated by Gharsallah et al. [57] (Fig. 5). Herrero et al. [12] stated that the average ECe of the different depths of soils and ECaV and ECaH values displayed significant linear interactions, as also noted by the acceptable calibration equation of Slimane et al. [55] based on depth-specific linear regression models with an average r2 of roughly 0.78 that was found between the soil saturated extract conductivity and the EM38 data. Furthermore, the r2 values of the calibration equations are slightly higher in flat cultivation compared to ridge cultivation for both vertical and horizontal readings. The reason for this could be the bulk density, which is also mentioned by Cinthia [58], who states that the bulk density was positively correlated with the ECa readings and was generally higher in flat cultivation than the ridge in this context.
Therefore, the salinity measurements were conducted over the dominant soils of the Lower Seyhan plain, where the ECe and EM38 meter indicated a significant positive correlation in the Recent Holocene-River Terrace Soils, suggesting that the EM38 meter could be a useful tool for accurately and rapidly estimating soil salinity at discrete depths over broad areas.
Fig. 4.
Linear correlations between EM38’s apparent soil salinity readings at horizontal (ECaH) and vertical (ECaV) dipole positions: (S) at starting (n = 34), (E) at ending (n = 34) for the A: ridge cultivation, B: flat cultivation.
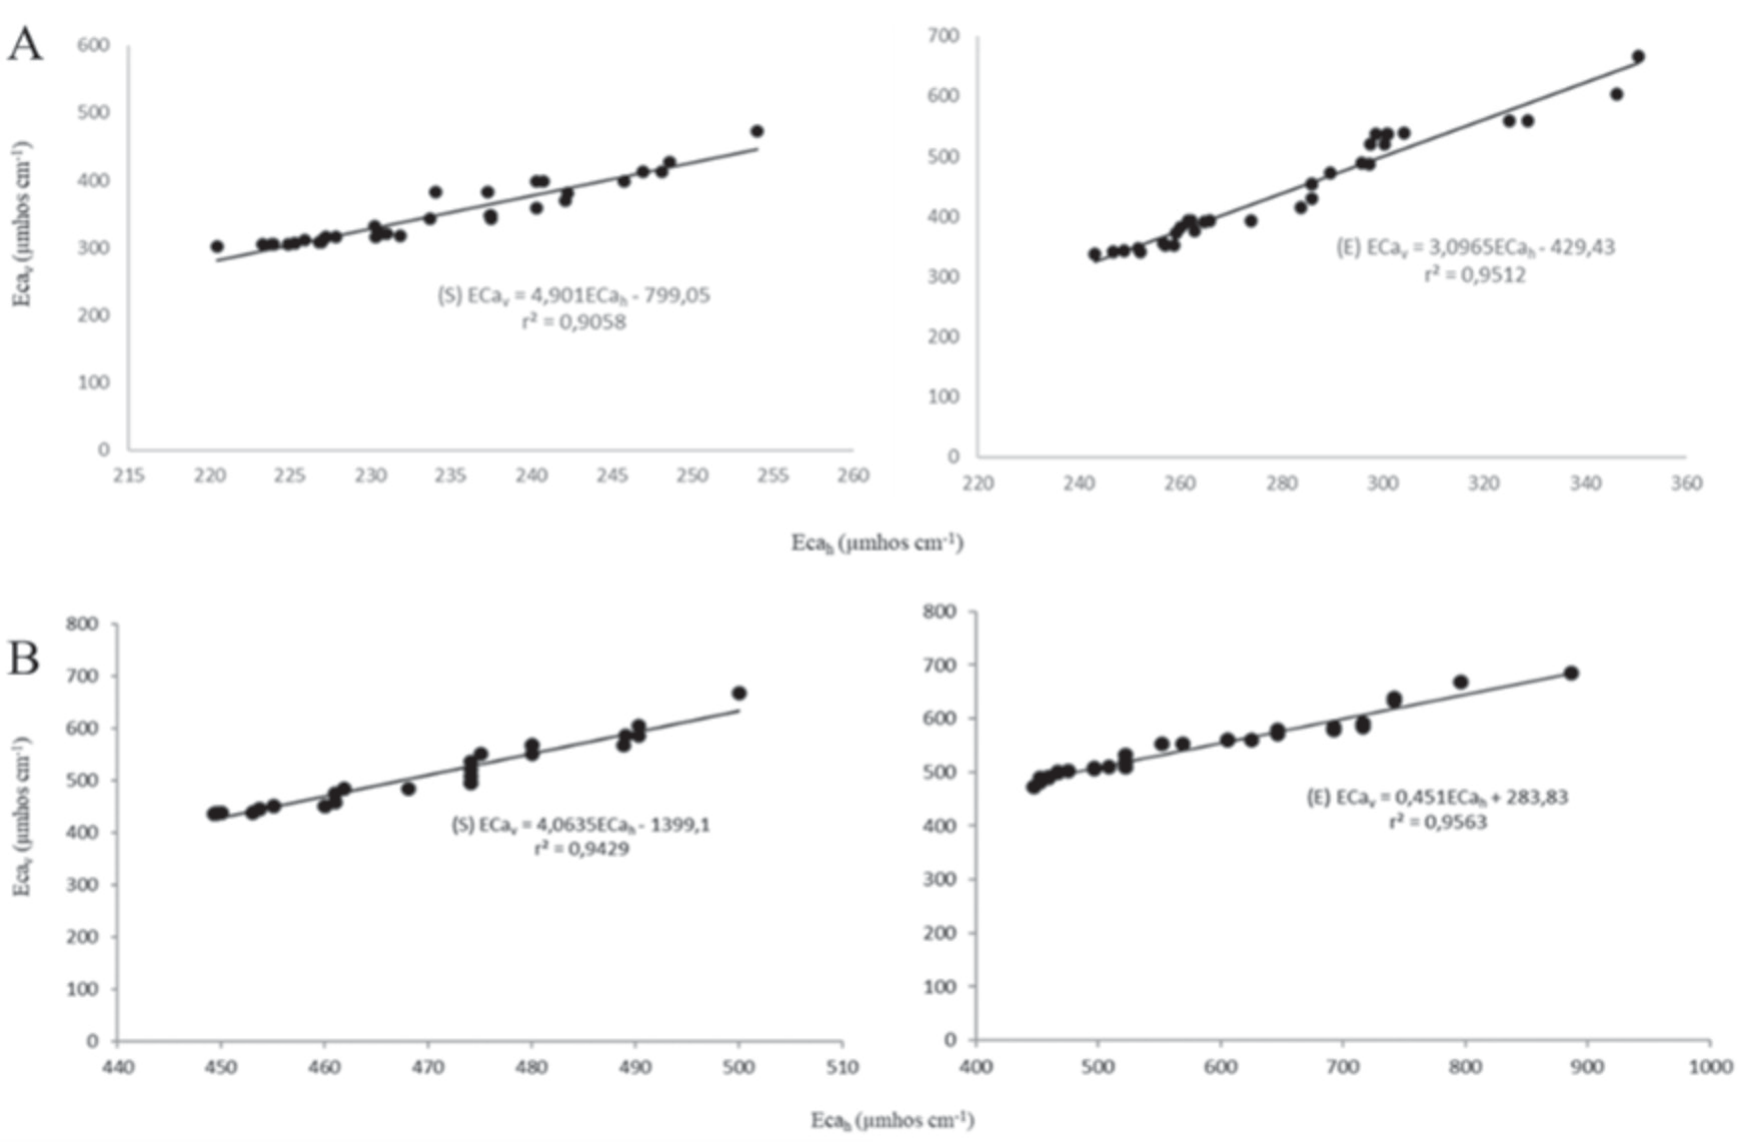
Fig. 5.
Relationship and calibration equation between ECa readings in the horizontal and vertical position and 0-0.9 m depth mean ECe. (a1: vertical readings versus ECa for ridge, a2: horizontal readings versus ECa for ridge, b1: vertical readings versus ECa for flat, b2: horizontal readings versus ECa for flat).
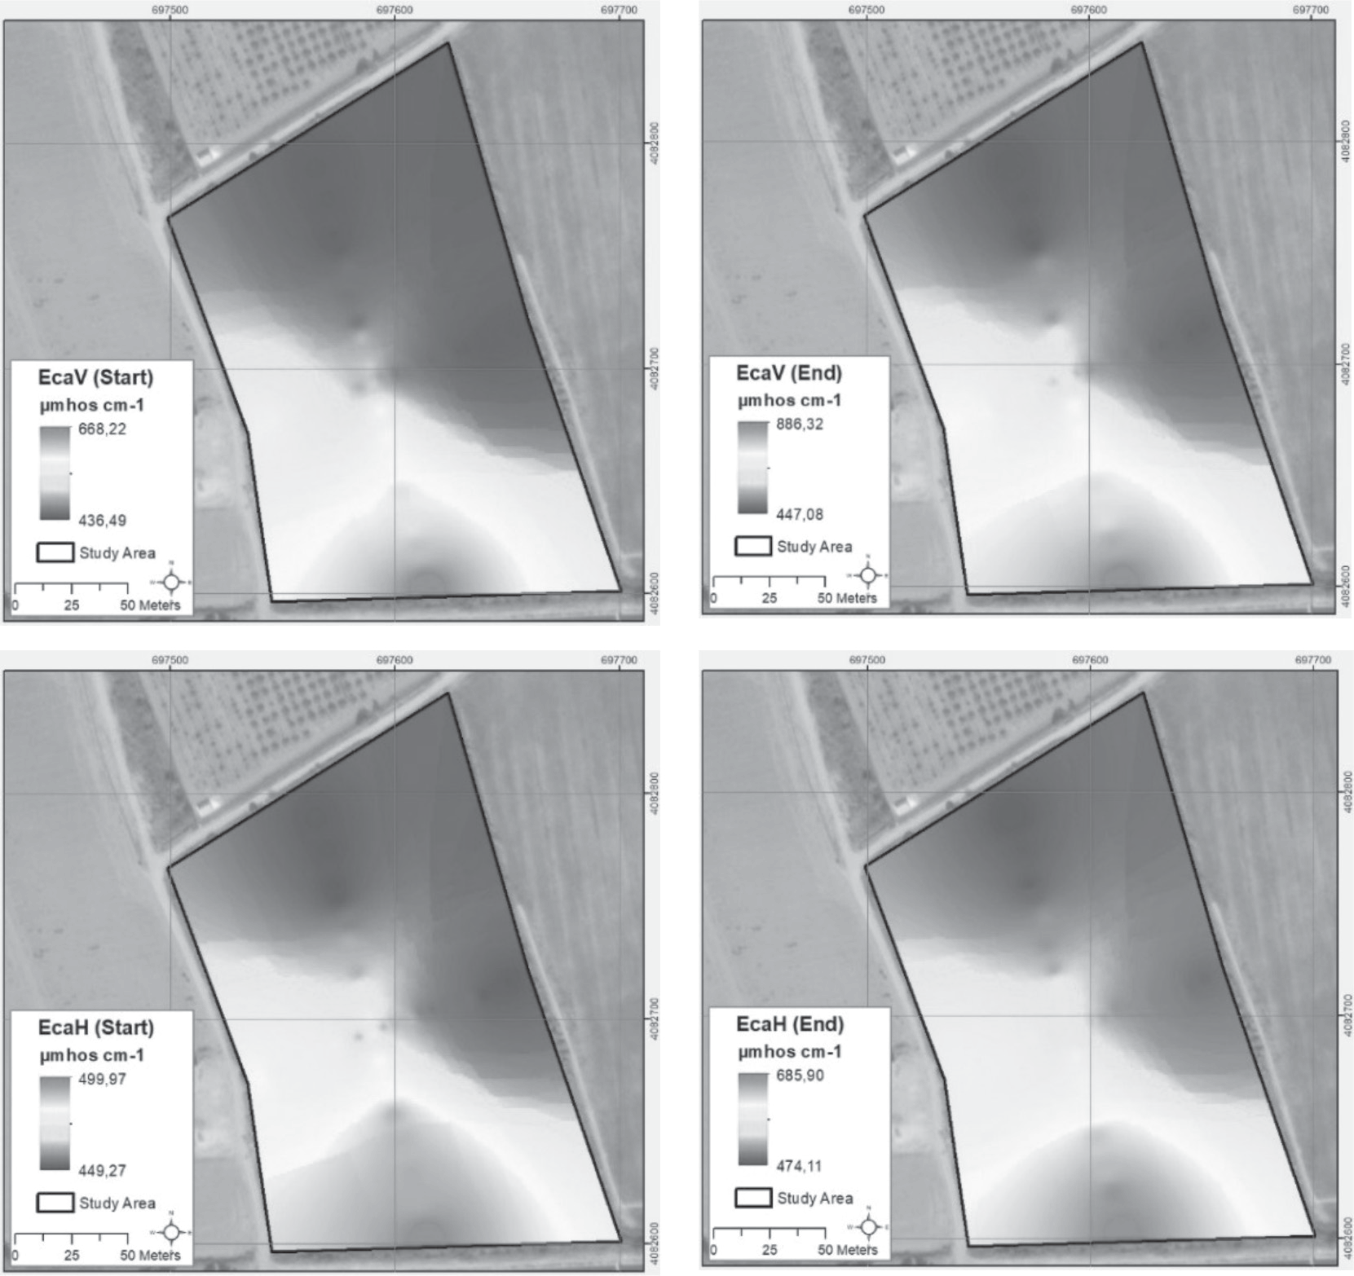
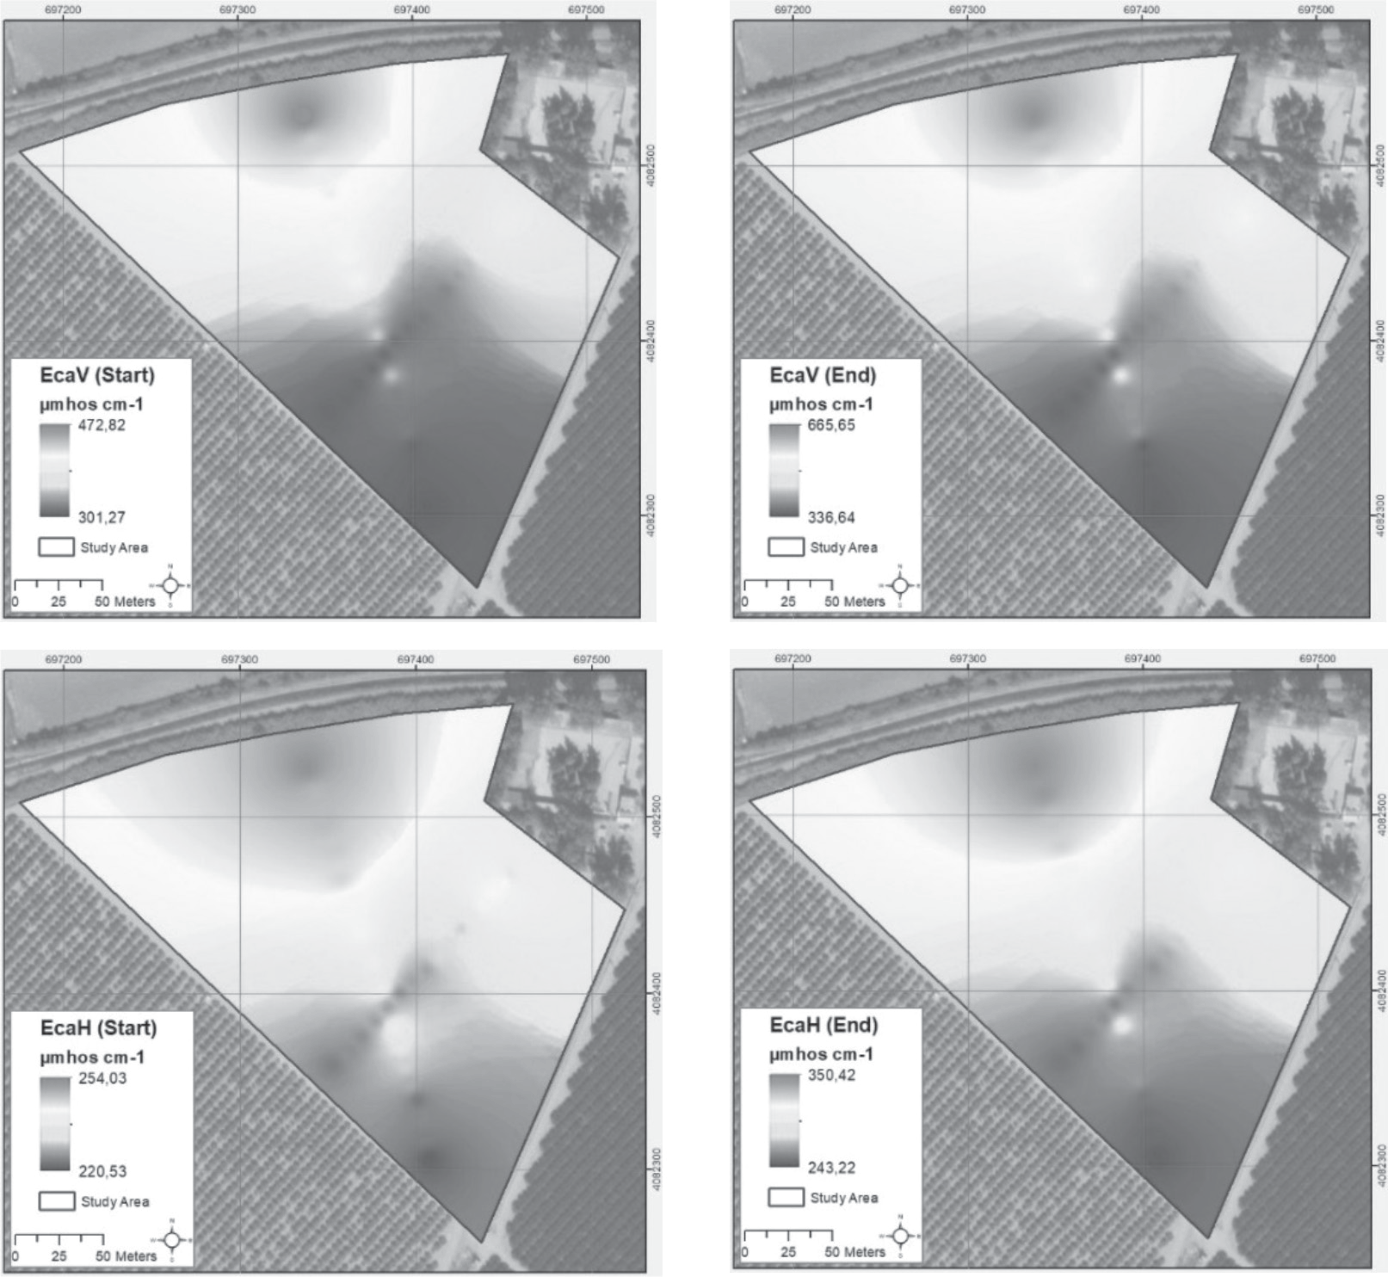
The relatively high values of ECa for vertical and horizontal readings are indicated by red on the maps in Figs 6 and 7. Similar to this, regions with a lighter blue display low values for both ECa. The range of salinity buildup increased with time and linearly during the irrigation season, as can be apparent from the soil salinity maps for both ridge and flat cultivation fields. Evidently, a qualitative comparison of these maps would reveal that the flat cultivation ECaH level peaks varied from 474 to 686 µmhos cm-1 at the end of the season, whereas they varied from 449 to 500 µmhos cm-1 at the beginning. For the ECaV data, salinity levels in the flat field varied from 436 to 668 µmhos cm-1 at the beginning of the irrigation season, reaching as high as 886 µmhos cm-1 at some patches in the area. The specified increases for the ridge cultivation in ECaV spatially varied from 301-473 µmhos cm-1 to 337-666 µmhos cm-1 at the beginning of the irrigation season, while ECaH varied from 243-350 µmhos cm-1 to 221-254 µmhos cm-1 during this period. These readings indicate that the salinity buildup already starts at the beginning of the irrigation season, following the application of 700 mm of controlled water flow to the ridge and flat fields. Nevertheless, Akça et al. [40] documented a seasonal rise that occurred in fields with uncontrolled irrigation (1000 mm) in the Lower Seyhan Plain, causing a 3 ton/ha/year increase in salt accumulation. Similarly, Golabgesh et al. [45] revealed that the decrease in the area of the non-saline land, and, in turn, the proportional increase of the saline lands in Atabieh (Khuzestan) were due to poor irrigation management and the abandonment of the low-yielding irrigation areas from 2000 to 2015. Moreover, Dinç et al. [59] earlier determined the salinity of the area, which includes our study site, as 360 µmhos cm-1. Our results revealed that, at the beginning of the irrigation season, the salinity of the study area increased to an average value of 494 µmhos cm-1 in the flat field as vertical readings (with an approximate increase of 37%), subsequently decreasing to 347 µmhos cm-1 due to local variances. This outcome can be deduced to have reflected the same trend as in Dinç et al. [59], even though it appears lowered for the ridge planting after a period of 26 years, and it is also stated by Zhu et al. [50] to have revealed that ridge cultivation with drip irrigation could reclaim saline soil for vegetation over time. Thus, it’s clear that fall and winter rains each year induce the leaching of the salt built up in the soil during the preceding spring and summer irrigation seasons, especially in ridge plantations. This is also mentioned by Casasola [60]: the salinity declines because of the winter rainfall, and it reaches its lowest level in the early spring. In addition to this, salinity buildup is widely prevented by the recent application of drip irrigation in the ridge planting systems of the study area. Similar to our results, Han et al. [61] stated that the ridge planting system was responsible for the 15% drop in soil salinity within the drip tapes when compared to flat planting. Moreover, Li et al. [62] revealed that ridge cultivation systems increased salt leaching in soils, particularly in deep soil profiles, supporting the results of our work. Salt leaching is most likely enhanced by the occurrence of higher soil water potential gradients under ridge cultivation, in turn increasing the soil water movement, i.e., increasing infiltration [62, 63]. Wang et al. [63] and Li et al. [62] have also stated that improved soil infiltration results from increased rainfall contact domains (soil microstructural units comprising pores and micro aggregates) developing along the deeper parts of the soil profile. In contrast, the increase in soil salinity in flat cultivation [48] occurs when only groundwater is used for continuous irrigation, doubling the salt-loading rates during the 26-year period of Dinç et al. [59]. This could be due to evaporative water loss, inadequate water infiltration, and salinized irrigation water. The soil profile’s increased salinity causes soil pores to become clogged, which reduces salt leaching, facilitates future evaporation, and speeds up future salt building [48, 64, 65], which is an expected situation in flat cultivation [66]. Additionally, there was a noticeable increase in soil salinity measurements in the north to south section for the flat cultivation and south to north for the ridge cultivation. In other words, salinity levels were higher in the north of the ridge cultivated and in the south of the flat cultivated fields, where the EM38 apparatus was placed on the irrigation canal, in order to conduct both vertical and horizontal readings. Consequently, ECa values measured at 34 points for each field decreased with distance from the irrigation canal, due to the inevitable intrusion of water from the concrete structure into both citrus fields, most probably affecting their area-based salinity levels. Awad and El Fakharany [67] manifested in a similar field experiment that the same problem related to water logging was due to intrusion from the irrigation canal and the irrigation network into the agricultural fields. Khongnawang et al. [68] documented that secondary soil salinization was caused by recharge water induced by leaks from the irrigation canals, causing extreme salinization (ECe) in the surface layers of the profiles. The parameters influencing seepage from the irrigation canals in the Gediz watershed in Turkey and the Zayandeh-Rud irrigation network in Iran, studied by Hosseinzadeh et al. [69], revealed that the wetted perimeter influenced seepage from the canals, while the side slope of the canals had only a minor effect. Within this context, Tavakoli et al. [70] also determined that the canal’s seepage raised the groundwater levels by 3 to 11 cm in the soils of Iran. Consequently, in regard to the results obtained in the earlier conducted field experiments, the rising soil water content in the soil horizons most likely caused salinity variations in both ridge and flat cultivations and ultimately reduced the productivity of the cultivated lands, as concluded in this study.
Conclusions
The leading factor contributing to soil degradation in agricultural areas worldwide, especially in arid and semi-arid regions, is soil salinity. Secondary soil salinity is the result of inappropriate practices such as over or insufficient irrigation of the cultivated lands. Therefore, for the sustainable management of these particularly susceptible lands to water use, it’s essential to monitor and control soil salinity throughout the growing season under various agricultural practices. In this regard, the current case study highlights the present uses of electromagnetic surveying for agricultural purposes in the semi-arid region of southern Turkey. Subsequently, we examined soil samples from various depths of selected profiles along with apparent electrical conductivities measured from flat and ridge-cultivated citrus fields. In this context, the conclusions of this study are summarized as follows:
1. The relations between soil analysis and EM38 measurements of electromagnetic induction equipment (type EM38) for soil salinity point out an appropriate, quick, and simple methodology for determining soil salinity in agricultural areas.
2. With a limited number of soil samples, a regression model (prediction equation) was calibrated for each field based on a set of electromagnetic data, and the salinity of the soil was precisely mapped within each field under uniform management. Thus, the EM38 methodology has proven to be appropriate in mapping the spatial and temporal variation of soil salinity for the Calcaric Fluvisols widespread in the Mediterranean lowlands.
3. The varying levels of salinization could be influenced to some extent by the distinct cultivation practices (ridge and flat cultivation). This study demonstrated that ridge cultivation offers better soil salinity management in semi-arid areas under drip irrigation. The continuous irrigation applications in citrus orchards may increase soil salinity in flat cultivation, whereas salinity may be stable in ridge-cultivated fields for many years in the semi-arid Mediterranean. Salts in soils can be leached out of the root zone through either winter precipitation or irrigation practices during the irrigation season for ridge cultivation.
4. The EM38 values were generally slightly higher than the sampled soil data. This may be due to the effect of calibration by the soil water content for precise electromagnetic lectures.
5. The irrigation canals evidently increased the salinity of the neighboring agricultural lands. One of the main objectives of preventing soil salinity is to control the seepage from canals into the surrounding fields. Thus, irrigation canal restoration has become crucial by lining the canal bed with impermeable materials in order to prevent salinity seepage, which in turn lowers the groundwater table and maintains surface water.
6. Finally, to conserve water and soil resources, irrigation water management must be well organized through Water Users Associations and other water management organizations in Turkey. These organizations should be more involved in applying basin-based approaches using advanced agricultural techniques. However, these are still in the early stages of adopting site-specific management of precision agriculture techniques like the implementation of EM38. Utilizing useful sensors like the EM38 is essential for achieving sustainable agriculture, maximizing financial gain, and conserving the environment, particularly the soil.

