

Introduction
Following the reform and opening up, China’s economy has sustained a high rate of growth, creating a miracle of economic growth in the world [1, 2]. However, there are problems of high energy consumption and rough growth behind China’s rapidly growing economy, which has created a serious amount of environmental pollution and energy waste [3, 4]. The conflicts among economic growth, environmental pollution, and energy consumption are becoming more and more prominent. Currently, China has emerged as the biggest energy consumer in the world, and low energy efficiency is a serious constraint to sustainable, high-quality economic development [5-7]. Thus, improving energy utilization efficiency (EUE) has emerged as a significant real-world issue for China’s economy as it transitions from rapid growth to high-quality development. In recent years, to expedite the transformation of energy utilization and vigorously enhance EUE, China has reduced energy consumption per unit of GDP by a cumulative total of 26.4 percent, which is equivalent to a reduction in energy consumption of approximately 1.4 billion metric tons of coal. The Chinese government’s work report for 2023 made it abundantly evident that we should push for further energy reform, encourage the efficient, clean, and low-carbon use of energy, and expedite the design and development of a new kind of energy system in order to support low-carbon and green development. It is evident that achieving sustainable economic development greatly depends on strengthening China’s EUE.
Cities are the main consumers of energy, and they are also the focus of frequent energy and environmental problems [8, 9]. Therefore, improving EUE should start with the cities, and perfecting the development of urbanization is the key breakthrough to solving China’s energy efficiency problems. China’s initial urbanization is massive, but energy efficiency is generally low due to an overly rapid and crude urbanization development approach [10]. In the beginning phase of urbanization in China, large amounts of resources are invested in infrastructure and building construction, but consideration of EUE is often neglected [11]. With an increased awareness of sustainable development, China is gradually introducing a series of policies and standards to improve the crude growth of urbanization. In 2014, the Chinese government issued the National New Urbanization Plan and began implementing the new type of urbanization comprehensive pilot policy (NTU policy). A second and third batch of pilot districts under NTU policies were launched in 2015 and 2016, respectively, after this. One of the main goals of the NTU policy is to promote the efficient use of clean energy, significantly increase the EUE, and enhance the sustainability of the city. So, with the deepening of new urbanization, can the NTU policy increase the EUE? If so, through what mechanism does the policy effect of the NTU policy work? Analyzing the above questions not only provides a useful introduction to China’s new urbanization reform, but also gives empirical evidence for other countries’ sustainable urbanization paths.
The main contributions of this paper are in three main directions. First, the literature currently in publication disputes whether urbanization benefits or hurts EUE. This study treats the NTU policy as a quasi-natural experiment to explore the influence of urbanization on EUE in depth from a policy perspective. Second, previous research has examined the impact of the NTU policy on urbanization development, the urban-rural income gap, and carbon emissions. However, research on the effects of the NTU policy on EUE is lacking. This study extends the relevant research on NTU policy. Third, this study also explores the influence mechanism of the NTU policy from the perspective of green technical innovation and industrial structure upgrading, which provides a reference for deepening the reform of the NTU policy. Meanwhile, this study also investigates the heterogeneous impact of the NTU policy on EUE, which provides some reference value for the government to create a diversified low-energy urbanization development.
Literature Review
Existing studies have done a lot of related work on the influencing factors of EUE. Hu et al. (2019) [12] investigated the correlation between economic growth and EUE by using Chinese provincial data. The findings of this study suggest that economic growth significantly enhances EUE from both short and long-term perspectives. Yao et al. (2021) [13] found that financial development plays a crucial role in promoting economic growth and impacting the environment, and that financial development can improve EUE. Zafar et al. (2021) [14] identified that technological innovations can contribute to the achievement of energy efficiency goals and emphasized the need for energy efficiency innovations. Meanwhile, Wurlod and Noailly (2018) [15] investigated whether green innovations can improve EUE. Wu et al. (2021) [16] investigated that Internet development can enhance not only local EUE but also the EUE of neighboring areas. In terms of overall urban development, Li et al. (2018) [17] utilized data from Chinese provinces to examine the relationship between urbanization and EUE. The final findings suggest that the overall influence of urbanization on EUE is negative in China. Lv et al. (2020) [18] also explore the influence of urbanization on EUE in China from both short- and long-term perspectives. The results show that urbanization is beneficial to EUE in the long run. Yu and Luo (2022) [19] classify urbanization as demographic urbanization, spatial urbanization, and economical urbanization, all of which benefit EUE.
Furthermore, scholars have investigated the impact of key policies on EUE. Geller et al. (2006) [20] summarized the experiences of energy efficiency policies adopted in Japan, the United States, and Western Europe and showed that the relevant policies can provide substantial energy savings. Song and Han (2022) [21] demonstrated that the implementation of appropriate environmental regulatory policies promotes EUE. Tan et al. (2022) [22] showed that China’s carbon trading policies are conducive to the enhancement of EUE. Wang et al. (2023) [23] found that the low-carbon pilot city policy greatly improves EUE.
Since the NTU policy has been implemented, related scholars have conducted in-depth studies on this policy. Wang et al. (2015) [24] returned to the growth process of China’s urbanization and discussed the overall objectives of the NTU policy. According to Peng et al. (2021) [25], the NTU policy greatly encourages urbanization in the Yangtze River Economic Belt’s cities; however, the central pilot region does not see a major increase in urbanization as a result of the policy’s implementation. Liu et al., (2022) [26] found that the NTU policy reduces the urban-rural income gap in either the short or long run. Yu (2021) [27] discovered that the NTU policy effectively reduces urban pollution emissions, and this policy effect is realized through government environmental constraints and the active introduction of foreign investment. Meanwhile, according to Cui and Cao (2023) [28], the NTU policy also helps to lower overall carbon emissions and increase carbon emissions’ efficiency.
Existing literature has examined EUE and the NTU policy, which provides an important reference and support for this study. First, the findings of the existing literature are widely divergent, with some studies arguing that China’s urbanization is not beneficial to EUE [17]. According to several studies, China’s urbanization is beneficial to EUE [18]. Second, there is a dearth of directly relevant studies on the NTU policy. Only some studies are limited to discussing the influence of the NTU policy on urbanization development, the urban-rural income gap, and carbon emissions [26-28]. Research on the impact of the NTU policy on EUE is lacking. Therefore, to compensate for the inadequacies of previous studies, this paper examines the effects and influence mechanisms of the NTU policy on the impact of EUE using data from 276 Chinese cities.
Theoretical Analyses
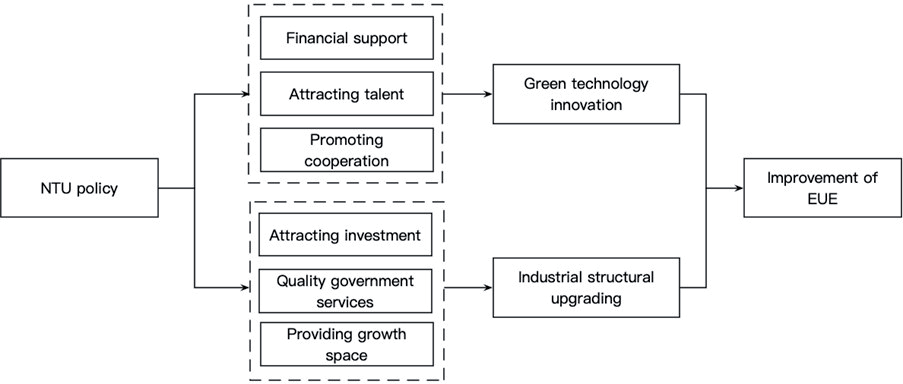
Among the principle targets of the NTU policy is to enhance the sustainable development capacity of cities and promote the decarbonization of production and life [29]. First, the policy promotes the clean, low-carbon, safe, and efficient use of energy, guides the consumption of non-fossil energy in an orderly manner, replaces coal with electricity and gas, and develops distributed energy sources such as rooftop photovoltaics [30, 31]. At the same time, the policy promotes a variety of clean heating methods according to local conditions and promotes energy-saving management modes such as contractual energy management. Second, this policy stimulates the development of ultra-low-energy and nearly zero-energy buildings and pushes for the transformation of industry, construction, and transportation into green, low-carbon sectors [32]. Third, the pilot areas carry out actions to create a green life, advocate green travel and the construction of green families and communities, promote energy-saving products, and establish an incentive mechanism for residents to consume green products. Therefore, we formulate hypothesis 1.
Hypothesis 1: NTU policy significantly improves EUE.
Green technology research, development, and application can be aided by the NTU policy. First, the NTU policy provides financial support for businesses in order to carry out research and development on energy conservation, clean energy, and renewable energy. Second, the NTU policy is conducive to attracting high-quality talents. This policy establishes a reasonable talent introduction policy, attracts high-quality talents to the pilot region for employment and entrepreneurship, and focuses on cultivating skilled talents to meet the needs of industrial upgrading. Finally, this policy has the potential to enhance technological exchanges and resource sharing while fostering the integration of industry, universities, and research. In addition to facilitating the adoption and real-world implementation of green technology, this collaboration can foster innovation and knowledge sharing.
Renewable energy sources are developed and used more often thanks to green technologies [33]. These technologies not only reduce dependence on traditional energy sources, but also have a high energy conversion efficiency, which improves the overall EUE [34, 35]. As a result, we develop hypothesis 2.
Hypothesis 2: NTU policy can significantly improve EUE by promoting green technology innovation.
The NTU policy uses a number of initiatives to support the modernization of the industrial structure. First, this policy encourages external investors to move into the pilot areas, bringing in advanced technology, management experience, and capital inflows to promote the modernization of the industrial structure [36]. Second, it simplifies administrative approval procedures and provides workers and enterprises with convenient services such as policy consultation, job placement, and labor guidance. At the same time, the pilot areas build low-cost, all-factor, facilitated, open growth open space, and space to support the development of micro, small, and medium-sized enterprises.
Industrial structure upgrading includes a shift from traditional industries to service, technology-intensive, and innovation-driven industries [37]. This shift can lead to a transformation of the economy from industries with high resource and energy dependence to knowledge-intensive and high-value-added industries, which can increase the EUE [38, 39]. Therefore, we formulate Hypothesis 3.
Hypothesis 3: The NTU policy can significantly improve EUE through industrial structure upgrading.
Fig. 1 displays the research hypothesis framework for this research project.
Research Methods and Data
Research Methods
Baseline Model
The difference-in-differences model (DID model) is utilized to evaluate the NTU policy’s effect on EUE through a quasi-natural experiment. The treatment group is the pilot area, while the control group is the non-pilot region. With reference to corresponding research [40, 41], the DID model can be put down as follows:
Where EUEit is the EUE of each city, in which the subscript t represents the year and i stands for the city. NTUit is the policy dummy variable. Zit is the control variable ensemble. λt is the year fixed effect. μi is the city fixed effect. εit is the residual term.
Mechanism Effects Model
Combined with the research hypotheses, the mechanism effect of NTU policy is further explored. Referring to related research [42], the mechanism effect model is constructed as follows:
Where Mit is the mechanism variable, and the choices for the remaining variables follow those in Equation (1). Equation (2) focuses on the coefficient of Mit * NTUit. If β1 is remarkable, it indicates that Mit is the influence mechanism of NTU policy’s effect on EUE.
Variables
Explanatory Variable
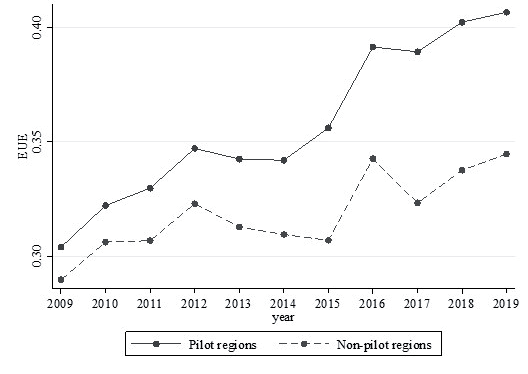
The explanatory variable is energy utilization efficiency (EUE). The Stochastic Block Model (SBM) is used in this study to measure the EUE. Higher values of EUE indicate a higher level of energy utilization in the region. Pollutant emissions are the undesirable output variable, GDP is the desired output, and labor, capital, and energy are the desired inputs for the EUE indicator. The precise indicators utilized to calculate EUE are displayed in Table 1.
Fig. 2 shows the year-to-year development of EUE in the pilot and non-pilot regions of the NTU policy. The pilot areas continuously have a greater EUE than the non-pilot areas, as seen in Fig. 2. This could mean that when choosing pilot zones for NTU policy, the government favors areas with a particular degree of foundation. After the adoption of the EUE policy, the trend of EUE growth was significantly stronger in the pilot regions. This phenomenon provides early evidence of the effectiveness of the NTU policy in improving EUE.
Core Explanatory Variable
A dummy representing the NTU policy serves as the core explanatory variable. In the event that a city is accepted as a test site for the NTU policy in a given year, the value of the city in that year and the years that follow is 1, while the value of the city in years prior is 0. All the years for non-pilot cities are set to 0. In addition, since the beginning of the NTU policy, the three batches of pilot regions all took place at the end of the years 2014, 2015, and 2016, respectively. The start years of policy implementation for the three pilot regions have not contained the majority of the current year’s months. Setting the start of NTU policy implementation at the original time may influence the accurate assessment of the policy’s effect. Therefore, this study resets the start time of implementation in the three pilot regions to 2015, 2016, and 2017 in the actual construction of the core explanatory variable.
Mechanism Variables
The mechanism variables adopt green technology innovation and industrial structure upgrading.
The number of green patents awarded per capita, which is determined by dividing the total number of green patents awarded in a region by its population, is used to quantify green technological innovation (GTI). The World Intellectual Property Organization’s IPC classification number for environmental patents can be used to identify green patents. Chinese patents fall into three categories: invention, utility model, and design. Of these, design patents are not categorized using the IPC classification number [43, 44]. Thus, the total approved number of green utility model patents and green invention patents is the authorized number of green patents in this study.
Table 1.
Indicator description for EUE.
The ratio of the value of output in tertiary regions to the value of production in secondary regions is used to quantify industrial structural upgrading (ISU). The value of ISU increases with regional industries.
Control Variables
The control variables used for this investigation are as follows, with reference to the pertinent literature [45, 46]. Economic development (ED) is expressed in terms of GDP per capita, which is obtained by dividing GDP by the total urban population. Energy efficiency and economic development go hand in hand, with economic development typically requiring substantial energy sources to sustain economic activity. The number of persons per unit area is used to calculate population density (PD). Higher population densities are usually accompanied by a gradual concentration of population and relatively intensive economic activities in cities. Through scale effects, optimal allocation of energy and resources can be achieved, leading to increased energy efficiency. The real use of foreign capital relative to GDP yields the openness degree (OD). Openness is conducive to the introduction and transfer of technology, which can be obtained from the heart of energy technology, equipment, and management experience. These technology transfers can help improve EUE. By calculating the loan balance of financial institutions as a percentage of GDP, financial development (FD) is determined. Financial development provides greater access to capital and financing in the energy sector, which may affect energy efficiency. The percentage of government spending on science and technology relative to the entire budget for government spending is used to calculate science and technology intensity (STI). A substantial increase in energy efficiency can be achieved by supporting R&D and innovation activities in the energy industry through fiscal investment in science and technology.
Table 2.
Descriptive statistics.
Data Sources
Excluding cities with high rates of missing data, this study selects the panel data of 276 Chinese cities from 2009-2019 as the research sample. The China Intellectual Property Office database is the source of the green technology innovation data. Additional data comes from government statistics in China. Linear interpolation is utilized to fill in the missing data. The key variables’ descriptive statistics are listed in Table 2.
Results and Analysis
Baseline Regression Results
This study used the DID model to evaluate the impact of the NTU policy on EUE in order to test Hypothesis 1. Table 3 reports the results of the baseline regression. With and without the addition of year-fixed effects, city-fixed effects, and control variables, Table 3 demonstrates that the regression coefficients for NTU are significantly positive. This reflects that the application of the NTU policy significantly increases the EUE in the pilot area and indicates that hypothesis 1 is correct. Column (4) has the highest value of R2, which suggests that column (4) can better explain the relevance of the results. The result indicates that the NTU policy is able to enhance the EUE by 2.4%.
Robustness Testing
Parallel Trend Test
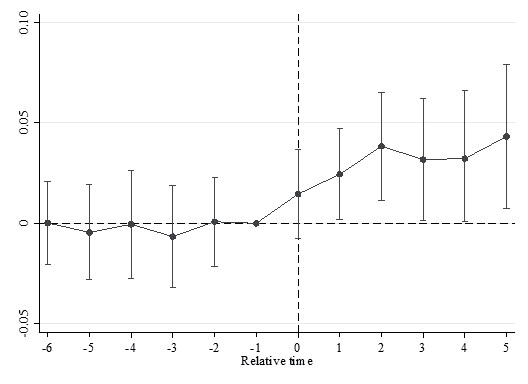
The validity of the DID model for policy evaluation is based on passing the parallel trend test. The test model constructed is as follows:
Table 3.
Baseline regression results.
where j denotes the relative time of NTU policy implementation, and the choices for the remaining variables follow those in equation (1). Before the NTU policy was put into effect, Fig. 3 shows that the regression coefficients are not significant. This suggests that the parallel trend assumption is satisfied and that, prior to the NTU policy’s adoption, there was no discernible difference in the EUE trend between the cities in the treatment and control groups. Fig. 3 illustrates that the policy effect does not materialize until a year following the NTU policy’s implementation. Furthermore, the coefficient’s value progressively increases in the overall trend, suggesting that the NTU policy influence will grow over time.
Placebo Test
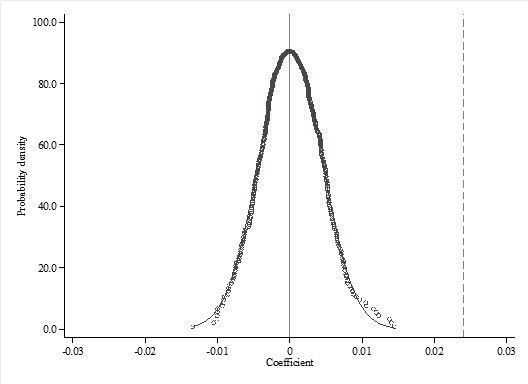
This research performs a placebo test in order to further eliminate the impact of other unidentified factors on the choice of pilot towns. The placebo test is conducted as follows: randomly generating cities that implement NTU policy, thus constructing a dummy variable for “pseudo-NTU policy”. Based on the randomly selected sample, the baseline regression is re-run according to equation (1). This process is repeated 500 times. From Fig. 4, the coefficients obtained from the random sample estimation are distributed around 0, which is far from the coefficients estimated from the benchmark regression. This suggests that the impact of NTU policy on EUE has very few causative associations with other uncertain factors.
Bacon Decomposition Test
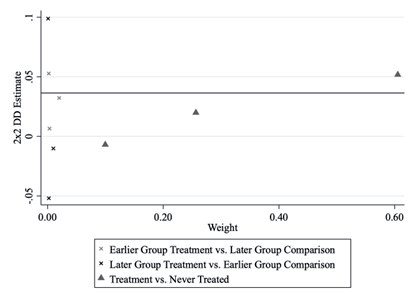
The DID model in this study is a staggered DID model. However, a staggered DID model may lead to estimation bias in the results [47]. To test for the presence of estimation bias, this paper implements the Bacon decomposition on the benchmark regression results. Fig. 5 presents a scatter plot of the weight distribution of the Bacon decomposition results. The decomposition results show that most of the estimates are from the completion of the comparison between the treatment and control groups. This result indicates that the benchmark regression results are stable.
Propensity Score Matching (PSM)-DID Test
When selecting pilot regions for the NTU policy, the government takes into account the population size, economic development, and other elements of each region and prefers to implement the policy in regions that already have a certain foundation. This kind of sample selection may have bias, which leads to biased regression results. Therefore, the effect of the NTU policy on EUE is re-estimated using the PMS-DID model. Matching is done using nearest neighbor matching, kernel matching, and radius matching. The computed coefficients are all statistically positive, as shown in Table 4, which validates the conclusion that NTU policy can significantly improve EUE.
Removing Interference from Other Policies
Related environmental policies can also improve EUE, such as the carbon trading policy and the low carbon pilot policy. This study adds dummy variables that interfere with policies, including CTP and LCP, to the model (1) in order to eliminate the interference of other policies. Table 5’s findings demonstrate that the coefficients of NTUC are still substantially positive, which means that the baseline regression results do not receive interference from other policies.
Further Analysis
Mechanism Effect Results
In order to confirm that the NTU policy can considerably increase the EUE, this study used the DID model along with a number of robustness tests. What particular transmission mechanism does it use, then? According to the research hypothesis, this paper explores the influence mechanism from two aspects: green technology innovation and industrial structure upgrading. Table 6 displays the mechanism’s test results.
Column (1) shows that the coefficient of GTI*NTU is apparently positive, indicating that NTU policy enhances EUE by promoting green technology innovation, which proves Hypothesis 2. It is evident that by encouraging the study, creation, and use of green technology, the NTU policy may significantly contribute to the enhancement of EUE. This strategy promotes innovation and the advancement of environmentally friendly technologies in fields like energy-saving and renewable energy. By implementing these green technologies, traditional energy consumption may be decreased and environmental quality can be increased.
Column (2) shows that the coefficient of ISU*NTU is apparently positive, indicating that NTU policy enhances EUE by upgrading industry structure, which proves Hypothesis 3. It is evident that the NTU policy guides economic development towards high-value-added, low-energy-consuming, and environmentally friendly industries and reduces reliance on traditional high-energy-consuming industries. This reduces overall energy consumption and improves EUE.
Heterogeneity Analysis Results
Geographic Heterogeneity
Due to its large land area, China has long faced the issue of disparities in regional development [48]. In this study, the entire sample is split geographically into three regions: the eastern, central, and western regions.
Column (1) of Table 7 indicates that the coefficient of NTUC is apparently positive, while columns (2) and (3) show that the coefficient of NTUC is not significant. This suggests that the implementation of NTU policy in the eastern region is the only means by which it can enhance EUE; its application in the middle and western regions is not conducive to improving EUE. The following are some potential explanations for this heterogeneity: The eastern part of China already has a relatively well-developed infrastructure and developed economic system, including a high-quality transportation network, a modern building structure, and an efficient energy supply system [49]. NTU policy may be better suited to enhance the EUE in the eastern part of the country.
Nevertheless, the EUE is not improved equally by the central and western regions’ application of the NTU program. This phenomenon may be caused by the fact that the western and central regions still have a far smaller infrastructure base than the eastern regions, which hinders the advancement of energy use efficiency. Furthermore, there is less opportunity for increasing energy consumption efficiency in the central and western areas due to their lower levels of economic development, smaller cities and densities, and comparatively fewer employment possibilities and economic activity. Thus, in order to increase energy use efficiency, special emphasis must be given to infrastructure development, economic development, strengthening energy management, and technical innovation when executing the NTU strategy in the central and western areas.
Administrative Level Heterogeneity
China divides its cities into administrative classes such as directly governed cities, provincial capitals, planned cities, and prefectural cities according to their political status. In China, cities with higher administrative registrations not only have larger economies, but also benefit from a range of policies or resources [50]. Therefore, when implementing the same policies, there are significant differences in policy implementation among cities with different administrative levels. The total sample is divided into high administrative level regions, and low administrative level regions. Directly administered cities, provincial capitals, and planned cities are examples of high administrative level areas; other cities are considered low administrative level regions.
Column (1) of Table 8 indicates that the coefficient of NTUC is apparently positive, and column (2) indicates that the coefficient of NTUC is not significant. This indicates that NTU policy can only improve EUE when implemented in high administrative level regions and NTU policy cannot improve EUE when implemented in low administrative level regions. The following are some potential explanations for this heterogeneity: regions with a high administrative level have high-quality resources and are more likely to receive favorable government policies. These areas may greatly increase EUE by fostering the growth of the energy sector since they have greater financial and human resources available to them.
In contrast, the reason that the implementation of NTU policy in areas with low administrative levels in China cannot effectively improve EUE is mainly due to the relatively weak infrastructure and resource conditions. These areas lack appropriate financial and technical assistance, have a comparatively antiquated industrial structure, and have low levels of economic development. Furthermore, individuals in low-income areas might not be as conscious of the need to save energy and protect the environment or be as eager to do so due to their restricted budget. In order to gradually improve EUE, it is therefore required to provide greater emphasis to the promotion of infrastructure development, technical support, and other measures when executing the NTU policy in areas with low administrative levels.
Population Density Heterogeneity
Differences in urban population density may also affect energy use and energy efficiency. The total sample is categorized into high and low population density regions according to the median population density of all cities.
Column (1) of Table 9 indicates that the coefficient of NTUC is apparently positive, and column (2) indicates that the coefficient of NTUC is not significant. This suggests that the NTU policy can only increase EUE when it is implemented in high population density regions, but it cannot increase EUE when it is implemented in low population density regions. The following are some potential explanations for this heterogeneity: first, high population density areas help to centralize economic activities and resource allocation, which contributes to the improvement of energy use efficiency. Second, high population density areas have more convenient transportation networks, and residents tend to use mass transit more, which reduces the waste of energy from automobile use.
On the contrary, the implementation of the NTU policy in areas with low population density is not effective in increasing energy efficiency. The main reasons for this phenomenon are as follows: Low-population-density areas may also lack economic scale, making it relatively difficult to introduce new technologies and investments, thus limiting the improvement of energy use efficiency. In addition, low population density areas often face problems such as the loss of human resources and limited employment opportunities. The lack of skilled professionals and suitable jobs limits the accumulation and utilization of energy management and technological innovation capabilities. At the same time, low population density areas may have a higher degree of aging, and residents’ consumption habits and awareness are relatively conservative, reducing the demand for and adoption of green energy-saving products and services. Therefore, technical assistance and talent development should be increased when the NTU policy is implemented in low-density areas in order to raise locals’ understanding of energy conservation and environmental preservation, so as to promote the improvement of energy utilization efficiency.
Old Industrial Regions or Not
Industrial activities consume large amounts of energy. NTU policy implementation in different types of industrial areas may have different impacts on EUE. The total sample is divided into old industrial regions and non-old industrial regions in accordance with China’s old industrial base adjustment and transformation plan.
Table 9.
Population density heterogeneity results.
Table 10 shows that the NTU policy can only improve the EUE when it is implemented in old industrial regions, and the NTU policy cannot improve the EUE when it is implemented in non-old industrial regions. The possible causes of this heterogeneity are as follows: Old industrial areas usually have a large industrial base and a well-developed industrial chain, which gives more opportunities for technological upgrading and restructuring when implementing the NTU policy, thus improving EUE.
On the contrary, the main reasons why the NTU policy is not effective in improving the EUE when implemented in non-old industrial areas are as follows: Non-old industrial areas do not have many industrial industries compared to old industrial areas, so the demand for energy is lower in non-old industrial areas. This significant difference means that non-old industrial areas may pay less attention to energy issues and lack sufficient motivation and willingness to promote the improvement of EUE. Therefore, when implementing the NTU policy in non-old industrial areas, differentiated policies and actions must be developed in accordance with local circumstances and traits, and local energy usage efficiency awareness and standards must be raised.
Heterogeneity of Different Levels of EUE
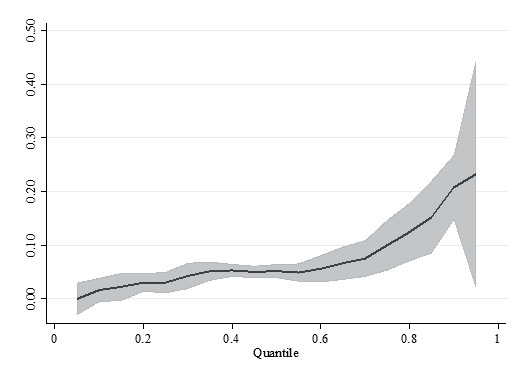
Differences in EUE levels may lead to heterogeneity in NTU policy implementation. Therefore, this paper uses quantile regression modeling to investigate the marginal impact of the NTU policy on EUE.
Fig. 6 demonstrates that the magnitude of the regression coefficients gradually increases as the quartiles gradually increase, which suggests an incremental trend in the promotion of the NTU policy on EUE. In short, for regions with low EUE, the NTU policy has a relatively small effect on EUE improvement. For areas with high EUE, the NTU policy has a relatively large effect on EUE. Possible reasons for this heterogeneity are as follows: Areas with higher EUE usually have advanced energy supply systems, quality infrastructure, and a high level of technical support. This provides a favorable environment for the NTU policy to increase EUE.
Conclusions and Policy Comments
Reducing carbon emissions and resource consumption through increased energy efficiency has become crucial in light of the growing worldwide concern about climate change and environmental protection. Cities, as the main carriers of energy consumption, face continuously increasing energy demand in the rapid urbanization process. The NTU policy is a key policy in China’s new urbanization process. An in-depth understanding of the NTU policy’s impact on EUE can help formulate effective energy planning and promote sustainable urban development. Taking 276 cities in China as the research sample, this study examines the influence of the NTU policy on EUE in a comprehensive and detailed manner using the DID model. The following are the research’s principal conclusions: (1) The NTU policy can apparently improve EUE. This finding still holds after a series of robustness tests, such as the parallel trend test, placebo test, bacon decomposition test, PSM-DID test, and removing other policy interference. (2) The mechanism analysis findings show that the NTU policy improves the EUE, mainly relying on the promotion of green technology innovation and industrial structure upgrading. (3) The heterogeneity analysis findings show that different regions exhibit differentiated effects in the implementation of the NTU policy. This is mainly reflected in the fact that the NTU policy has a more obvious effect on the enhancement of EUE in eastern regions, high administrative level regions, high population density regions, old industrial regions, and high EUE lever regions.
In order to further enhance the EUE, this study suggests the following policy suggestions for the NTU policy, based on the previously mentioned findings:
(1) The pilot areas of the NTU policy need to be further expanded. First, it is commented that the NTU policy should further expand the scope of the pilot areas to further enhance the EUE. Second, in order to assure the efficient application of the policy, the government can strengthen the monitoring and evaluation mechanism, establish a scientific indicator system, and track and evaluate the progress of the pilot work in a timely manner. Finally, the government should strengthen cooperation with all parties, including enterprises, research institutions, and social organizations, to jointly promote the NTU policy and achieve new results.
(2) Pilot areas ought to raise the bar for green innovation and quicken the process of modernizing the industrial structure. Pilot regions are going to offer more funding, encouragement, and special capital subsidies to green technology research and development organizations and businesses, as well as scientific research projects pertaining to energy efficiency. Pilot regions should encourage the strengthening of environment-friendly and high value-added industries to optimize the industrial structure. At the same time, the pilot regions should strengthen the convergence of related industrial chains and enhance the efficiency of resource recycling.
(3) The NTU policy should be adopted with consideration for local circumstances. Relevant policies should include an in-depth study of local resource endowments, factor conditions, and the basis of economic development, as well as the formulation of differentiated policy objectives to adapt to the current situation and potential of energy utilization in different regions and industries. Governments should also flexibly utilize policy tools to achieve the goal of comprehensive energy use efficiency improvement.

