

Introduction
Urbanization is a prominent feature of the global economy and society development, and many countries are actively pursuing it as a fundamental strategy [1]. However, in the background of fast-paced economic growth and the increase in industrial production, transportation, energy consumption, and urban migration, there are concerns about resource depletion, environmental degradation, and other pressing issues [2, 3]. Therefore, the traditional approach of prioritizing economic development over environmental concerns has been challenged and opposed by policymakers. Instead, there is a growing movement towards promoting green development and transforming the economic model to prioritize environmental protection [4]. In the 21st century, many countries have adopted GTFP as their primary economic driver. It is based on transitioning from input-driven to innovation-driven modes of economic development within the constraints of limited resources and environmental preservation. The ultimate goal is to achieve economic growth while minimizing negative impacts on the environment [5]. Therefore, GTFP plays a pivotal role in promoting high-quality development that balances economic growth with environmental preservation. This measure is often employed to evaluate a country’s progress towards achieving high-quality development.
Urbanization tends to grow alongside rapid economic development [6]. Correspondingly, Sharma [7] affirms that urbanization can be a positive force for overall economic growth. Megeri and Kengnal [8] found that national economic development and urbanization are closely related. China’s economy has grown swiftly since it initiated economic reforms and opening-up policies, with an average annual growth rate of 10%. In 2021, the country’s GDP soared beyond 110 trillion yuan. However, China’s approach toward urbanization has always revolved around economic development and served overall national strategies. With rapid economic progress, China has significantly accelerated its urbanization process [9], and the urbanization rate of China’s permanent population reached about 64.72% in 2021. In 2014, the Central Committee of the Communist Party of China, together with the State Council, issued the National New Urbanization Plan (2014- 2020). This agenda prioritizes sustainability-oriented, human-centered development while emphasizing environmental protection. It has been instrumental in promoting new urbanization development in China [10]. While China has been undergoing urbanization, there have been some challenges that have arisen, such as inadequate cooperation between urban and rural areas and surplus labor in rural areas [11]. In recent years, anti-urbanization has become apparent in certain Chinese cities. This trend is primarily characterized by residents opting to leave urban areas and return to rural or small-town living. This shift is attributed to the high pressures of city life, soaring housing costs, and environmental pollution. In light of the drive for high-quality development and rural revitalization in China, it is particularly crucial to explore the influence of urbanization and ALT on GTFP and the underlying mechanisms that fuel this impact. This research holds practical significance for improving the effectiveness of urbanization towards promoting a green economy and high-quality economic development, as well as revealing new drivers of economic growth in China.
Total factor productivity (TFP) is a crucial macroeconomic measure of the productivity of all productive factors, as stated by Solow in 1957. It helps to assess the effectiveness of economic growth and analyze its sources, taking into account the total output of each factor rather than focusing on individual factors as single factor productivity does [12]. This approach allows for a comprehensive view of input and output across all units in the economy, making it an excellent standard for evaluating economic development quality. In recent years, China has been actively promoting green and low-carbon development [13], leading policymakers and economists to focus on GTFP. Unlike traditional TFP, GTFP incorporates environmental protection, reflecting the principles of green development and aligning with high-quality development goals [14, 15]. The most commonly used methods to measure TFP are the Stochastic Production Frontier Model and Data Envelopment Analysis [16-20]. Despite many measuring approaches for GTFP, there is no consensus about a unified scientific conclusion for its measurement.
Since TFP was proposed, extensive literature has emerged regarding the determinants of total factor productivity. Scholars have investigated the influence of TFP from various perspectives, including human capital [21], trade orientation [22], information technology [23], environmental regulations [24-26], and economic reforms [27]. Additionally, researchers have explored the connection between urbanization and total factor productivity, examining the impact of urbanization on TFP through different lenses such as coupling coordination degree [28] and land eco-efficiency [29]. However, there is no consensus on the relationship between urbanization and GTFP, yielding three primary conclusions. Firstly, studies have revealed that urbanization hinders the growth of GTFP [30]. Secondly, an opposing viewpoint is held by some scholars who believe that urbanization actually fosters the growth of GTFP. Kumar and Kober [31] conducted a study suggesting that urbanization yields a positive impact on total factor productivity through the agglomeration effect. Furthermore, Yu [32] demonstrated in their research that new-type urbanization not only reduces pollution emissions but also has ecological benefits. Thirdly, certain researchers have discovered that the correlation between urbanization and GTFP is not linear and could potentially be nonlinear. For instance, Kolomak [33] found that the favorable effect of urbanization on regional productivity in Russia diminishes over time, eventually acting as a hindering factor. In recent years, numerous studies have examined the effects of ALT on GTFP [34, 35]. The influence of ALT on GTFP remains controversial.
In summary, while there is abundant research on TFP, there is still a lack of study on TFP under the constraint of non-expected output. Furthermore, most of the literature on TFP is focused at the provincial level [36-38], with few studies at the county level, especially on a large scale such as GTFP across the entire country of China. Additionally, although academic circles have examined the relationship between ALT, urbanization, and GTFP from different perspectives, there is a need for a systematic demonstration of the internal relationship between these three factors. Therefore, this study makes significant contributions in several ways. Firstly, it incorporates non-expected output into a super-efficient SBM model to measure the GTFP, aligning with sustainable development policies promoted by many countries and providing a more accurate representation of China’s modernizing economy. Since counties are fundamental units of Chinese administration and crucial for promoting green development, measuring county-level GTFP is a more holistic and scientific approach. Secondly, studying the relationship between urbanization and ALT on GTFP at the county level allows for larger sample sizes, improving the reliability and robustness of estimation results. Furthermore, regional disparities in economic development, environmental factors, and levels of urbanization make county-level research on the impacts of urbanization and ALT on GTFP a valuable resource for policy formulation. Thirdly, this study includes urbanization, ALT, and GTFP in the same analytical framework and empirically analyzes the moderating effect, mediation effect, lagging effect and heterogeneity effect of urbanization and ALT on GTFP. This analysis not only complements existing research but also enhances our understanding of the complex relationships among these variables.
Mechanism Analysis and Variable Description
Mechanism Analysis
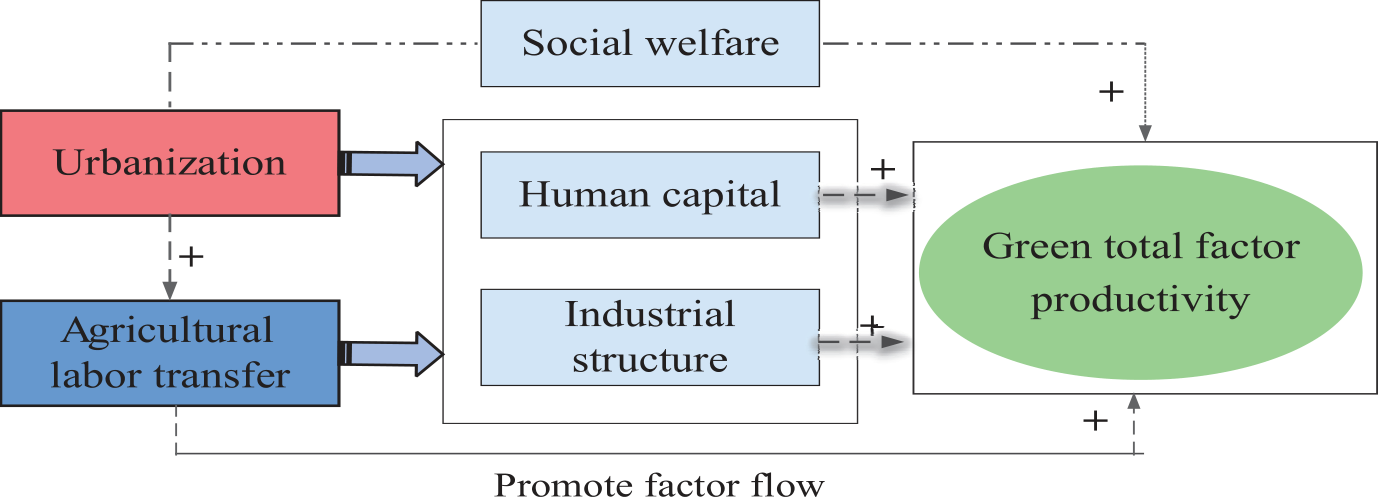
Firstly, urbanization impacts GTFP primarily in three dimensions. Firstly, accelerating urbanization can drive industrial growth and enhance urban capacity while mitigating surplus labor in rural areas by fostering secondary and tertiary sectors with an influx of rural laborers, which alters the demographic composition of cities and enriches urban human capital. Concurrently, as employment shifts from primary to secondary and tertiary sectors, it catalyzes a restructuring of industrial patterns and augments the overall economy. The decline in primary sector employment and the rise in secondary and tertiary sector employment facilitate industrial structural transformation. This gradual evolution of industrial composition leads to an expansion in the overall economy, thus enhancing GTFP.
Secondly, urbanization creates favorable conditions for the transfer of education resources and infrastructure to rural areas [39, 40], thus improving farmers’ quality of life and reducing cultural poverty [41]. The accumulation and optimization of human capital not only fuel economic growth [42], but also drive technological advancements through knowledge diffusion and competition, ultimately influencing GTFP. Moreover, urbanization serves as a catalyst for the rapid growth of industries associated with agricultural production. The integration of advanced production factors, such as production equipment, techniques, and skilled labor, into agricultural production in a market-driven manner has promoted technological progress in agriculture and improved efficiency. It facilitates the optimal allocation of resources, leading to an overall increase in the GTFP.
Thirdly, urbanization has improved the infrastructure and public services in rural areas [43], which can improve the life quality of farmers and the quality of agricultural production [44]. Consequently, urbanization has significantly spurred local economic development. In addition, with the rapid expansion of China’s urban scale, the infrastructure and social security between regions have also greatly improved. These improvements generate economic externalities in cross-regional economic activities, fostering technology exchange, research, and innovation among different areas, which can promote the coordinated development of the regional economy. These have become a key factor in the GTFP. The essence of China’s new urbanization is to pursue a green residential environment, the protection of ecological and resource environments, and the scientific and rational use of these resources. This makes the cities have a spillover effect, which can further improve the GTFP of surrounding regions.
The impact of ALT on GTFP is mainly reflected in the following aspects: the flow of rural labor can promote the recombination and distribution of agricultural production factor input structures. Compared with the secondary and tertiary industries, agricultural production is an economic activity with high input and low output; however, rural laborers who use their spare time to work outside can boost their income, which in turn increases the input of agricultural production factors [45]. This consequently leads to an increase in agricultural output value. The flow of agricultural labor can change the original production mode of farmers and facilitate the development of agricultural production towards intensification and scale [46]. Additionally, it can reduce the waste of resources that may arise due to land circulation. Reducing constraints on agricultural production funds and facilitating the transfer of capital and other input factors into agriculture can effectively compensate for labor shortages, leading to improvements in agricultural production conditions. Such transfers can also help address China’s “three rural’’ problems and promote the successful implementation of the country’s rural revitalization strategy [47]. Additionally, advancements in agricultural science and technology can decrease labor costs, encourage more involvement of labor in modern agriculture, accelerate urbanization, and replace traditional forms of labor with new agricultural technology, which can drive greater scale efficiency and further enhance GTFP. The theoretical framework diagram is shown in Fig. 1.
Variable Description
Dependent variables: Green total factor productivity (GTFP); the dependent variable of this paper is GTFP. Referring to previous studies [48-50], this study uses a non-expected super-efficiency SBM model to calculate GTFP. Input variables include labor force, land, and investment; labor force is expressed by employees at the end of the year, land is expressed by the land area of the administrative region, and investment is represented by the capital stock with the consulting calculation method of Shen et al. [51]. The output is divided into expected output and non-expected output; the expected output is represented by the gross regional product converted by the price index, and the non-expected output is represented by the PM2.5 generated by the region.
Core explanatory variables: Urbanization (Urban); the core explanatory variable is urbanization, which is represented by the ratio of the regional urban population to the total population in this paper. The other explanatory variable is ALT (Agrlt), which is expressed by the ratio of the number of non-agricultural employees to the total number of employees in this study.
Regulating variable: Welfare (Welfa); the adjusting variable is social welfare, which is represented by the ratio of the beds number of social welfare adoptive units to the area.
Moderator variable: On the basis of reference to relevant literature [52, 53], some factors are selected that may affect GTFP as control variables, including financial self-sufficiency rate (Fissr), financial level (Finan); industrial structure upgrading (Indsu); industrialization level (Inion); and human capital level (Humca). Fissr is represented by the ratio of local general budget revenue to local general budget expenditure; Finan is represented by the ratio of the loan balance of financial institutions at the end of the year to GDP; and Indsu is represented by the ratio of the added value of the tertiary industry to the added value of the secondary industry; Indsu is expressed by the ratio of the total output value of industries above the designated size to GDP; and Humca is expressed by the ratio of the number of students in primary and secondary schools to the total population at the end of the year. The description of the relevant variables is shown in Table 1.
Methodology and Data
Super-Efficiency SBM
There are several methods commonly used to measure the efficiency of green development, including the Solow residual method, stochastic frontier analysis (SFA), and data envelopment analysis (DEA). However, the Solow residual method requires pre-setting of the production function equation [54], and SFA is only suitable for situations with a single output, making it difficult to handle economic systems with multiple inputs and outputs [55]. Compared to these methods, DEA has advantages in that it does not require any function relations in advance, nor does it require standardized data. It is also capable of simultaneously dealing with multiple inputs and outputs [56], making it an appropriate method for measuring green development efficiency. Nevertheless, the traditional DEA model does not take into account the flexibility of input and output variables and fails to accurately measure efficiency when non-expected outputs are present [57, 58]. The SBM model incorporates relaxation variables into the objective function and uses non-radial and non-angular measurement to effectively address the relaxation problem of input-output variables [59]. Therefore, using the SBM model is recommended for accurately measuring green development efficiency. In this model, it is assumed that there are n decision-making units (DMU), and X and Y are the input and output index matrix, where xij represents the i-th input of DMU, and yrj represents the r output of DMU. The SBM model setting is shown in Eq. (1).
Table 1.
Statistical description of variables.
In Eq. (1), where ρ* is the efficiency value of the evaluated DMU in the SBM model, and its value range is greater than 0 and less than 1. Where S- and S+ represent the relaxation of input and output, respectively, and Xλ and Yλ are the input and output volumes on the front edge, respectively. It is worth noting that with the highest value measured by the SBM model, it is impossible to further compare the DMU with an efficiency value of 1, while the efficiency value measured by the super-efficiency SBM model can be greater than 1, which can effectively improve the comparability between effective DMU. The traditional TFP only focuses on the expected output, which is the positive effect of production factor input, but it ignores the negative impact on the environment [60, 61]. In order to objectively reflect the degree of green economy development, it is necessary to consider the cost of resources and the environment when measuring the real production efficiency, so this study calculates the GTFP of the counties in China from 2001 to 2020 by using the super-efficiency SBM model while considering the non-expected output.
Spatial Correlation Analysis
Exploratory spatial data analysis (ESDA) is supported by spatial analysis, it usually emphasizes the spatial relevance of economic activities. The spatial autocorrelation studied in this paper is an extension of ESDA, it is a measure of spatial aggregation, including global spatial autocorrelation and local spatial autocorrelation. Global spatial autocorrelation describes the spatial features of a geographical phenomenon or an attribute in an area [62], and it is used to judge whether the phenomenon or attribute value has aggregation characteristics in space [63]. The most commonly used indicator is Moran’s I, which can reflect the degree of aggregation of a regional variable on different scales. The mode of global spatial autocorrelation is shown in Eq. (2).
In Eq. (2), where yi and yj represent the observed values of the i region and the j region, respectively, N is the number of spatial units, and Wij is the spatial weight matrix. When counties i and j are adjacent, Wij = 1; If not, then Wij = 0. The range of Moran’s I is [−1, +1]. If Moran’s I is significantly greater than 0, it means that there is a positive spatial correlation, and the closer the value is to 1, the more things with similar attributes gather together. If Moran’s I is significantly less than 0, there is a negative correlation. If Moran’s I is equal to 0, it is spatially irrelevant.
According to Tiefelsdorf [64], the limitation of global Moran’s I is its inability to examine spatial clustering characteristics across regions. To address this shortcoming, local Moran’s I is introduced and can effectively identify spatial dependence between a specific area and its surrounding regions [65]. For this reason, we employ local Moran’s I to investigate the spatial aggregation relationship of GTFP. The formula for local Moran’s I is presented in Eq. (3).
If the value of Moran’s I is positive, it indicates that there is significant spatial clustering around the area unit with similar data values. Conversely, if the value of Moran’s I is negative, it implies that there is spatial clustering, but the values are dissimilar around the regional unit. The strength of spatial proximity increases with higher values of Moran’s I.
Empirical Framework
In order to analyze the effect of urbanization and ALT on GTFP, the bidirectional regression model is used for analysis, and the following model is constructed:
In Eq. (4), where GTFP is the dependent variable, which refers to green total factor productivity. Where i and t represent the i-th county (city, district) and the t-th year, respectively, Urban is the core explanatory variable, which refers to the urbanization rate. Control represents a series of control variables, including financial self-sufficiency rate, financial level, industrial structure upgrading, industrialization level, and human capital level. Where a0 is a constant term, β1 is the coefficient of the urbanization rate variable, βX is the coefficient of a series of control variables, ui is the individual fixed effect, λt is the time fixed effect and εit represents the error term. In order to explore the impact mechanism of urbanization on GTFP, the intermediary effect model is established, as shown in Eq. (5).
In Eq. (5), where Mit represents the intermediate variable and the interpretation of other variables is the same as that in Eq. (4). In order to study the regulatory effect of urbanization and ALT on GTFP, the following model is constructed in Eq. (6).
(6)
Where Welfait is the regulating variable, which refers to the social welfare level, where Urbanit⋅Welfait is the interaction term between Urbanit and Welfait, and Agrltit⋅Welfait is the interaction term between Agrltit and Welfait, the meanings of other variables can refer to Eq. (4). Assuming that urbanization is positive significant for GTFP, when the estimation coefficient of the interactive term Urbanit⋅Welfait is positive, which means that the derivative of the explanatory variable is positive, and Welfait can positively adjust the relationship between urbanization and GTFP. If the coefficient of the interaction term Urbanit⋅Welfait is negative, it indicates that Welfait weakens the positive effect of urbanization on GTFP.
Data Sources
Considering the availability of data, the data used in this paper come from the China County Statistical Yearbook, the China County Economic Statistical Yearbook (county and city volume), the statistical yearbooks of relevant cities, the CEIC database, and the EPS database. Some county-level data are deleted owing to serious loss of some variable data; for data that is not seriously missing, we use the linear interpolation method to supplement them and manually sort out 2536 county-level data in 20 years for the study. The county PM2.5 data is from the latest remote sensing data on China’s surface PM2.5 released by the Dalhousie University Atmospheric Composition Analysis Group in Canada. The annual average of PM2.5 in Chinese counties is extracted by ArcGIS software.
Empirical Analysis
The Measurement of GTFP
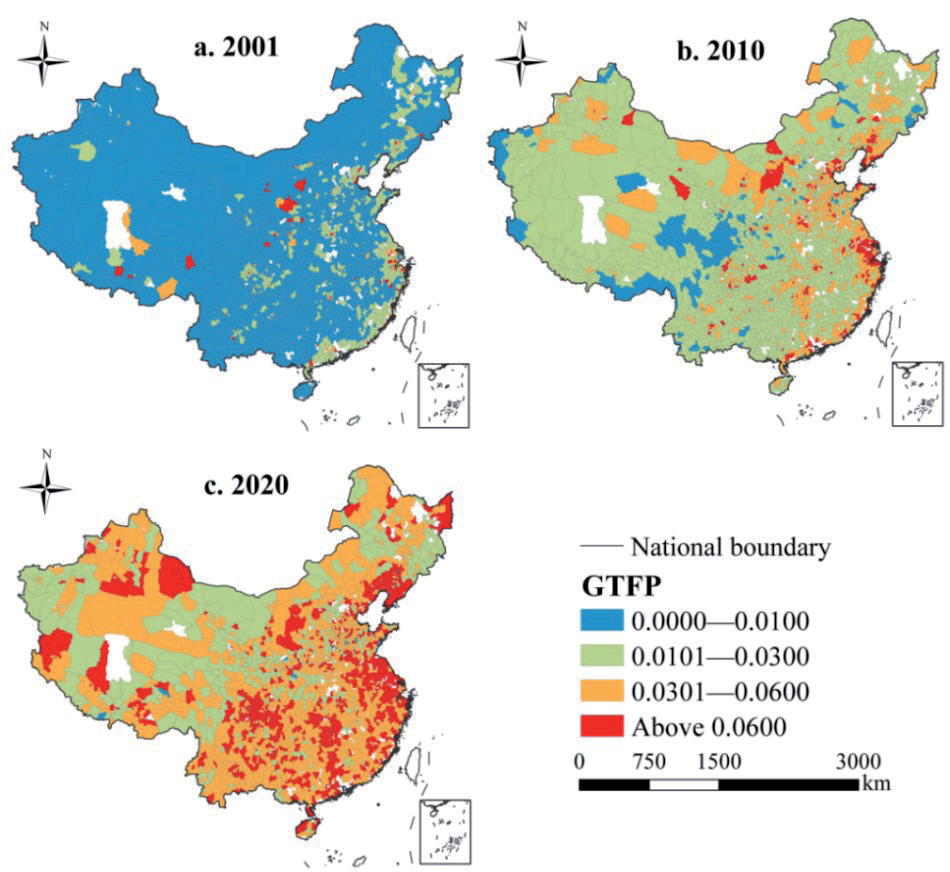
In this study, the non-expected super-efficiency SBM model is used to measure the GTFP of the counties in China, and the time series changes of GTFP from 2001 to 2020 in China are plotted, as shown in Fig. 2. In addition, this paper uses ArcGIS software to plot the spatial distribution of GTFP in each county in China in 2001, 2010, and 2020. The results are shown in Fig. 3.
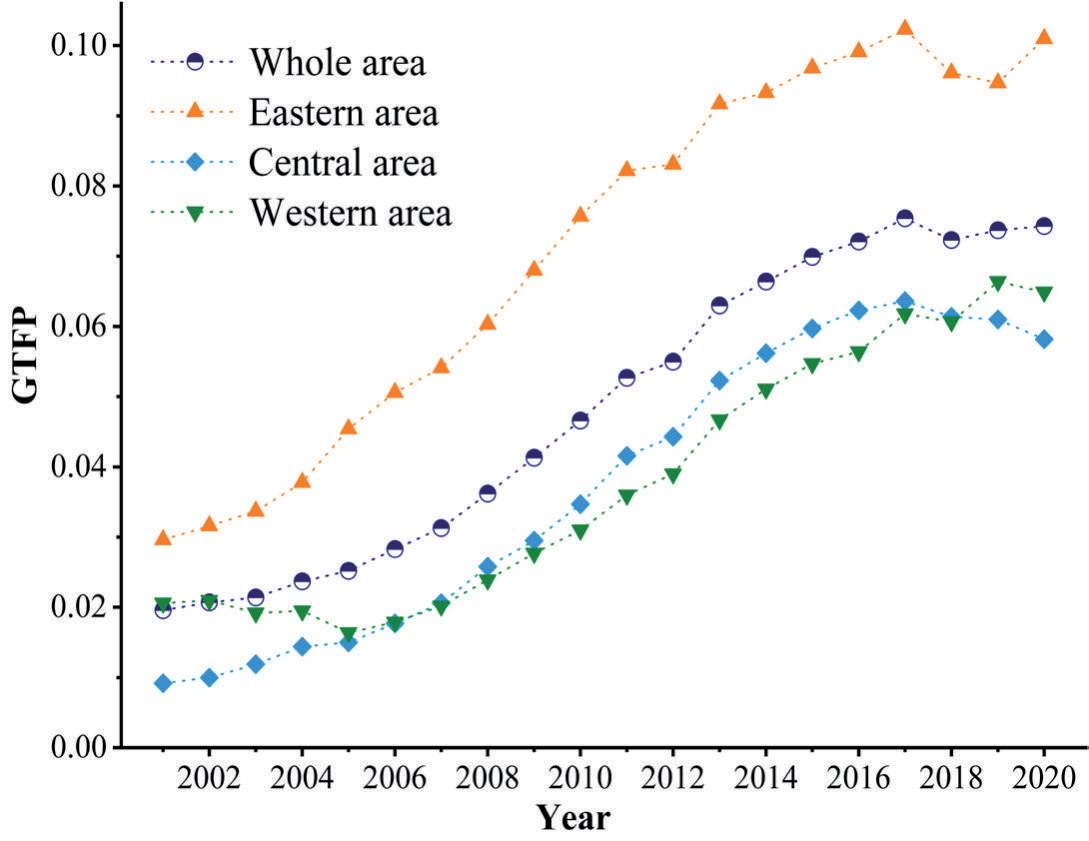
It is evident that China’s county GTFP has exhibited a consistent upward trend between 2001 and 2020. The GTFP for China’s county was recorded at 0.0196 in 2001, whereas it stood at 0.0743 in 2020, indicating an impressive increase of 278.34%. The county GTFP reached its highest value in 2017. Notably, the pattern of change in GTFP across the entire area was essentially the same, encompassing eastern, central, and western China. The GTFP in the eastern area is higher than that in the western and central regions of China, while the GTFP in the western region of China was higher than that in the central region from 2001 to 2005. In addition, the gap between GTFP in eastern China and that in central and western China is increasing year by year from 2001 to 2011. However, this gap has been in a relatively stable range since 2011.
By comparing the spatial distribution of those counties’ GTFP in 2001, 2010, and 2020, it can be seen that the GTFP of most counties in China has significantly improved over the past 20 years; the GTFP of most counties in China was less than 0.01 in 2001, and that of the most eastern coastal regions was essentially greater than 0.01 but less than 0.03. However, there are few regions where GTFP is higher than 0.06, and the distribution is scattered; it is mainly distributed in Shanghai and Zhejiang Province. The GTFP of most counties in China was in the range of 0.01~0.03 in 2010. The low value areas of GTFP also decreased in 2010, where they were concentrated in Sichuan Province. However, certain eastern coastal regions had a significant increase, with GTFP surpassing 0.06, a notable improvement compared to 2001. The GTFP of most counties in China was above 0.03 in 2020; it can be easily found that the GTFP of the southern region is greater than that of the northern region.
Spatial Correlation Analysis of GTFP
The global Moran’s I of GTFP in China’s counties in 2001, 2010, and 2020 is shown in Table 2. Tt indicates that Moran’s I is positive and the P value is less than 0.01, indicating a significant correlation at a 1% level between GTFP and geographic location. This suggests that there is a noteworthy clustering pattern of high-high values and low-low values in GTFP across China. However, to better understand the spatial characteristics of GTFP in China’s counties, it is necessary to utilize the local Moran’s I analysis method.
Table 2.
Global Moran’s I of GTFP in China’s counties.
| Year | Moran’s I | P value | Z statistics | Variance |
|---|---|---|---|---|
| 2001 | 0.0815 | <0.0001 | 21.2242 | <0.0001 |
| 2010 | 0.4190 | <0.0001 | 105.4821 | <0.0001 |
| 2020 | 0.0310 | <0.0001 | 16.5023 | <0.0001 |
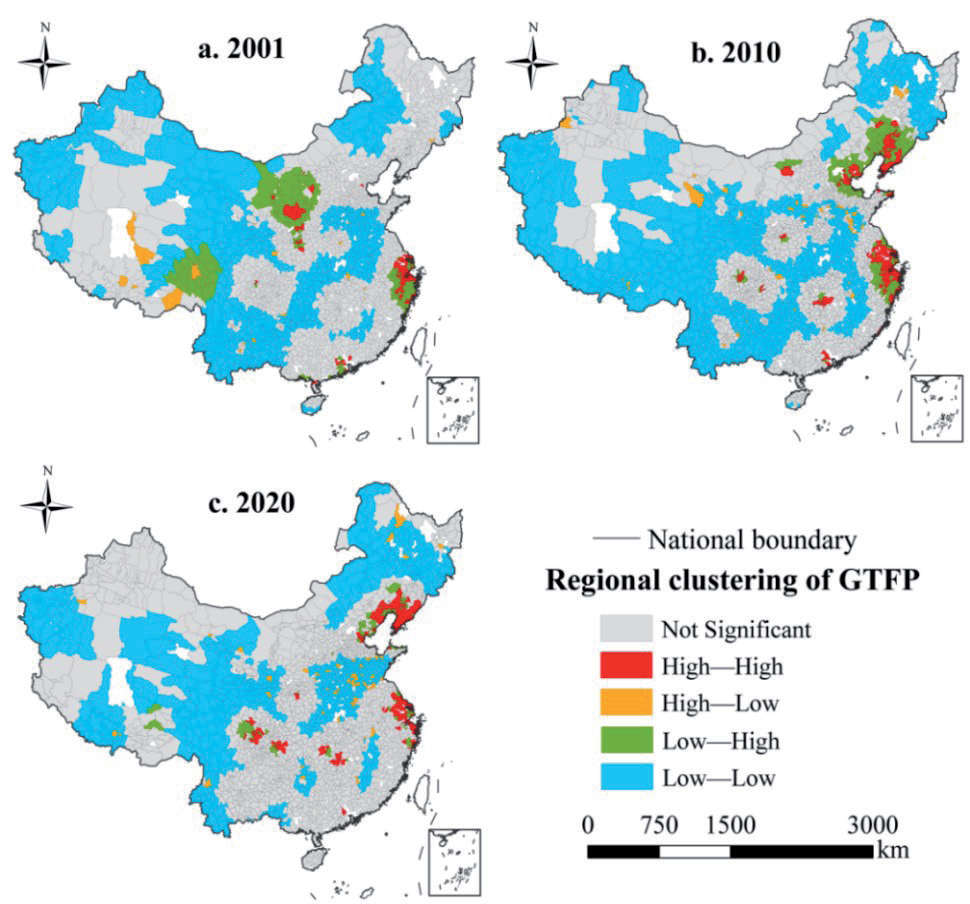
The spatial agglomeration distribution of GTFP in China’s counties is shown in Fig. 4. Generally, the low-low group is widely distributed; it is mainly concentrated in the western and central regions of China, which means that the level of GTFP in these counties is low, and the surrounding areas are also low. Especially, the low-low group in 2020 is relatively concentrated in the northeast and southwest of China, and the number in 2020 has decreased compared with that in 2010 and 2001. Conversely, the high-high group is primarily situated in eastern China; specifically, the high-high category of GTFP is distributed in southeast coastal areas such as Shanghai, Jiangsu, and Zhejiang in 2020. Additionally, these high-performance areas are found along the coastlines of Beijing, Tianjin, Hebei, and the southern region of Liaoning. These regions represent developed areas in China where the environmental infrastructure plays a significant role, with positive effects exhibiting spatial diffusion. However, the number of high-low category and low-high categories is small; they are widely distributed.
Benchmark Regression
This study employs the bidirectional fixation effect model to conduct benchmark regression analysis and validate pertinent assumptions. Table 3 displays the regression results, with GTFP as the explained variable in columns (1) and (2) and the logarithm of GTFP in columns (3) and (4). The findings of columns (1) and (3) suggest that urbanization has a significant and positive impact on GTFP without considering control variables. Moreover, the regression outcomes depicted in columns (2) and (4) reveal that the positive effect of urbanization on GTFP remains robust after incorporating control variables. Regarding the control variables, the study indicates that fiscal self-sufficiency rate, industrial structure upgrading, and human capital level are positively and significantly related to GTFP. Conversely, financialization and industrialization have a negative and significant association with GTFP. Although industrial development can stimulate economic growth, it also results in the emission of pollutants into the environment, leading to unexpected outputs. Therefore, industrialization is negatively associated with GTFP.
Analysis of the Conduction Mechanism
This section aims to provide a clearer economic rationale for the significant role of urbanization in promoting GTFP. Specifically, an intermediary effect model is used to verify the impact pathway of urbanization on GTFP. In view of the theoretical analysis presented earlier, the outcomes of this verification process are presented in Table 4.
Table 3.
Benchmark regression results.
Table 4.
Regression results of conduction mechanism.
Table 4 presents the results of the impact mechanism test, with ALT as the intermediary variable. Without the inclusion of control variables, the coefficient of ALT for GTFP is 0.0094. The 1% significance test indicates that ALT effectively promotes the enhancement of GTFP. In column (4) of Table 4, the coefficient of urbanization on ALT is 0.1146 and passes the 1% significance test. It is evident that ALT significantly accelerates the urbanization process. According to the results of column (5) in Table 4, urbanization, and ALT are positively significant for GTFP. With the addition of control variables, urbanization and ALT are still positively significant for GTFP. In addition, it can be found that the coefficient of urbanization for GTFP in column (5) is 0.0195, which is positive significant, but less than 0.0207 in column (1). The above results show that ALT plays a partial intermediary effect on GTFP, which means that urbanization can promote the GTFP of the region by promoting ALT. The process of urbanization frequently brings about enhanced educational resources, leading to an improvement in the educational attainment of rural inhabitants and broadening their access to non-agricultural employment opportunities [39]. Furthermore, urbanization fosters the creation of more job openings in manufacturing, service, and other non-agricultural fields, drawing rural laborers to migrate to urban areas in pursuit of more secure employment prospects [45]. The shift of agricultural labor can facilitate the enhancement of environmental total factor productivity by advancing agricultural modernization, structural adaptation, business growth, workforce development, and policy reinforcement.
Analysis of the Hysteresis Effect
This section aims to further investigate whether urbanization has a lagging effect on GTFP and whether there exists a potential issue of causal inversion in the model, specifically whether GTFP might negatively affect urbanization development. Therefore, the study incorporates lag processing on relevant data to assess whether urbanization could influence GTFP within the subsequent one or two years. The findings in columns (1) to (4) of Table 5 suggest that urbanization consistently exerts a positive and significant impact on GTFP, regardless of the lag period (one or two years) or the presence of control variables. Furthermore, the regression results of columns (5) to (8) present ALT on GTFP with lag periods of one year and two years. These results demonstrate that ALT continues to exhibit a notably positive effect on GTFP, regardless of whether the lag is one year or two years, with the coefficient being higher for the two-year lag compared to the one-year lag.
Robustness Test
1. Adjust the sample time duration. In order to analyze whether the effect of urbanization and ALT on GTFP changes with different sample intervals, this study excluded the first three years and the last three years of the original study period. The new analysis focused on the period from 2004 to 2017 and the relevant findings are detailed in columns (1) and (2) of Table 6. The results indicate that the influence of urbanization and ALT on GTFP remains consistently positive and significant even with adjustments to the regression sample duration, thus affirming the stability of the initial benchmark regression outcomes.
Table 5.
Lagging regression results of urbanization.
2. Change the regression method. The previous regression analysis used bidirectional fixation effects to conduct the correlation test. To ensure the credibility of the findings, a random effect model was employed for the regression analysis, and its results are shown in columns (3)-(4) of Table 6. The regression coefficients of urbanization and ALT on GTFP indicate statistical significance at a confidence level of 1%, with values of 0.0317 and 0.0156, respectively. This result suggests that the assertion that urbanization and ALT have a significant positive impact on GTFP remains valid.
3. Change the sample. As the urbanization rate of Shanghai, Beijing, Tianjin, Guangdong, and Jiangsu is relatively high, and the economic level is relatively developed, this may affect the findings of this study. In order to verify the universality of urbanization and ALT in promoting GTFP, the sample of Shanghai, Beijing, Tianjin, Guangdong, and Jiangsu is removed. The regression analysis of county-level regions in other provinces is shown in columns (5) and (6) of Table 6. It shows that urbanization and ALT still play a significant positive role in GTFP at the 1% confidence level. To sum up, the conclusion asserting the positive impact of urbanization and ALT on promoting GTFP remains valid and robust following the exclusion of county-level data from these provinces.
Moderating Effect
The pivotal role of social welfare in the era of harmonious development is crucial to social production. This study has chosen social welfare as the moderating variable for urbanization and ALT, affecting GTFP. The findings presented in Table 7 reveal that the coefficients of urbanization and social welfare are 0.0169 and 0.0044, respectively, passing the significance level of 1%. Moreover, the interaction between urbanization and social welfare is significantly positive at the 1% level, indicating that social welfare exerts a positive regulatory effect on the relationship between urbanization and GTFP.
In columns (3) and (4) of Table 7, the regression coefficients of ALT and social welfare are both positive and significant at the 1% level. Additionally, the coefficient of the interaction between ALT and social welfare is 0.0044 and significantly positive at the 1% level, signifying that social welfare also positively regulates the relationship between ALT and GTFP.
Heterogeneity Analysis
Considering the unbalanced economic development of the county-level regions in China, urbanization and ALT have a heterogeneity effect on GTFP at different economic development levels. Based on the median per capita GDP (PGDP) in 2020, this study divides all samples into low PGDP and high PGDP. Regression analysis of urbanization and ALT on GTFP is conducted in these two groups, respectively, and the results are shown in Table 8. It is indicated that urbanization has a significant positive impact on GTFP in both low PGDP and high PGDP; furthermore, urbanization has a higher impact on GTFP in the high PGDP group than that in the low PGDP group. The coefficients of ALT on GTFP in the low PGDP group and the high PGDP group are 0.0029 and 0.0087, and the latter is positively significant at the level of 1%, which indicates the effect of ALT on GTFP in the high PGDP group is higher than that in the low PGDP group.
Due to different information technology (IT) levels, the impact of urbanization and ALT on GTFP may be different due to different IT levels. Therefore, it is necessary to do group regresses according to IT levels in this study. Specifically, this study divides all samples into low IT groups and high IT groups based on the median IT level in 2020. The IT level is represented by the ratio of the number of fixed telephone users to the total number of households at the end of the year. The heterogeneity results of urbanization on GTFP are shown in columns (3) and (4) of Table 8, which show that urbanization has a positive and significant relationship with GTFP in the low IT group, but urbanization has no impact on GTFP in the high IT group. The results of columns (7) and (8) in Table 8 show that the coefficients of ALT to GTFP in the two groups of samples are 0.0132 and 0.0059, and they pass the significance level of 1%, which shows that ALT in the low IT group can promote GTFP more than that in the high IT group.
Table 6.
Heterogeneity test results.
Table 7.
Moderating effect test.
Table 8.
Results of the heterogeneity test.
Discussion
The Distribution and Reasons for GTFP in Different Regions
According to a recent study, China’s GTFP has shown gradual improvement, which aligns with the findings of Yu et al. [66]. However, their research focused on a municipal level analysis. China’s economic growth has rapidly expanded since the turn of the 21st century, leading to a positive impact on GTFP. The county-level GTFP has grown significantly, from 0.0196 in 2001 to 0.0630 in 2013. However, this increase in economic growth has also resulted in increased resource utilization and environmental pollution, as stated by Xiong & Xu [67], which can inhibit the improvement of GTFP, causing a slowdown after 2013. Furthermore, it is notable that Eastern China has experienced higher GTFP compared to Central and Western China. The primary reason behind this disparity is the comparatively better economic development and advanced technological innovation in Eastern China. This has enabled the region to develop a more efficient and cleaner model for economic growth, leading to substantial GTFP growth. Thus, it is crucial for Central and Western China to narrow the gap with Eastern China and promote high-quality and coordinated regional development to achieve parity.
Speeding Up the Transfer of Agricultural Labor to Stimulate GTFP
Speeding up the transfer of agricultural labor is an important way of stimulating GTFP through urbanization. Dong [68] proposed that urbanization can promote the transfer of the agricultural labor force, and Bie & Liu [69] believed that the transfer of the agricultural labor force can improve GTFP. Their findings support our conclusion. In general, as urbanization advances and industrialization speeds up and the fact that agriculture is an industry with high input and low output compared with the secondary and tertiary industries [70], it leads to the increasing absorption capacity of industry for rural surplus labor and increases the development of the industrial economy, the development of industry brings environmental pollution and has a negative impact on GTFP, this is consistent with the conclusion of this study. On the other hand, part of the agricultural labor force is being transferred to the tertiary industry, which is an industry with relatively low pollution emissions, which is conducive to the improvement of GTFP. To sum up, the number of non-agricultural employees increased while the rural surplus labor force decreased, resulting in the development of the secondary and tertiary industries [71], and the industrial structure has been upgraded. In conclusion, we found that the GTFP could be obviously improved by upgrading the industrial structure, so upgrading the industrial structure is also an important approach to enhancing the GTFP.
Heterogeneity Impact of Urbanization on GTFP
The group with higher economic development has a higher level of urbanization [72]. In this study, urbanization has a positive and significant impact on GTFP. Therefore, the coefficient of urbanization on GTFP is relatively high in the high economic development group and relatively low in the low economic development group. In addition, in economically developed areas, the income of farmers is relatively less than that of other industrial personnel, more agricultural labor shifts to non-agricultural industries, and the transfer of the agricultural labor force has a greater impact on the highly developed group. The effect coefficient of urbanization in the low IT group is significantly positive, but it has no impact on the GTFP in the high IT group. In recent years, with the implementation of the targeted poverty alleviation policy, the country should increase investment in the relatively backward areas in the west and improve various information infrastructures in the low IT areas in the west, which in turn has driven the development of urbanization. Therefore, there is a significant impact on urbanization in areas with low IT, while the impact on urbanization in areas with relatively advanced information infrastructure is not so strong, which may lead to a significant impact of urbanization on GTFP in areas with high IT.
Conclusions and Policy Implications
Conclusions
This study uses the super-efficiency SBM model to calculate the GTFP in China from 2001 to 2020 and analyzes the impact of China’s urbanization and ALT on GTFP. Firstly, the results show that the GTFP of China’s counties has significantly increased from 0.0196 in 2001 to 0.0743 in 2020. The GTFP in eastern China is significantly greater than that in central and western China, and this gap gradually increased from 2001 to 2011 and remained stable after 2011. The GTFP of most counties in China was below 0.01 in 2001, the GTFP of most counties was 0.03 in 2020, and the GTFP in the south of China is greater than that in the north in 2020. Secondly, urbanization has a significant promotion effect on the growth of GTFP, urbanization plays an important role in improving GTFP by promoting the transfer of rural surplus labor to cities and perfecting the optimal allocation of production factors. The higher the level of social welfare, the stronger the role of urbanization and ALT in promoting GTFP. Thirdly, urbanization and ALT have a lag effect on GTFP, this means that they have a promoting effect on GTFP in the long run. In addition, there are regional differences in the promotion effects of urbanization and ALT on GTFP. In areas with high PGDP and low IT, the effect of urbanization and ALT on GTFP is more obvious.
Policy Implications
The swift expansion of urbanization has emerged as a crucial catalyst for China’s economic advancement, presenting substantial opportunities for attaining high-quality development. Additionally, it is pivotal in fostering the growth of total factor productivity. This study proposes various pertinent policy recommendations stemming from its findings.
(1) From the perspective of the development of GTFP in different regions of China, there is a significant gap between the development of GTFP in different regions. China should formulate differentiated strategies according to the gaps in different regions to achieve the coordinated development of the regional economy. For regions with a high level of economic development, such as the coastal areas in southeastern China, we should not only focus on high technology and clean energy, but also obtain more advanced green technology through the introduction of foreign investment. For the underdeveloped regions of China, such as the western region of China, it is necessary to strengthen the exchange of regional economic activities and give play to the innovation spillover effect of regions with high economic development. In the case of weak innovation capacity, the central and western regions have introduced advanced technologies to reduce production costs, reduce pollution, achieve “green production”, and promote the coordinated development of GTFP in the region.
(2) It is crucial to continue promoting green urbanization and strengthening the construction of new urbanization. China is currently at a crucial juncture in its history, where industrialization and informatization are deeply intertwined. Prioritizing an innovation-driven and coordinated strategy for sustainable development is imperative. To achieve this goal, it is essential to formulate tailored new urbanization strategies that suit China’s specific conditions. Population structure plays a pivotal role in new urbanization. Therefore, combining talent innovation with institutional innovation is vital to creating an appealing urban environment for high-quality labor, thereby accelerating the overall development of small and medium-sized cities. In regions with low urbanization levels, such as the western region, it is essential to invest in urban construction through pragmatic cooperation between the government and enterprises. Simultaneously, enhancing infrastructure and public service facilities in small towns is necessary to enhance their comprehensive service capabilities. Promoting economic and cultural exchanges between cities and towns is crucial for fostering cooperative development between urban and rural areas, ultimately improving residents’ quality of life and integrating urban and rural development. Additional measures include expediting the enhancement of the urban market mechanism, boosting urban residents’ consumption, efficiently developing land resources, and raising awareness of environmental protection among urban residents. These efforts collectively contribute to the enhancement of GTFP.
(3) It is essential to accelerate the integration of the labor market and promote the orderly flow of labor. With the improvement of the urban and rural economic structures, labor mobility has greatly increased. The research results show that ALT has a strong positive impact on GTFP, while the reduction of the rural labor force has not decreased agricultural production. In the face of rapid economic development and restructuring, we must speed up labor market integration, guide the orderly flow of labor, and continuously promote specialization and scaling in agricultural production. In promoting the transfer of surplus rural labor, we must not only focus on the development of China’s large cities but also pay attention to the development of small towns. In economically developed areas, large and medium-sized cities have reached their capacity for population absorption. Therefore, it is important to develop small towns and strengthen township enterprises to create more employment opportunities and absorb surplus rural labor. Additionally, we must vigorously develop secondary and tertiary industries in cities and towns. A good industrial structure is an important part of new urbanization construction, and the proportion of secondary and tertiary industries will largely promote the transfer of agricultural labor. China should leverage its abundant labor resources and natural environment to develop labor-intensive service industries, which can effectively provide job opportunities for surplus rural labor and drive overall economic growth.

