

Introduction
The global ecosystem is facing unprecedented challenges, with frequent climate extremes, ecological degradation, and environmental pollution becoming increasingly serious [1]. The concentration of carbon dioxide (CO2) in the atmosphere has surpassed 410 parts per million (ppm), a level not seen in approximately 800,000 years, according to 2019 global atmospheric monitoring data from the World Meteorological Organization [2]. Since the Industrial Revolution, the global average temperature has risen by approximately 1.1°C, significantly impacting the ecological environment. Consequently, reaching sustainable growth and the green transition requires cutting carbon emissions. The Chinese government attaches great importance to ecological environmental protection and has prioritized green development as a key focus of ecological civilization construction in the new era. In an effort to support sustainable development and the transition to a green economy, it has suggested the “3060” dual-carbon target (China aims to reach its CO2 emissions peak by 2030 and achieve carbon neutrality by 2060). With its wealth of natural resources and distinctive ecological functions, the Yellow River Basin (YRB) is an important economic area in China that contributes significantly to ecological security, stability, and socioeconomic development. The basin also has to deal with serious issues like pollution and soil degradation, which prevent the local economy and society from growing sustainably. The middle and lower reaches of the YRB, recognized for their comparatively high degree of economic growth, are pivotal components within the larger basin ecosystem. Nonetheless, these regions face significant challenges, including ecological environmental preservation and the imperative to modernize their industrial structures. Achieving high-quality development in the YRB, particularly through green and coordinated development in the mid-to-lower reaches under carbon emission constraints, has become a critical and urgent issue requiring immediate scholarly and practical engagement. Moreover, it serves as an assertive countermeasure to mounting international demands for energy conservation and emissions mitigation.
Incorporating principles of environmental stewardship and resource conservation, green development involves the mutual coordination of the economy, society, and environment. The goal is to achieve a harmonious symbiosis between high-quality economic development and environmental conservation. Scholarly investigations into green development can be traced back to the social-economic-natural composite ecosystem theory, first introduced by Chinese ecologist Shijun Ma in 1984 [3]. Additionally, Pearce introduced the concept of the “green economy” in 1989 [4]. The topic of green development has been the subject of numerous investigations in the literature in recent years. The first category of literature develops various assessment index systems by considering a wide range of factors, such as policy, ecological environment, scientific and technological advancements, economic conditions, social aspects, and environmental issues [5]. After that, researchers estimate the level of green development using a variety of comprehensive evaluation techniques [6, 7] and examine green development across diverse industries and locations [8, 9]. An additional category of literature focuses on investigating the linkages and influencing factors of green development. For instance, CO2 emissions, natural resource endowment, industrial structure, environmental legislation, and cutting-edge technology for sustainable development, among other factors, impact green development and interact with it [10, 11].
The YRB has become one of the most typical and representative regions in China’s inland areas, thanks to the continued rapid development of the economy and social progress. Research has long been concentrated on agriculture, crops, water resources, and the ecological environment, among other themes [12, 13]. However, as an emphasis on high-quality development, the lens of research has progressively refocused on the ecological level, industrial agglomeration, carbon emissions, ecological efficiency, and green development [14, 15]. In this context, studying the determinants of green development is essential for the strategic planning of high-quality development in empirical investigations of the YRB. The level of green development can be enhanced through various means, such as modifying the energy structure, providing strong support by green finance, upgrading and transforming green industries, etc. [16, 17]. Sustainable development may be hampered by the conflict between ecosystems’ carrying capacity and population growth [18]. Additionally, the rise in science and technology, along with the influx of foreign capital, may, to some extent, hinder green growth and sustainability [19].
Nine provinces constitute the YRB, which serves as a significant ecological barrier in China. As a whole, the middle and lower reaches have environmental and economic differences from the upstream region. In terms of the ecological environment, due to natural constraints, the upper reach of the YRB has considerably different ecosystem service functions from the middle and lower reaches. The upper reach is in the arid, semi-arid, and non-monsoon zones, where issues with land sanding and desertification pose serious threats to the distinctive natural environment. In contrast, the mid-downstream regions of the YRB benefit from a moist environment, fertile soil, and abundant water supplies, despite experiencing soil erosion. These areas play a crucial role in managing water resources, preserving biodiversity, and mitigating climate change. In terms of economic foundation, notwithstanding their abundance of natural resources, the upper reaches lack solid economic foundations and are geographically isolated, which contributes to a comparatively lower social-economic development. The middle and lower reaches contain the entire industrial center of gravity. Higher population density, a more advanced economy, significant industrialization, rapid urbanization, and an advanced transportation system are all characteristics of the middle and lower reaches. As a result, the state of sustainable development is significantly better than that of upstream, with a more intricate interaction between environmental and economic development [20]. In terms of green development patterns, the upstream region is also included in the socially focused green development paradigm. However, the more stable midstream and downstream areas are part of the “economic + social” driven development paradigm [21]. Significant spatial disparities are observed, exhibiting a stepwise decrease from the downstream region to the upstream region, with the pattern being “downstream > midstream > upstream” [22, 23]. Studying the green development status of the middle and lower reaches is crucial for comprehending the unique ecological and social-economic conditions of the YRB and formulating sustainable development strategies. These initiatives contribute to long-term prosperity and stability and serve as a valuable model for advancing green development within and beyond the YRB, inspiring nationwide replication.
The existing literature has yielded fruitful results on the green development of the YRB, broadening the scope and providing valuable assistance for the research in this paper. Further work can be done in the areas listed below: (1) The middle and lower reaches of the YRB are essential locations for high-quality development and ecological protection, and their development differs significantly from that of the upper reach. This paper contributes to the study of green development in the YRB by focusing on the mid-downstream regions as the research subjects while considering the completeness of administrative divisions. (2) While the “3060” dual-carbon target poses additional demands for green development, many studies fail to consider carbon emission restrictions when evaluating green development comprehensively. Therefore, this study constructs a green development index system under carbon emission constraints and applies a GPCA-EM model – integrating global principal component analysis (GPCA) and the entropy weight method (EM) – to evaluate green development levels scientifically and practically [24]. (3) Few studies offer a multilevel breakdown of spatial variations in green development. The majority of studies employ within-group and between-group difference decomposition techniques, such as the Theil index and Gini coefficient [25, 26]. We use the two-stage nested Theil [27] to measure the amount of differences at the watershed, provincial, and municipal levels. The study further identifies the causes of spatial disparities, which are crucial for achieving sustainable and coordinated growth and for driving the YRB’s progression toward high-quality development. (4) Researchers have thoroughly examined many variables influencing green development, but they have mostly concentrated on the overall impact effect rather than the dynamic effects of driving forces. By analyzing the annual weight variations, this article assesses the dynamic impact of the factors that propel green development. Beyond the dynamic comparative analysis of driving elements, the study adeptly avoids the endogeneity issue of the regression equation.
The primary contributions of this study to the existing literature are twofold. Firstly, we adopt a perspective centered on carbon emission constraints and employ the GPCA-EM model to provide a more scientifically rigorous and comprehensive portrayal of green development in the mid-to-lower reaches. Secondly, building upon the foundation laid by previous research, we undertake a detailed dissection of the sources of spatial disparities and are committed to the steady enhancement of green development through dynamic analysis of endogenous driving mechanisms. Consequently, our study not only makes a significant contribution to the exploration of green development paradigms in the mid-to-lower reaches but also plays a pivotal role in advancing high-quality development throughout the YRB. However, it is important to acknowledge certain limitations of our study:
(1) Due to the extensive scope of the indicator system, the influences of other social-economic determinants have not been explored. (2) Regarding the coordinated development of the mid-to-lower reaches, our analysis is limited to conventional geographical comparisons and lacks insights from alternative analytical angles. By situating our research within the grand narrative of global sustainable development strategies, we are able to offer research directions and green development models that are pertinent and adaptable to regions worldwide grappling with similar challenges.
The following are the remaining chapters: Data exposition and model construction are covered in Section II, along with information on data sources, indicator system building, GPCA-EM construction, and the two-stage nested Theil construction. The analysis and discussion of the results are completed in Section III. First, we analyze the temporal fluctuations and spatial distributions of the green development level. After comparing kernel density estimates, the dynamic evolution trend of the spatial differences in green development is displayed. Two-stage nested Theil is then used to break down the spatial disparities and pinpoint their origins. Lastly, the weight change comparison is used to investigate the dynamic effects of the green development drivers in the middle and lower reaches. Section IV explores methods for improving green development in the regions in light of the study’s conclusions. This section also lists possible directions for further research and points out gaps in the existing body of knowledge.
Data and Methods
Indicator System for Green Development
The assessment of green development status necessitates a comprehensive and systemic examination encompassing the urban economy, environment, and society. This study meticulously investigates both the social economy and the ecological environment. The social economy is characterized by “economic development” and “scientific and technological innovation”. The ecological environment is reflected by “resource utilization”, “environmentally friendly condition”, and “societal sustainability”. This paper draws on the green development index system jointly established by the National Development and Reform Commission (NDRC) and various ministries in 2016. Drawing upon numerous research findings on green development within the YRB and across China [21, 25], we have developed a green development index system that is constrained by carbon emissions. (Table 1). The subsequent exposition on the secondary indicator serves to highlight the rigorous scientificity employed in the construction of the index system, thereby fortifying its logical coherence and factual integrity.
Economic development is one of the key pillars of green development, driven by advances in science and technology. Green development is also based on environmentally friendly development that emphasizes the strength of urban environmental protection, raises the standard of waste reuse, and lowers emissions of pollutants. Enhancing the effectiveness of resource usage is a necessary condition for green development. Furthermore, improving sustainable development and mitigating the conflict between environmental carrying capacity and human density in the YRB depend heavily on societal sustainability. First, the study uses many indicators, such as GDP, the average wage of employed workers, the percentage of tertiary industry, the actual utilization of foreign capital, and trade statistics, to assess economic development in accordance with the aforementioned philosophy. Second, the number of patent applications, R&D staff, and expenditures on science and technology are indicators that show the contributions and accomplishments of the region’s scientific and technological innovation. Third, the effectiveness of environmental regulation is reflected in CUISW, while the city’s commitment to environmental protection is indicated by the ratio of environmental protection expenditure to GDP. Furthermore, the economic impact of pollutant emissions is demonstrated by industrial three-waste emissions per unit of GDP and CO2 emissions per unit of GDP. In addition to highlighting the regional characteristics and the state of the YRB’s water resources, resource usage is measured by total energy consumption, total water consumption for the entire society, and total water resources [13]. Lastly, elements that depict societal sustainability include the level of educational development, urban population density, the percentage of built-up areas covered by green space, and the number of buses per 10,000 people.
Table 1.
Indicator system of green development in the middle and lower reaches.
In our exploration of the deeper dimensions of green development, it becomes clear that limiting carbon emissions in terms of both their total volume and intensity is essential for China and other countries to achieve sustainable growth and environmental stewardship. The model of green development, which advocates for a low-carbon, efficient, circular, and sustainable economy, works together with the dual control targets for carbon emissions. In light of this, it is crucial to examine carbon emissions when evaluating the course of green development. Accordingly, this study aims to reflect the constraining influence of carbon emissions on green development by incorporating the “CO2 emissions per unit of GDP” into the green development evaluation index system. (1) By directly relating carbon emissions to the results of economic development, this indicator evaluates whether economic development occurs at the expense of the environment and whether it aligns with the principles of green development. (2) The inclusion of this metric curbs the escalation and practices of energy-intensive enterprises, motivating both businesses and the government to invest more resources into scientific and technological innovation. This effort will foster the development and application of low-carbon technologies. Such initiatives are crucial for developing low-carbon technologies, thereby advancing the cause of green development. (3) Reducing the amount of CO2 emissions per GDP unit helps to create a greener environment, improve air quality, and cut down on greenhouse gas emissions. (4) Typically, reducing CO2 emissions per unit of GDP signifies an increase in energy efficiency and resource recycling, which helps with waste reduction and resource optimization. (5) This indicator is strongly correlated with people’s social lives. It is also a crucial component of social greening, which includes promoting low-carbon lifestyles, supporting environmentally friendly travel and consumption, and others.
Data Sources
The introduction of the “Outline of Ecological Protection and High-Quality Development Plan for the YRB” (henceforth referred to as the “Plan”) in 2021 signaled the beginning of the basin’s next phase of development. We carried out extensive research using data from 2010 to 2020 in order to better comprehend the history and necessity of the “Plan”, as well as to get a complete picture of the trajectory of green development in the YRB given the data that was available. To guarantee the precision of economic metrics, the base period of 2010 is used for deflation. This can provide a more accurate representation of the true level of economic activity and remove the inflationary effect of price increases. The Provincial (Municipal) Statistical Yearbook (2011-2021), China Urban Construction Yearbook (2011-2021), and China Urban Statistical Yearbook (2011-2021) are the sources of the data used in this article. The State Intellectual Property Office’s website provides information on the quantity of patent applications. The China Urban Greenhouse Gas Working Group and the IPE (Public Environmental Research Center) have accumulated statistics on urban carbon emissions, from which the CO2 emissions data are collected [28]. When there are gaps in the data, the gray prediction model and linear interpolation use the mean value to fill in the gaps based on the real circumstances.
Methodology for Research
GPCA-EM Model
The GPCA model is based on the conventional principal component analysis. It overcomes the shortcomings of the diffusion index method in capturing cyclical swings by incorporating cross-sectional data with a temporal dimension [29]. The EM method is an objective weighting approach that determines weights based on the size of indicator variability. The GPCA-EM model combines the GPCA and EM, using the information entropy of the principal components as an assignment criterion to generate the composite index [24]. This approach addresses the shortcomings of the conventional principal component composite score [30]. The GPCA is used to reclassify the regional development index system, and the scores of each primary component are computed first. The final comprehensive values of the green development level are then calculated using the EM.
(1) Constructing a time-ordered stereo data table and normalizing data: X = {Xt∈Rm×p, t = 1, 2, ..., T} is a set of flat data tables arranged in chronological order, with identical sample points and variables placed in chronological order. Next, as shown below, the data is normalized.
Where r denotes the city (r = 1, 2, ..., n), s denotes the indicator (s = 1, 2, ..., m), and t denotes the year (r = 1, 2, ..., k), Xrst is the original value of the indicator s in the city and r in the year t, Xrst+ and Xrst+ are the normalized values, minxst and maxxst denote the minimum and maximum values of the s indicator.
(2) Determining the normalized data matrix’s correlation coefficient matrix, eigenvalues, and matching eigenvectors.
(3) Computing the matrix of factor loadings. The correlation coefficient matrix B = (brs) of Xrt with the principal component Fs needs to be found. The brs represents the loading of the variable r in Xr on the principal component Fs. The rotation method with maximum variance yields coefficients that can be used to explain which variables make up the majority of the principal component Fs.
(4) Calculating the regression coefficient for each principal component score.
(5) Calculating the proportion of the indicator r of the evaluation object s in the total by converting the data to be non-negative.
(6) Calculating the entropy value of the indicator r.
Where k>0, k = –1/ln(n), er≥0, k.
(7) Calculating the variability of the indicator r. When it comes to indicator r, the more variable the indicator value, the more valuable it is for program evaluation.
Where
(8) Calculating weights.
(9) Utilizing the GPCA-EM model to obtain a comprehensive score for the green development level.
Two-Stage Nested Theil Method
Based on the idea of entropy, the Theil index is a particular type of generalized entropy index. When breaking down within-group and between-group differences, it outperforms the Gini coefficient [31]. In the academic world, the Theil index has grown in importance as a measure of income inequality among people or areas. In this paper, we utilize the two-stage nested Theil to analyze the disparities of green development levels within and between provinces, as well as between the middle and lower reaches. We estimate their importance and rates of contribution to the total difference [27, 32].
Assuming that the mid-downstream regions, provinces, and cities are represented by r, s, k. Respectively, the disparities in the overall green development status can be measured by the following Theil index:
where xrsk is the green development level of city k in province s in region r,
Accordingly, the following metrics can be used to compare the differences in the overall state of green development:
Then T in Eq. (7) will be broken down into
Where Xr is the average level of green development of region r,
Therefore, the disparity T in green development across different regions is a combination of variations within each region and the difference between them.
Next, if we define disparities within each province Trs of the green development level for province s in region r as follows to measure:
Then Ti in Eq. (8) can be further decomposed into
Where
By substituting Ti in Eq. (11) into Eq. (9), we obtain T.
(12)
Equation (12) is the two-stage Theil index decomposition equation that separates the overall regional disparities in green development into the within-province differences (TA), the between-province differences (TB), and the between-region differences (TC). The within-province differences are represented as a weighted average of within-province differences (Trs), whereas the between-province differences are a weighted average of between-province differences (Tpi).
Results and Discussion
Spatial-Temporal Characteristics
Temporal Trend Characteristics
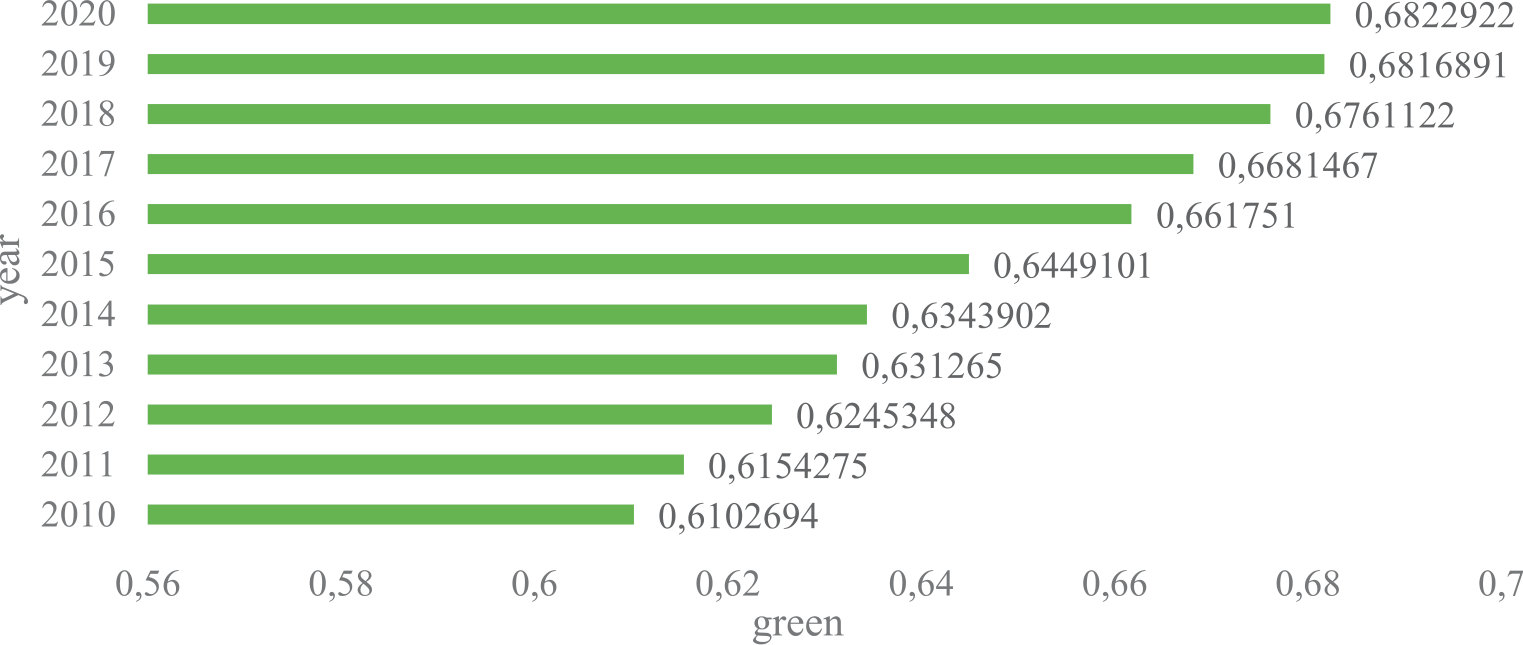
The level of green development in the middle and lower reaches is depicted in Fig. 1 as steadily rising between 2010 and 2020. This suggests that the economy and environmental protection are gradually being coordinated synchronously. Since 2011, the “12th Five-Year Plan” for National Environmental Protection has been implemented, with the goals of actively constructing an eco-friendly society, reducing major pollutants, and enhancing sustainable development. The YRB’s governments are aggressively balancing the environment and economy, giving higher priority to higher-quality economics and promoting green development. From a numerical standpoint, there are still many areas with low levels of green development. The greatest number is only 0.68, which is less than 0.70. While there has been progress in the green development of the middle and lower reaches of the YRB, there is still much room for improvement that requires immediate attention.
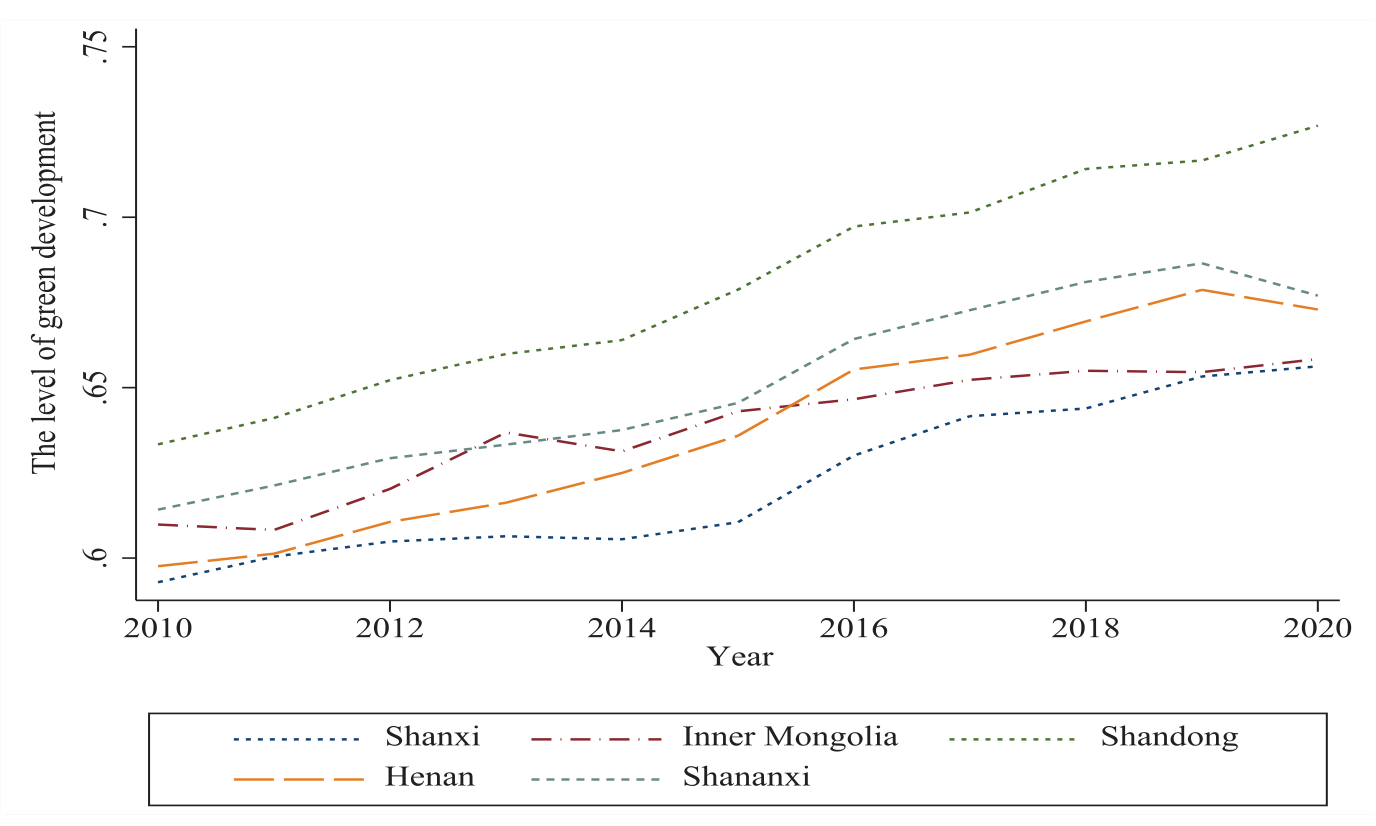
A time-series map of the green growth levels in the five provinces is created to further examine the unique circumstances (Fig. 2). The downstream region generally exhibits a higher level of green development compared to the midstream region, and the upward trend is more significant. Inner Mongolia exhibits slow and erratic features, whereas Shandong Province has experienced the fastest progress, followed by Shanxi, Henan, and Shaanxi provinces. With the exception of Shandong Province, the green development in the other four provinces has exhibited weakness over the last two years, with little increasing tendencies. Moreover, Henan and Shaanxi have seen a decline. The downstream region benefits from a comparatively higher level of social-economic development, which fuels the momentum for green development. Conversely, the economic landscape of the midstream region continues to be dominated by traditional sectors, including heavy industry, coal, and other resource-intensive industries, along with conventional farming and livestock practices that suffer from low productivity. Consequently, the transition and upgrading of these industries towards green development may progress at a slower pace. The COVID-19 pandemic has imposed limitations on domestic economic growth over the past two years [33], affecting the progress of green development initiatives in both midstream and downstream areas. Nevertheless, Shandong Province has consistently witnessed steady improvements in its green development levels. This progress can be largely attributed to its solid economic foundation, favorable geographic position, and continuous refinement of its industrial structure. The government has been fully committed to promoting the transformation between old and new kinetic energy, issuing the “Shandong Provincial New Energy Industry Development Plan (2018-2028)” in 2018. As of 2020, the output value of high-tech industries in Shandong constituted 45.1% of the total industrial output value among enterprises of scale.
Spatial Distribution Characteristics
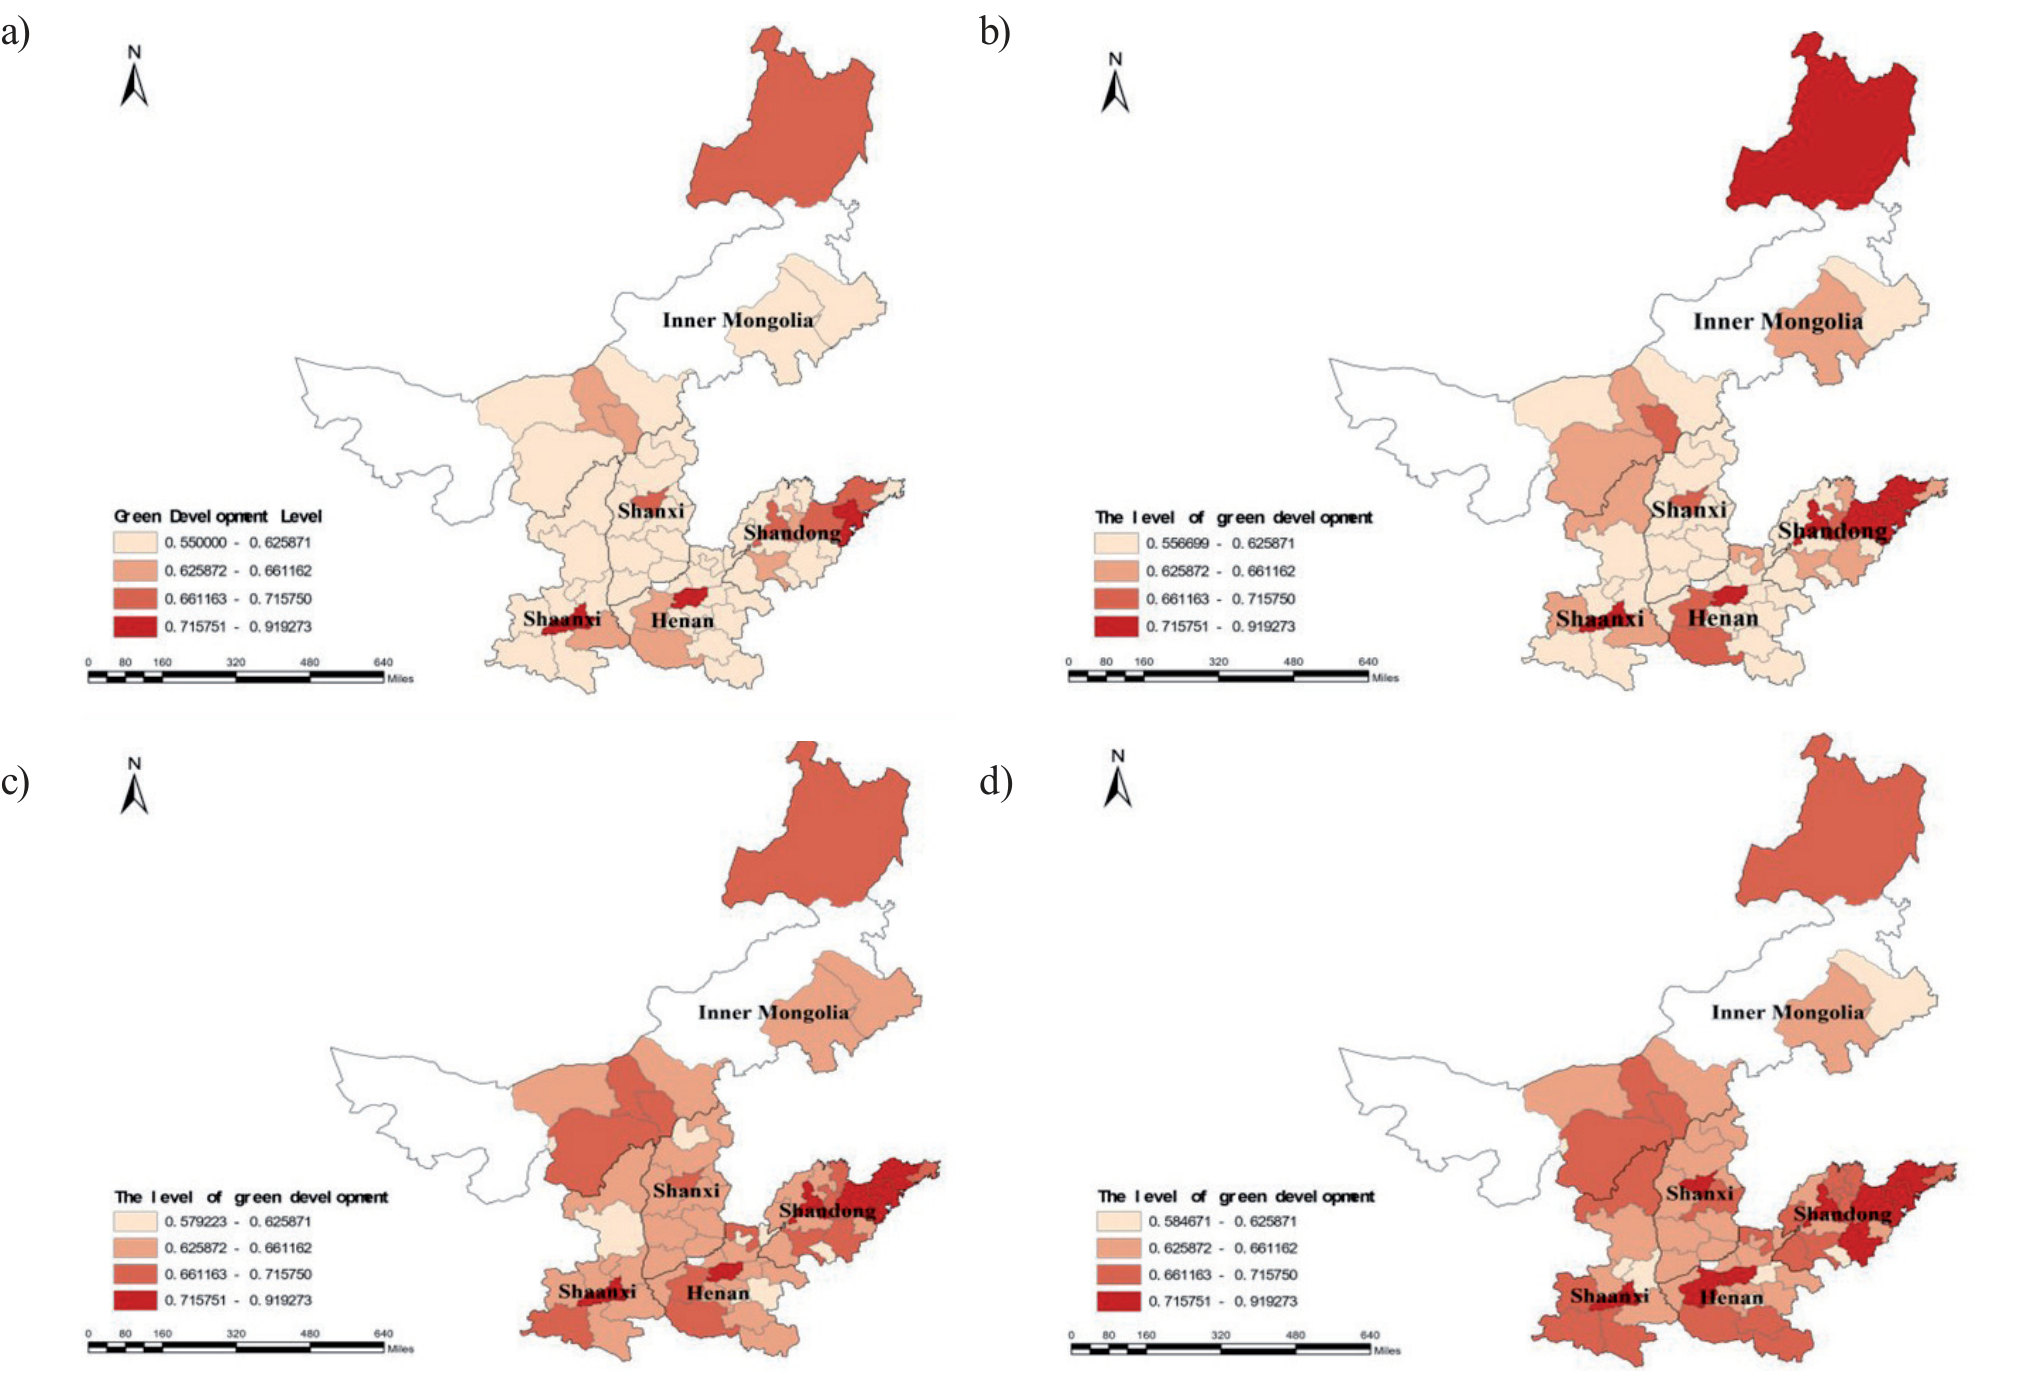
The spatial distribution of the mid-downstream cities’ green development level in 2010, 2014, 2017, and 2020 is plotted in this study using ArcGIS10.8 (Fig. 3). We categorize the green development level into four categories: low-level, relatively low-level, relatively high-level, and high-level zone, according to the 2017 categorization standard. Clear regional changes in the green development level can be observed in Fig. 3. As Fig. 3 shows, the number of cities in the high-level zone has increased from 3 to 10. The number in the relatively high-level zone has increased from 6 to 20. It has increased in the relatively low-level zone from 7 to 27. Moreover, there are now 6 cities instead of 48 in the low-level zone. The green development level is trending upward, as seen by the decline in low-level zones and the rise in high-level zones. There are noticeable spatial differences in the degree of green development between the middle and lower reaches of the YRB. With a typical north-to-south gradient, the lower reach has a higher overall level of green development than the middle reach. This is primarily because several midstream cities – whose economies heavily rely on mineral resources – are having difficulty modernizing and changing their industrial structures. These regions’ relative dearth of green resources and renewable energy has, in part, impeded their progress toward green development. Hulunbuir has continuously demonstrated superior green development. This may be because large cities have a trickle-down effect that promotes infrastructure development and economic growth. This has promoted green growth by strengthening the cities’ overall resilience [34].
Multi-Level Spatial Differences
In probability theory, one non-parametric technique for approximating unknown functions is kernel density estimation [35]. The kernel density estimation emphasizes the trend and local similarity of the spatial distribution, and the Theil index decomposition concentrates on the geographical distribution in inequality. First, we utilize a kernel density plot to present the dynamic evolution trajectory of the green development level in the middle and lower reaches from 2010 to 2020. Next, the spatial differences in green development are studied using the two-stage nested Theil. The statistical analyses of the spatial differences in the middle and lower reaches from 2010 to 2020 are shown in Fig. 4, Table 2, and Fig. 5.
Dynamic Evolutionary Trajectories of Spatial Disparities
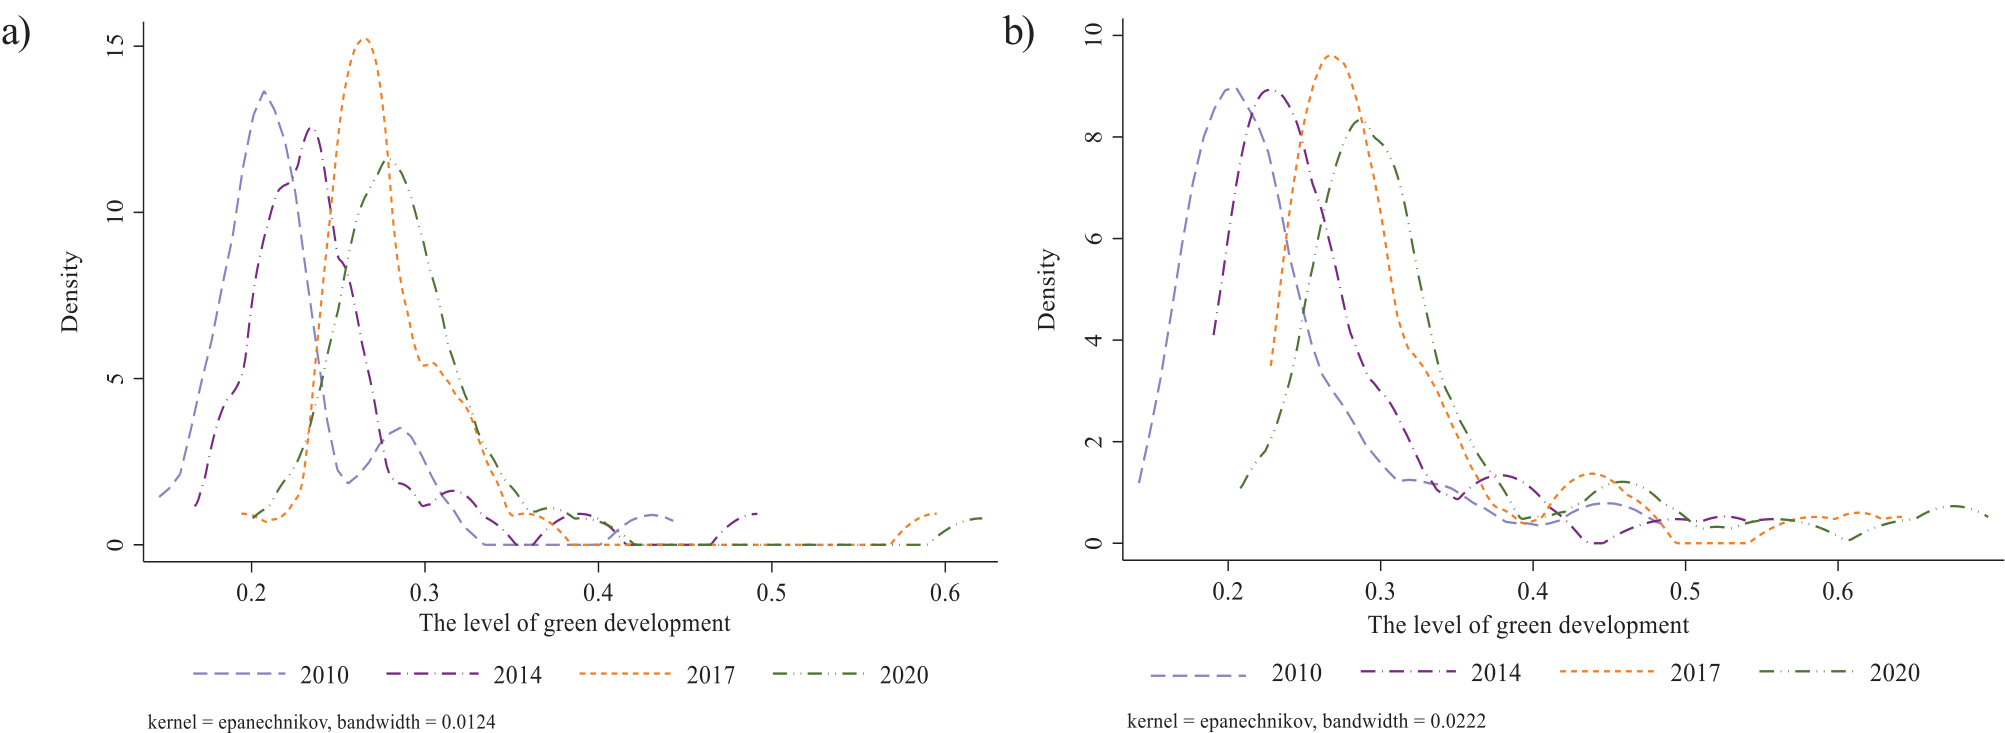
From the overall distribution pattern of Fig. 4, the kernel density curves are all gradually shifted to the right, indicating that the green development level showed a steadily rising trajectory in the mid-downstream regions. The right tail is obviously lengthened; moreover, the right tail is lengthening year by year, indicating that the difference in green development is gradually increasing. From the distribution pattern of the midstream kernel density plot (Fig. 4(a)), the wave pattern in 2010 has several peaks, and in 2014, 2017, and 2020, double peaks and a steady transfer of the low-level peaks to the right are plainly visible. Over the study period, it can be inferred that more cities in the middle reach are at a low level; however, they are gradually advancing towards a higher stage of progress. The downstream kernel density plot (Fig. 4(b)) shows an overall upward trend and a bimodal distribution, with a relatively constant wave peak width and an uneven right tail. This indicates that the level of green development in the lower reach of the YRB is gradually improving. While there is a polarization phenomenon, its distribution always maintains the club convergence phenomenon.
The nation’s sustained commitment to safeguarding and fostering high-quality development within the YRB is bound to promote green development levels. The spatial distribution characteristics of high-quality development, which are “elevated on both extremities and diminished in the middle” are consistent with the polarization phenomenon of the green development levels in the mid-downstream areas [36]. It is noteworthy that the coal chemical industry and low-end manufacturing sector in the midstream area are facing challenges due to their poor development quality and environmental protection pressures. Because of that, efforts to optimize the industrial structure have progressed more slowly, and the unjust industrial structure has caused ecological space to be occupied. As a result, there has been a clear polarization of the middle region in recent years, which has also contributed to an expansion of the absolute gap.
Spatial Differences and Their Causes
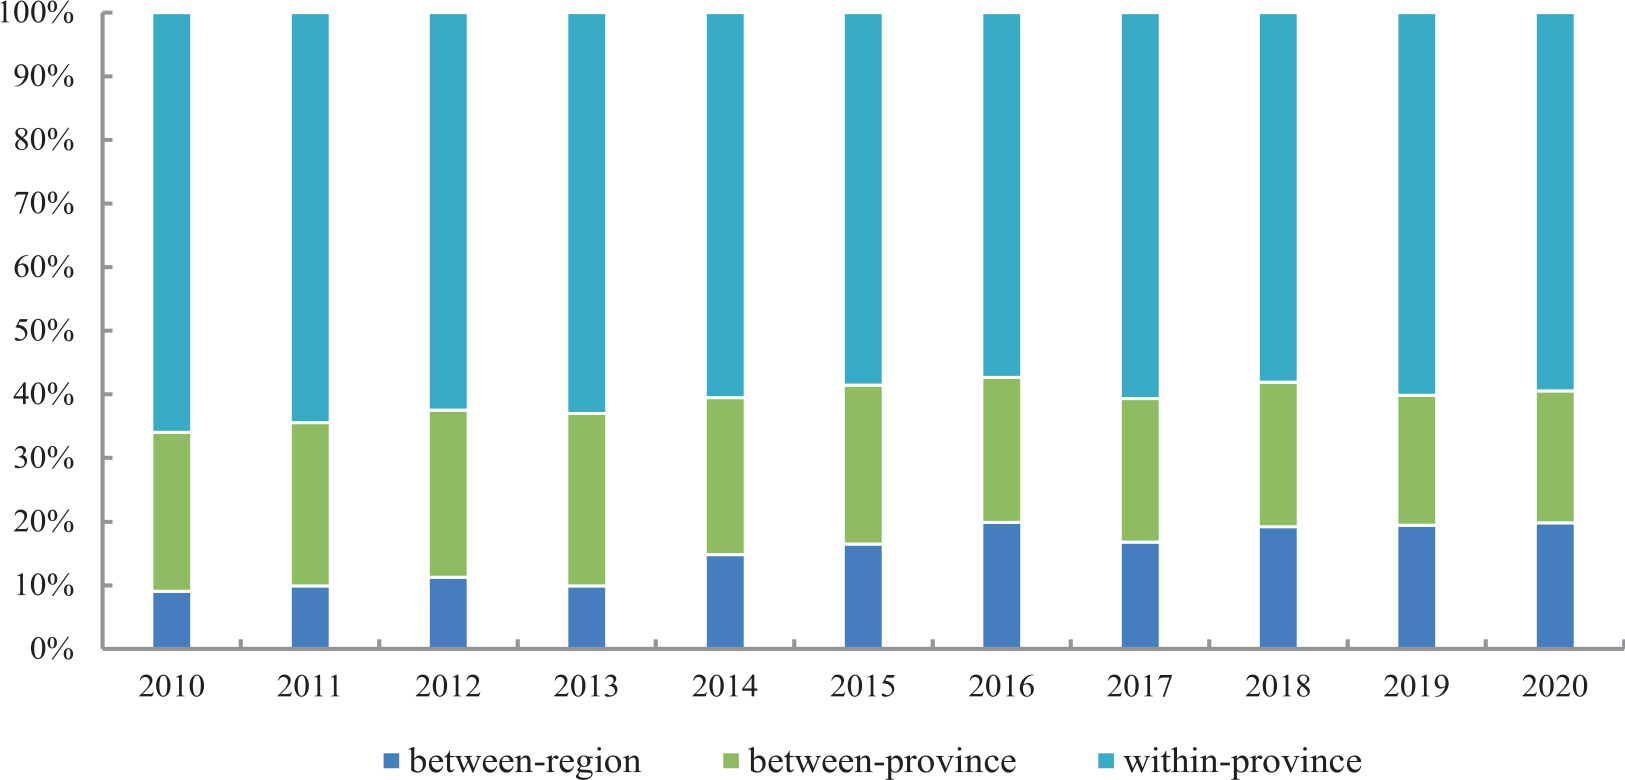
As is evident from Table 3, it can be seen that the total Theil index increased from 0.281 in 2010 to 0.334 in 2020, with fluctuations between 2015 and 2017. Furthermore, the results have generally increased over time, indicating that the regional disparities in the status of green development are on the rise. The between-region difference is the smallest, yet it is trending upward, increasing from 0.025 in 2010 to 0.066 in 2020. There are slight but consistent swings in the between-province differences between 2010 and 2020, with an upward trend between 2010 and 2015 and a declining trend between 2016 and 2020. The within-province differences are significant, indicating a slight upward trend between 2010 and 2020, accompanied by some minor fluctuations.
First, in terms of contribution rate, the most significant factor contributing to the overall difference is the within-province difference in green development, up to 65.942%. However, the contribution rate exhibits a declining trend, decreasing from 65.942% in 2010 to 59.472% in 2020. Subsequently, differences between provinces have little effect on the overall difference. It does contribute slightly more than the between-region differences, which remain relatively constant at 20% to 26%. Finally, there are between-region difference, which contributes relatively little to the overall difference, but increase annually from 9.054% to 19.834%. We can find that the primary cause of spatial variations in green development in the middle and lower reaches of the YRB may be attributed to varying degrees of green development in each city; however, the contribution to the overall difference has decreased in recent years. In addition, this disparity has progressively grown due to imbalances in regional and provincial development.
Fig. 5 indicates that there is still a considerable distance to cover for the overall coordinated development of the YRB, as the overall difference in green development levels is becoming increasingly evident. The disparities in green development between cities within each province are the main reason for this phenomenon. Due to varying degrees of resource reliance and irregularities in the economic growth process, the imbalances in the degree of green development between cities impact the total green development of the mid-downstream areas [37]. The overall design of a strategy to achieve high-quality development in the YRB has, however, lessened this influence. In recent years, provinces have energetically engaged with the significant strategic decisions pertaining to the YRB, actively coordinating and fostering high-quality development within their borders, thereby diminishing the contribution of within-province disparities. Due to the differences in geographical location and natural resources in the middle and lower reaches, the relationship between overall difference and between-region disparity is becoming more and more obvious. Under the influence of the national strategic adjustment of industrial structures, the advantages of the traditional energy extraction industry are diminishing in the midstream area, while downstream green transformation and pollution control face challenges [38]. This requires that the government take a holistic approach to the problem of high-quality development in the YRB, focusing on the differences between midstream and downstream and placing greater emphasis on regional coordination, collaboration, and integrated development.
Table 2.
Results of two-stage nested Theil decomposition and the contribution rate of differences.
Dynamic Impact of the Driving Factors
Driver Analysis Based on the GPCA
Before the GPCA, the normalized data is subjected to the KMO test and Bartlett’s Test of Sphericity to assess its efficacy. The results show that the p-value from Bartlett’s test of Sphericity is 0, and the KMO test value is 0.905, both of which pass the significance tests. Therefore, it follows that the GPCA is suitable for this investigation. The five primary principal components with eigenvalues greater than 1 are extracted using the GPCA, yielding a cumulative contribution of 72%. The factor loading matrix of each principal component is presented in Table 3. These five principal components can be synthesized into the economic development quality index (EDQ), composite social life index (CSL), environmental efficiency index (EEI), sustainable development index (SDI), and ecological balance index (EBI) based on the size of the principal component loading on the variables. On one hand, the five indices can be utilized to calculate a comprehensive index through the EM, providing a comprehensive evaluation of green development. On the other hand, an increase in each index’s weight denotes a greater significance of that index for green development. Hence the weights of the following indexes will be determined year by year in this paper: the EDQ, CSL, EEI, SDI, and EBI. After that, it will carry out a comparative analysis to look at how green development in mid-downstream regions is affected dynamically by these drivers.
Driver Analysis Based on a Dynamic Perspective
The EDQ holds relatively significant weight as an indicator of scientific and technological innovation across midstream and downstream regions, depicted in Fig. 6. In the midstream region, the overall weight of the index shows an increasing trend, while the downstream region shows a trend of increasing, decreasing, and then increasing again. It is not difficult to find that the most crucial elements of green development have always been the EDQ in the midstream region. However, the area exhibits a relatively low level and constrained capability in terms of such indicators. Consequently, the progress of the economy, science, and technology is more and more important for green development in the middle reaches. Although the downstream region has a higher level of EDQ, the promotion of green development through that is less evident than in the middle reach. This is due to the large population, more complex resources, and environmental problems necessitating continual improvement of their extensive economic growth paradigm [39].
Representing life and well-being in the midstream and downstream regions, the CSL is a crucial indicator for gauging urban environmental planning in green development as well as economic and social vitality. As can be seen in Fig. 6, the CSL’s score has a relatively low weight. The midstream and downstream regions exhibit a decreasing trend and a noticeable amount of volatility, respectively, suggesting that the CSL’s driving force behind green development is unstable. In the midstream region, the ecological environment is delicate. While environmental protection measures are being built and urban economic activities are taking place, these efforts are not yet sufficient to yield positive environmental effects. As a result, the incentive for green development is lessened. Although the economic growth in the downstream area is high, the drawbacks of the extensive “high pollution + high consumption + high input” development model have started to become apparent due to the disregard for livelihoods and environmental protection. Because of this, the advantages to the economy now exceed the advantages to the environment, underscoring the need for social welfare to be improved. Improving the population’s well-being ought to be the top priority for governments in their future endeavors [40].
Table 3.
The factor loading matrix.
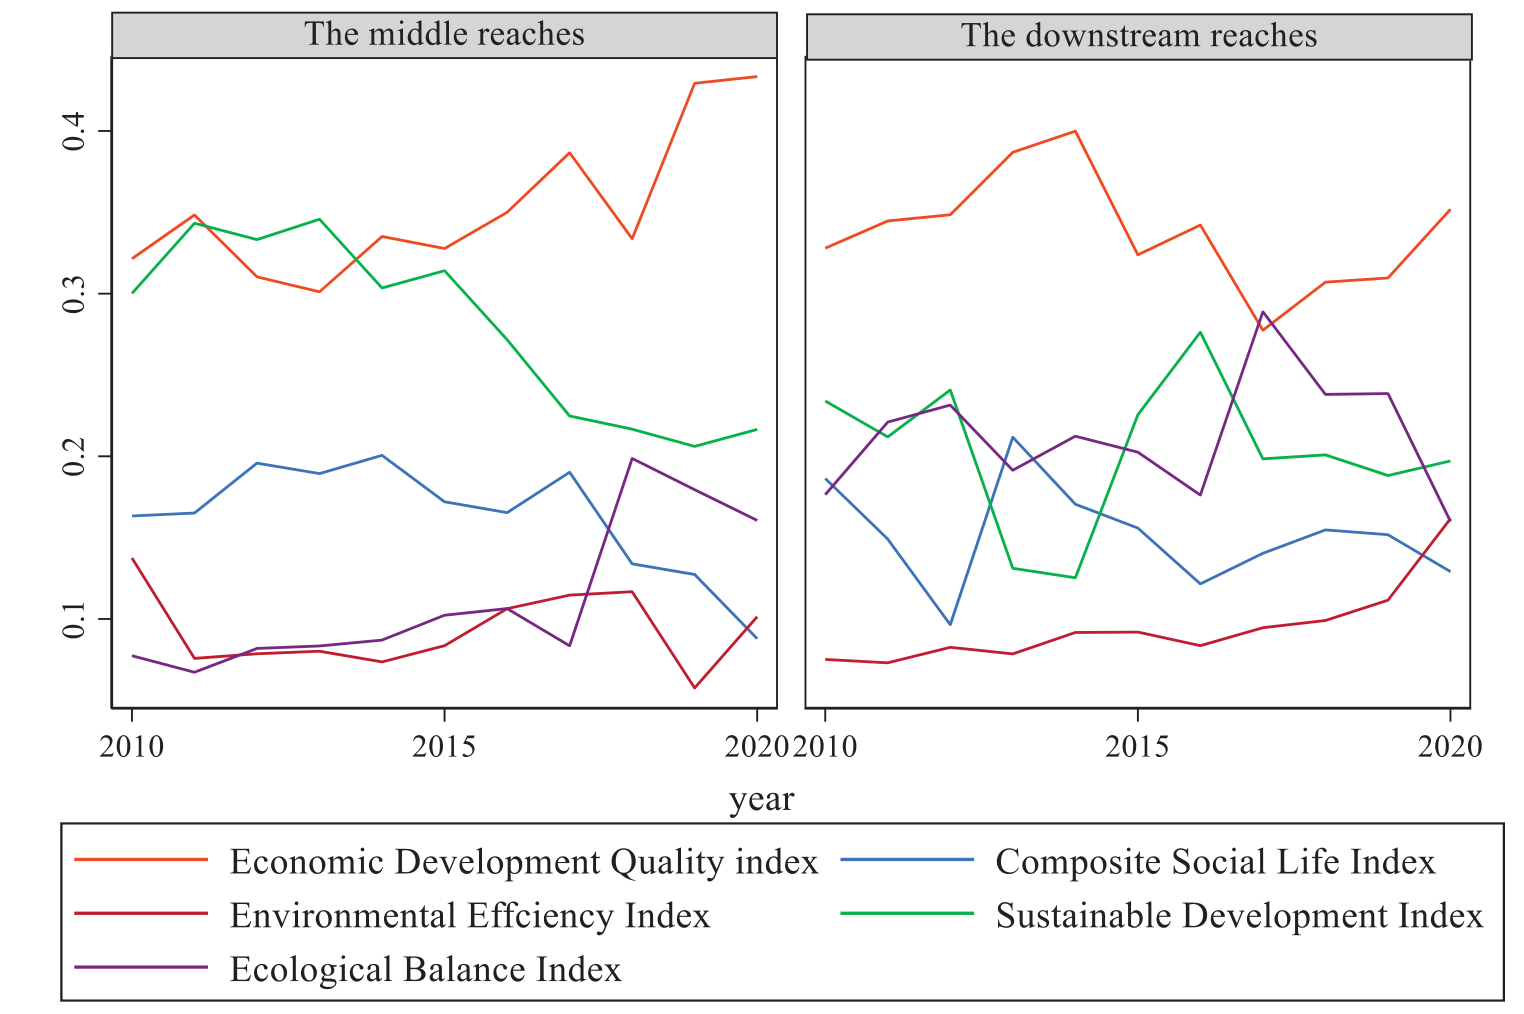
The synergistic economic and environmental benefits of pollution emissions are measured by the EEI. As can be seen in Fig. 6, the driver of green development in the middle and lower regions is given comparatively less weight. It exhibits a slow rising tendency in the downstream region and a little fluctuation in the midstream region. We can learn that enhancing the EEI under carbon emission constraints significantly propels green development. Preserving the environment is a necessary condition for attaining sustainable green development. Three key components of this development strategy include improving the CUISW, cutting back on industrial pollutants, and lowering CO2 emissions. On the one hand, countries’ development strategies are now oriented toward carbon neutrality as the enhanced greenhouse effect has grown more severe in recent years, aggravating environmental degradation [41]. By including carbon peaking and carbon neutrality in its growth plans, China hopes to achieve a thorough green transformation of its economy and society, promoting synergistic effects in pollution reduction and carbon emissions. The middle and lower reaches are the focus of efforts to balance environmental preservation with economic expansion [42]. On the other hand, technical developments and a growing awareness of environmental protection in cities are forcing them to improve their pollution reduction tactics as urban economic development moves toward high-quality intensification [34].
In the mid-downstream areas of the YRB, the SDI primarily represents the total social water consumption and the level of investment made in environmental preservation. Fig. 6 illustrates that the weight of this index shows a gradually decreasing trend in the middle region. Whereas in the downstream region, it experiences noticeable fluctuations but ultimately tends towards stability overall. In the midstream region, economic expansion leads to significant resource consumption and increased environmental pressure. Coupled with the impacts of urbanization – characterized by infrastructure construction and industrial expansion – this dynamic has positioned sustainable development as an urgent matter that necessitates immediate and sustained attention. The downstream region must increase spending on environmental preservation and improve the efficiency of water resource utilization in order to achieve more sustainable and harmonious green development [13].
The distribution of water resources and population density are the main factors that the EBI represents. From Fig. 6, the weight of this indicator generally increases in the midstream and is comparatively high in the downstream region. However, the volatility is clear, particularly over the last two years. In the midstream region, harmony between humans and the environment consistently promotes green development. The downstream region has a precarious balance between population density and water demand, and the promotion of green development is waning. This can be attributed to the fact that, despite water scarcity in the middle reach, there has been a concerted effort in recent years to protect groundwater resources. The government is committed to the utilization of urban spaces, thereby actively fostering ecological equilibrium. The ecological environment in the downstream area is relatively stable, but in contrast to the middle region, there has been a rapid increase in urbanization in recent years [43]. This rapid urban expansion has disrupted the ecological balance and has gradually diminished the positive impact of green development when assessed.
Conclusions and Recommendations
Research Conclusions
63 cities from five provinces – Shanxi, Inner Mongolia Autonomous Region, Shaanxi, Shandong, and Henan – have been chosen as research subjects for this work. The green development level in the middle and lower reaches of the YRB from 2010 to 2020 is measured by building a green development index system under carbon emission constraints. We examine the temporal and spatial dimensions of green development, investigate the reasons behind spatial disparities, and explore the dynamic consequences of the forces pushing for green development in the middle and lower reaches.
(1) The level of green development in the middle and lower reaches of the YRB has been rising. The downstream region exhibits a more pronounced rising tendency and better overall green development compared to the midstream region. Geographically, there is a gradient from south to north, with a higher level of green development in the south than in the north. A tendency toward polarization has been evident in the steadily growing spatial inequality. To be precise, between-region and between-province differences are widening, and within-province differences are the main cause of the spatial disparities. While within-province differences have grown in recent years, their contributions to the overall difference have decreased, and contribution rates of between-region differences have begun to rise.
(2) Economic and technological innovation has always been an important aspect of green development in the mid-downstream regions of the YRB. Additionally, the development of social life also deserves attention in these areas. The weight of EDQ is relatively high for green development in the region, suggesting that technological and economic innovation is critical to promoting green development in the mid-downstream regions. With a relatively low weight, the CSL exhibits clear fluctuations in the downstream region and a decreasing trend in the midstream region. Green development has generally benefited less from advances in social life, such as economic dynamism and urban environmental planning.
(3) Carbon emissions have a significant constraint on green development in the mid-downstream areas of the YRB, and water resources are a crucial component for enhancing green development. With carbon emissions limited, the EEI has a low weight but shows a distinct upward tendency, suggesting that the government should pay greater attention to environmental efficiency. As a result, reducing environmental pollution becomes a key priority for later green development initiatives. Furthermore, the midstream SDI and EBI exhibit a dropping tendency and a fluctuating ascending trend, respectively, but the downstream region shows the opposite pattern. As a result, improving the ability of sustainable development and the effectiveness of using water resources should be focused in the midstream region. Similarly, the government in the downstream region must keep careful eyes on the preservation and management of water resources, reduce pressure on the urban ecological system, and persistently support ecological equilibrium in the context of economic expansion.
Research Recommendations
(1) Advancing green development and narrowing spatial disparities in green growth: First and foremost, to grasp the overall trajectory of development, the government needs to take into account local conditions as well as the features of the middle and lower reaches. We should be devoted to pollution prevention, preservation of land and water, and the encouragement of traditional businesses to switch to low-carbon and environmentally friendly practices through market mechanisms, legislative guidance, and technical innovation in the midstream region. The downstream region must safeguard the wetland habitats in the Yellow River Delta. Additionally, pollution from industry, agriculture, and urban-rural living requires coordinated prevention and control. The second step in this process is to create a cooperative framework for green development in the middle and lower regions of the YRB with the goal of promoting cooperation among the provinces. In order to achieve this goal, it is suggested to create a trans-provincial Coordinating Committee for Green Development, which would hold frequent meetings to discuss and find solutions for issues relating to sustainable growth that arise across regions. Building upon this, the initiative for green and coordinated advancement in the middle and lower regions of the YRB must be concretely realized through both holistic and city-specific efforts. Efforts should be made to enhance inter-municipal partnerships, establishing a collaborative mechanism dedicated to sustainable urban growth. This framework will allow participating cities to exchange innovative methods for environmental stewardship with industrial transfer and technological diffusion. Furthermore, to avert homogenized competition, it is essential to devise distinct developmental strategies tailored to the unique resources, industrial strengths, and current phases of growth trends specific to each urban entity.
(2) Fostering high-quality economic development and technological innovation to propel green and low-carbon development: Modernizing and transforming the economy is essential to attaining green and low-carbon progress in the middle and lower regions. As stated in “Plan”, “innovation-driven development is essential for the YRB’s high-quality development.” In order to achieve this, we need to first assist existing industries in undergoing a green transformation by improving the efficiency of their resource usage. Moreover, it is essential to increase funding for scientific and technical innovation. Establishing a green technology innovation fund to support enterprises in conducting research and development of eco-friendly technologies is crucial. Building platforms for collaboration among enterprises, academia, and research institutions will expedite the commercialization of green technological achievements. Cooperative cross-regional innovation alliances can be created by introducing or co-establishing scientific research, transfer, and service groups. Furthermore, a green finance system needs to be improved. Creating financial instruments like green bonds and credit can help finance environmentally friendly initiatives. Finally, it’s critical to develop a market for eco-friendly consumption. Customers will choose ecologically friendly products if policies like tax breaks and government procurement are put into place.
(3) Improving the development level of social life and continuing to build an ecological and livable city: Enhancing social welfare protection is a critical component in creating an ecologically livable city. First, it is essential to strengthen insurance plans for unemployment, healthcare, old age, and other areas, thereby elevating the level of protection provided. The establishment of a comprehensive social assistance system that incorporates rural and urban locations will ensure the fundamental living needs of disadvantaged populations. Furthermore, it is imperative to enhance the caliber of public services. Amplifying governmental investment in education to enhance its quality and cultivate professional technologists and managers who are attuned to the demands of green development, thus providing a robust talent pool for achieving high-quality societal progress. Strengthening the healthcare service system to ensure the effective safeguarding of the public’s health rights. Further pay distribution system adjustments are also required to advance social fairness and equity while preserving the health of the economy. Last but not least, refining the transportation network is to enhance the welfare of the populace. Regional economic development will be promoted by building expressways, high-speed rail, and other transportation infrastructures to complete transportation networks. The standard of living for locals will rise with increased coverage rates of environmental infrastructure, such as sewage treatment and rubbish sorting.
(4) Strengthening carbon emission constraints and enhancing water resource management:
In response to the pressing challenges of carbon emissions and water resource management, decisive measures must be implemented to foster sustainable development in the YRB. In the first place, it is imperative to move quickly to phase out energy-intensive and highly polluting businesses in the middle and lower areas in order to reduce carbon emissions. Meanwhile, a strong push towards renewable energy sources like water power, solar electricity, and wind power is necessary to lower pollution emissions and provide the groundwork for future green energy supplies. With goals to reduce energy consumption and carbon emissions, it is also essential to promote energy-saving technology and improve energy efficiency. On the regulatory front, strengthening carbon emission monitoring and imposing punitive mechanisms on enterprises exceeding pollution thresholds are crucial steps. The development of regional accounting systems for carbon emissions should be aggressively spearheaded by the YRB, which should also actively refine inventory methods and pertinent accounting mechanisms. This method assures carbon emissions transparency and controllability, much like a painstakingly woven data network. The YRB should also make an effort to comprehensively promote low-carbon production, construction, and lifestyles, along with the creation of “zero-carbon” demonstration projects and achieving synergistic governance where carbon emissions align with atmospheric quality standards.
In terms of water resource management, the government in the midstream region needs to step up efforts to address non-point source pollution from agriculture and industrial wastewater, enhance sewage treatment capacities, and guarantee water safety. Reducing economic dependence on water resources can be achieved by limiting the expansion of industries with high water consumption while promoting the growth of industries that use less water. Every person shall be instilled with water-saving notions through increasing public awareness of water conservation and spreading water-saving technologies and behaviors. So as to support the recovery and prosperity of ecological systems, downstream regions should place a high priority on reducing soil erosion, safeguarding wetlands, restoring aquatic habitats, and improving water retention capabilities. Another important factor is prudent urban planning, which avoids excessive development that leads to water wastage. A shift from extensive to efficient and thrifty water usage patterns will be made easier by promoting water-saving enterprises and technologies, as well as community-wide water-saving actions and programs to support agricultural water conservation. By implementing these coordinated policy initiatives, we hope to determine the best course for environmentally friendly development in the YRB while simultaneously managing water resources and reducing carbon emissions. This exhibits a deep regard for long-term sustainable development and a dedication to our research findings.

