

Introduction
Amid global environmental challenges and economic growth pressures, green development is crucial for achieving sustainability, combating climate change, preserving ecological balance, and safeguarding human health [1]. Concurrently, the digital economy, driven by ongoing technological advancements, presents opportunities for green technologies, production methods, and product innovations, offering solutions to manufacturing’s green transformation challenges [2]. The digital economy enhances resource efficiency, reduces energy consumption and pollution, and promotes the shift toward green, intelligent, and sustainable manufacturing practices. As a key player in the global digital economy, China faces the dual challenges of rapid digital growth and green transformation in manufacturing [3]. Consequently, assessing and advancing green development in China’s manufacturing sector has garnered significant attention and research. Evaluating green development levels helps identify constraints, develop targeted policies, promote green technological innovation, and upgrade industries, thus achieving balanced economic, environmental, and social benefits. A comprehensive evaluation of the green development level in manufacturing aids in identifying the key factors that constrain green development, formulating targeted policy measures, fostering green technological innovation, and upgrading green industries, thereby achieving a coordinated advancement of economic, environmental, and social benefits.
Recent academic research has extensively studied the impact of the digital economy on industrial structure and green development [4]. At the micro level, the focus is on how the digital economy affects enterprises’ digital transformation and organizational restructuring [5]. On the meso and macro levels, research explores how the digital economy drives structural adjustments, shifts manufacturing towards higher segments of the global value chain, and promotes innovation in the service sector [6-8]. Studies also examine how the digital economy contributes to environmental sustainability, green energy consumption, and energy efficiency [9]. Scholars employ various quantitative methods like chromatographic analysis, discriminant analysis, and entropy weighting to assess green development in resource-based cities [10-12]. In conclusion, while there is significant scholarly interest in green development under the digital economy, there are notable shortcomings in assessing green development in regional manufacturing. Current studies often focus on individual provinces or regions, lacking a comprehensive and objective evaluation framework. Evaluation criteria frequently rely on subjective judgments, which compromise the overall comprehensiveness and representativeness of the assessment. This study innovatively integrates digital economy factors into a green development evaluation framework, using 2022 panel data from 30 Chinese provinces. It applies the entropy method to quantify green development levels and the obstacle degree model to identify key influencing factors. The research provides a basis for targeted policy recommendations, facilitating manufacturing’s shift towards sustainability and offering new pathways for economic development.
Methods, Data, and Indicators
Research Methods
Measurement Method for Green Development Level in Manufacturing
The entropy method is a highly reliable and precise comprehensive evaluation approach. It determines weights based on the information content reflected by the degree of numerical variation [13]. The specific calculation process is detailed as follows:
(1) Indicator Description
The total number of manufacturing provinces is denoted as n, and the total number of indicators is denoted as m. xij denotes the j-th indicator for the i-th province.
(2) Standardization of Indicators
The formula for standardizing positive indicators is:
The formula for standardizing negative indicators is:
where xijmax and xijmin represent the maximum and minimum values of indicators
(3) Non-negative Treatment of Standardized Indicators
To meet the requirements for entropy calculation, the matrix needs to be adjusted by shifting to a non-zero value, typically 0.0001. The revised formulas for standardized indicators are:
For positive indicators:
For negative indicators:
(4) Calculating the Weight of Each Indicator:
1) Weight pij of each evaluation criterion xij:
2) Calculating the entropy value for each indicator
3) Calculating the Weight of Each Indicator
(5) Applying the Linear Weighting Method to Calculate the Green Development Level
Evaluation of Obstacle Factors in Green Development of Manufacturing
To further elucidate the key barriers to green development, the obstacle degree model is employed to identify and diagnose the obstacles at both the criterion and indicator levels for green development in China’s regional manufacturing.
The specific formulas are as follows:
In the equation: Mj is the obstacle degree of the j-th indicator on green development in manufacturing. vij is the deviation degree, indicating the gap between the indicator j of province i and the development target. Wj is the weight of the indicator j, representing the contribution of the obstacle factor. Aj is the obstacle degree of each criterion layer to green development in the manufacturing.
Research Area and Data Sources
This study examines manufacturing across 30 provinces in mainland China, excluding Hong Kong, Macao, Taiwan, and Tibet. Data are sourced from the 2023 editions of the “China Statistical Yearbook,” “China Industrial Statistical Yearbook,” “China Science and Technology Statistical Yearbook,” “China Energy Statistical Yearbook,” “China Tertiary Industry Statistical Yearbook,” and “China Population and Employment Statistical Yearbook.” These authoritative sources provide a solid and reliable foundation for the research. The study evaluates green development levels in manufacturing across regions and analyzes influencing factors, offering a scientific basis and policy recommendations for advancing green manufacturing and sustainable development.
Construction of Indicator System
Building on relevant literature [14-16], this study integrates advancements in the digital economy with new industrialization to develop a hierarchical evaluation indicator system for green development in manufacturing under the digital economy (see Table 1). This system includes target levels for comprehensive assessment and focuses on five core dimensions: economic benefits, social benefits, innovation drive, industrial development, and sustainable development. It further examines these dimensions through detailed sub-indicators to ensure a thorough evaluation.
Economic benefits are assessed through indicators such as the proportion of new product revenue, which reflects innovation capability and market competitiveness [17] the profit margin of high-tech enterprises, indicating profitability and economic contribution [18] and capital investment, which measures investment in R&D and equipment upgrades, highlighting sustainability [19].
Social benefits are evaluated by indicators including the employment rate, which reflects the sector’s contribution to employment [20] employee quality, indicating the educational and skill levels of the workforce [21] employee productivity, which measures operational efficiency [22] and the ratio of high-tech enterprise employees, reflecting the employment contribution of high-tech sectors [23].
Technology and innovation are measured by the level of digital technology, reflecting technological innovation capability [24] knowledge input, which measures investment in R&D and innovation drive [25] the number of effective patents authorized, indicating technological innovation strength [26] and the ratio of enterprises setting innovation strategy objectives, reflecting strategic management in innovation [27].
Industrial development is assessed by the scale of high-tech industry development, which reflects industrial structure optimization [28] the development level of enterprise e-commerce, indicating market competitiveness and adaptability [29] and the development of strategic emerging industries, which measures industry diversity and sustainability [30].
Sustainable development is represented by indicators such as digitalization, which measures progress in digital transformation and modernization [31] low-carbonization, reflecting efforts in green production and environmental protection [32] and intelligentization, indicating advancements in intelligent manufacturing [33].
Table 1.
Evaluation Index System for Green Development in Manufacturing under the Digital Economy.
Results and Discussion
Comprehensive Evaluation of Green Development
In the context of the digital economy, this study applies the entropy method to comprehensively assess the performance of each province in green development within manufacturing. It covers 17 key indicators. This approach facilitates a detailed analysis of green development evaluation and provides scientific support for exploring influencing factors and formulating policy recommendations.
Analysis of Factors Influencing Green Development
Table 2’s entropy weight analysis reveals that the digitalization indicator has the highest weight (0.132), highlighting its critical role in green development within regional manufacturing. Conversely, employee productivity has the lowest weight (0.017), indicating a minor impact. Dimensional analysis shows that economic benefits and sustainable development are the main drivers of green development, significantly advancing overall progress. Technological innovation, industrial development, and social benefits provide important supplementary roles. Economic benefits are driven by new product revenue proportion, high-tech enterprise profit margins, and capital investment, boosting economic growth and competitiveness. Technological innovation is measured by knowledge input and effective patents, essential for industrial upgrading. For sustainable development, digitalization and intelligence reflect leadership in environmental protection and resource efficiency, crucial for sustainability goals. These indicators affect economic growth, competitiveness, and the effectiveness of green development trajectories.
Table 2.
Summarizes the results of entropy method calculations for indicator weights.
Towards Sustainable Development: Evaluation and Analysis of Green Development Levels
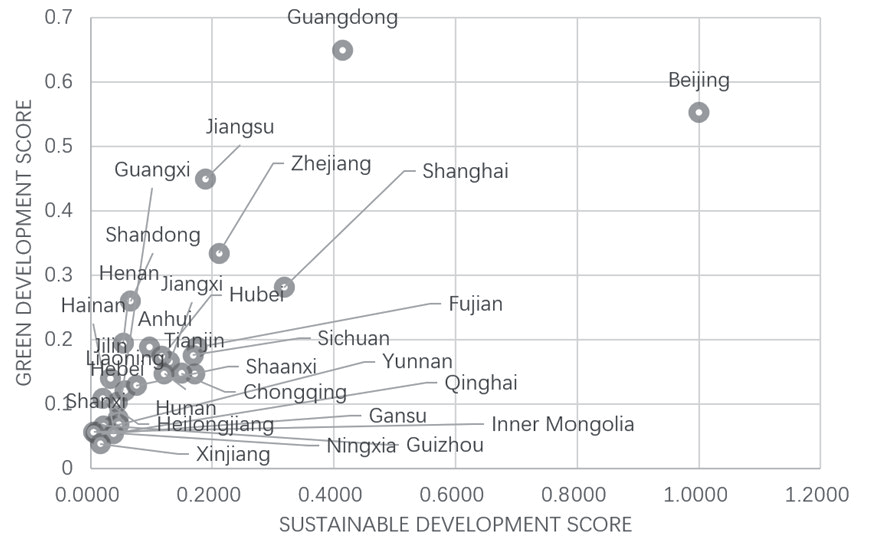
As shown in Table 3, the analysis evaluates the standard values of sustainability dimensions – digitalization, low carbonization, and intelligentization – and the comprehensive green development scores of various provinces. Fig. 1 illustrates each province’s performance in these dimensions and their relationship with overall green development scores, highlighting significant performance disparities.
Provinces with high scores, such as Beijing, Guangdong, Jiangsu, and Zhejiang, demonstrate exemplary performance across digitalization, low carbonization, and intelligentization, underscoring their leadership in green development. Beijing, in particular, achieves near-perfect scores across all dimensions, showcasing its comprehensive strengths in the digital economy and green technology. Guangdong excels in intelligentization, reflecting its advanced capabilities in high-tech and smart manufacturing.
Provinces with moderate scores, including Tianjin, Shanghai, Shandong, and Henan, show strong performance in certain dimensions but have room for improvement in others. For example, while Shanghai and Tianjin excel in digitalization and low carbonization, their performance in intelligentization is comparatively weaker. These provinces should address specific shortcomings and implement targeted improvements to achieve a more balanced green development approach.
Provinces with lower scores, such as Gansu, Qinghai, Ningxia, and Xinjiang, exhibit weaknesses across digitalization, low carbonization, and intelligentization. These provinces need increased investment in green technology and environmental conservation, alongside advancements in technological capabilities and enhanced policy frameworks to support sustainable development. The Identification Results of Green Development Barriers in 30 Mainland Chinese Provinces
Analysis of Individual Indicator Obstacles
Building upon the assessment, the Obstacle Degree Model is used to further identify the primary barriers affecting green development in manufacturing under the digital economy. Given the large number of provinces and indicators studied, this paper focuses on analyzing the top five indicators with the highest obstacle degrees across provinces in 2022. Using the obstacle degree calculation formula, the obstacle degrees of various indicators for manufacturing green development across 30 mainland Chinese provinces in 2022 are measured. As shown in Table 4, specific indicators posing significant obstacles to green development in provincial manufacturing in 2022 include digitalization, knowledge input, development of strategic emerging industries, capital investment, and intelligentization. These indicators reflect major weaknesses and challenges in the green development process. Combining the entropy weightings of green development indicators across the 30 provinces, it is found that despite the implementation of multiple policies by these cities, the effectiveness of existing policies remains limited amidst rapid economic and social development. For instance, while some provinces exhibit high levels of digitalization and intelligentization, they still face significant obstacles in the green development process. Therefore, to achieve sustainable economic and environmental development in manufacturing, more comprehensive and targeted measures must be taken to enhance innovation and sustainable development capabilities.
Table 3.
Scores of sustainable development indicators and green development scores of 30 provinces in Chinese mainland.
Analysis of Classification Obstacle Indicators
Based on the measurement results from various indicators (Table 5), sustainable development and technology innovation emerge as the primary barriers to green development in China’s regional manufacturing industry. They are followed by economic benefits and industrial development. Specifically, the rankings are sustainable development>economic benefits> technology innovation>industrial development>social benefits. This underscores fundamental challenges in achieving green development amid the digital economy’s influence. Overall, most provinces face significant obstacles in achieving sustainable development. Whether provinces exhibit higher levels of green manufacturing development, such as Guangdong, Jiangsu, and Zhejiang, or lower levels, like Gansu, Qinghai, and Ningxia, the pressure to achieve sustainable outcomes persists. This highlights critical challenges in environmental protection, resource use, and ecological balance, necessitating enhanced policy support and technological innovation to drive practical advances in green development. Technology innovation plays a pivotal role in promoting green development, evident from the high emphasis placed on it across provinces. This reflects the urgent need to apply environmental technologies and upgrade industries. While some provinces, such as Inner Mongolia, Jilin, and Liaoning, encounter obstacles related to economic and social benefits, these factors are secondary compared to sustainable development and technology innovation in the overall analysis. Achieving a balance between economic transformation and social engagement remains pivotal. There are notable disparities in the weight of green development barriers among provinces, underscoring the need for tailored strategies that consider local conditions. Certain regions may require more policy support and resource allocation to address specific green development challenges. The study findings reveal common challenges provinces face in transitioning to green practices, alongside significant variations in their green development levels.
Table 4.
Analysis of Major Obstacles and Obstacle Degrees in Green Development Levels of Manufacturing across 30 Mainland Chinese Provinces in 2022.
Table 5.
2022-Dimensional Indicator Obstacle Degrees of Green Development Levels in Manufacturing across 30 Provinces.
Conclusions and Recommendations
Conclusions
This study has developed a comprehensive evaluation framework for green development within the context of the digital economy. It offers quantitative insights into green manufacturing levels across provinces and identifies critical barriers. Key findings are:
(1) Primary Drivers of Green Development in Regional Manufacturing in China
The study highlights digitization and intelligentization as significant drivers of green development. Digitization indicators are weighted highest, emphasizing their crucial role in enhancing green development and achieving sustainability. Advancing digital transformation and intelligentization are essential pathways for realizing green development in the digital economy. Key factors such as the proportion of new product revenue, profitability of high-tech enterprises, capital investment, knowledge input, and effective patent authorizations significantly drive economic growth and market competitiveness, thereby advancing green development.
(2) Green Development Levels from a Sustainable Development Perspective
Economic benefits and sustainable development are central to evaluating green development in manufacturing. Indicators like the profitability of high-tech enterprises, the proportion of new product revenue, and metrics of digitization and intelligentization directly influence green development levels. High-scoring provinces, such as Beijing, Guangdong, Jiangsu, and Zhejiang, demonstrate exceptional performance in these areas, showcasing their leadership in green development and success in promoting economic growth, market competitiveness, and sustainability.
(3) Regional Disparities and Principal Challenges
Significant regional disparities exist in green development levels. High-scoring provinces excel in digitization, low-carbon initiatives, and intelligentization, while lower-scoring provinces lag in these areas. Major challenges include sustainable development and technological innovation, particularly in environmental protection technologies and industrial upgrading. These barriers highlight regional disparities in green development, revealing deficiencies in environmental protection, resource utilization, and ecological balance in certain provinces.
Recommendations
Based on this analysis, we propose the following policy recommendations:
(1) Promote Digitization and Intelligent Transformation
Recognizing the pivotal role of digitization and intelligentization in advancing green development within regional manufacturing, governments should prioritize policies that support the adoption of digital technologies and smart manufacturing practices. This includes making substantial investments in digital infrastructure to enhance production efficiency and resource utilization, thereby reducing environmental impacts and facilitating the transition of industries towards environmentally sustainable practices.
(2) Enhance the Innovation Environment and Policy Support
Encourage and support research and development (R&D) investments and protect intellectual property for high-tech enterprises. Policies such as tax incentives and targeted funding for research projects should foster technological innovations in green technologies and environmental conservation. Additionally, strengthen technology transfer platforms to expedite the application and dissemination of technological advancements, thereby enhancing industry-wide innovation capabilities and global competitiveness.
(3) Establish Mechanisms for Regional Collaboration and Knowledge Sharing
Promote collaboration and knowledge exchange among provinces in green development. Establish robust platforms for interregional cooperation and information sharing to facilitate coordinated policy efforts and best practices in adopting green technologies and implementing environmental policies. These initiatives are essential for addressing regional disparities in environmental protection, resource utilization, and ecological balance.

