

Introduction
Ecosystems, as natural resources and assets, underpin human survival and development [1, 2]. Ecosystem services act as critical links between ecosystems and human activities [3-5] and offer a range of benefits derived from ecosystem structures, processes, and functions [6]. With the advent of the “Anthropocene” in the 21st century, the impact of human activities on terrestrial ecosystems has escalated, creating varying levels of environmental stress. Protecting natural ecosystems and their services has emerged as an urgent global challenge [7, 8]. Population, as a principal agent of human activity, is a key factor influencing the intensity of human interactions with ecosystems and the provision of ecosystem services. Increasing ecological and environmental challenges necessitate proper management of the relationship between the population and the environment, and exploring sustainable paths for the development of population, resources, and the environment has become a global issue.
Since the 1990s, exploratory research into the assessment of ecosystem services and ecosystem service value (ESV) has been conducted [4, 9-11]. Currently, there are two main estimation methods for monetarily valuing the ESA: data-based and unit-value-based [1]. Data-based methods are often applied at smaller spatial levels [12, 13] or for single ecosystems [6, 14] and involve intricate calculations with numerous variables that challenge standardization. Climatic factors play a crucial role in the evaluation of material quantity, rendering the outcomes heavily dependent on climate variation and diminishing their relevance to tangible land management practices [15]. Alternatively, the unit value-based method involves distinguishing between different types of ecosystem services and constructing value equivalencies for each type based on quantifiable standards. This approach assesses these values in conjunction with the spatial distribution of ecosystem types, where the ESV is estimated based on the economic value per unit area of the ecosystem [1, 3, 9, 16]. This method is widely applied in China, particularly for evaluating the effects of land-use changes on ESV. However, previous studies have generally involved a limited variety of ecosystem types and shorter time series, overlooking the spatiotemporal dynamics of the ESV. In recent years, China has updated and refined the equivalency factors for ESV [1, 17, 18], providing theoretical and methodological support for assessing the spatiotemporal dynamics of different ESVs.
Populations, as the primary entities of human activities, significantly influence changes in land use and subsequently alter the ESV. The dynamic interrelation between human activities and ESV has become a focal point of public concern and academic investigation, with studies in this area predominantly concentrating on urbanization [19-21], tourism [22], economic growth [23], ecological compensation [12], and the reforestation of agricultural lands [24]. In recent years, intensified human activity and climate change have led to significant transformations in the ecosystems of the Tibetan Plateau, presenting unprecedented challenges to ecological security [25, 26]. These changes have rendered the plateau’s ecosystems increasingly sensitive and exacerbated environmental issues [27]. Compared with the indirect impacts of climate change, the direct effects of human activities on the ecological environment of the Tibetan Plateau are more profound [28]. Ecological research related to the Tibetan Plateau primarily focuses on ecosystem services, biodiversity, forest conservation, and ecological adaptation within the context of climate change [29-31]. However, existing studies often overlook the critical role of the population as the primary agent of human activity or merely consider it one of several indicators of human activity [32], thereby neglecting the crucial interrelationship between population dynamics and ecosystem functions. This oversight hinders a comprehensive understanding of the spatiotemporal relationships and coordination between populations and ecosystems. Therefore, this study examined the interaction between population and ESV to uncover the spatiotemporal patterns and characteristics of human activities and their ecological impacts. This study aimed to clarify the coordination between population density and ESV in the plateau region, providing a robust scientific basis for enhancing ecological security and facilitating sustainable development on the Tibetan Plateau.
Data Sources and Methodology
Overview of the Study Area
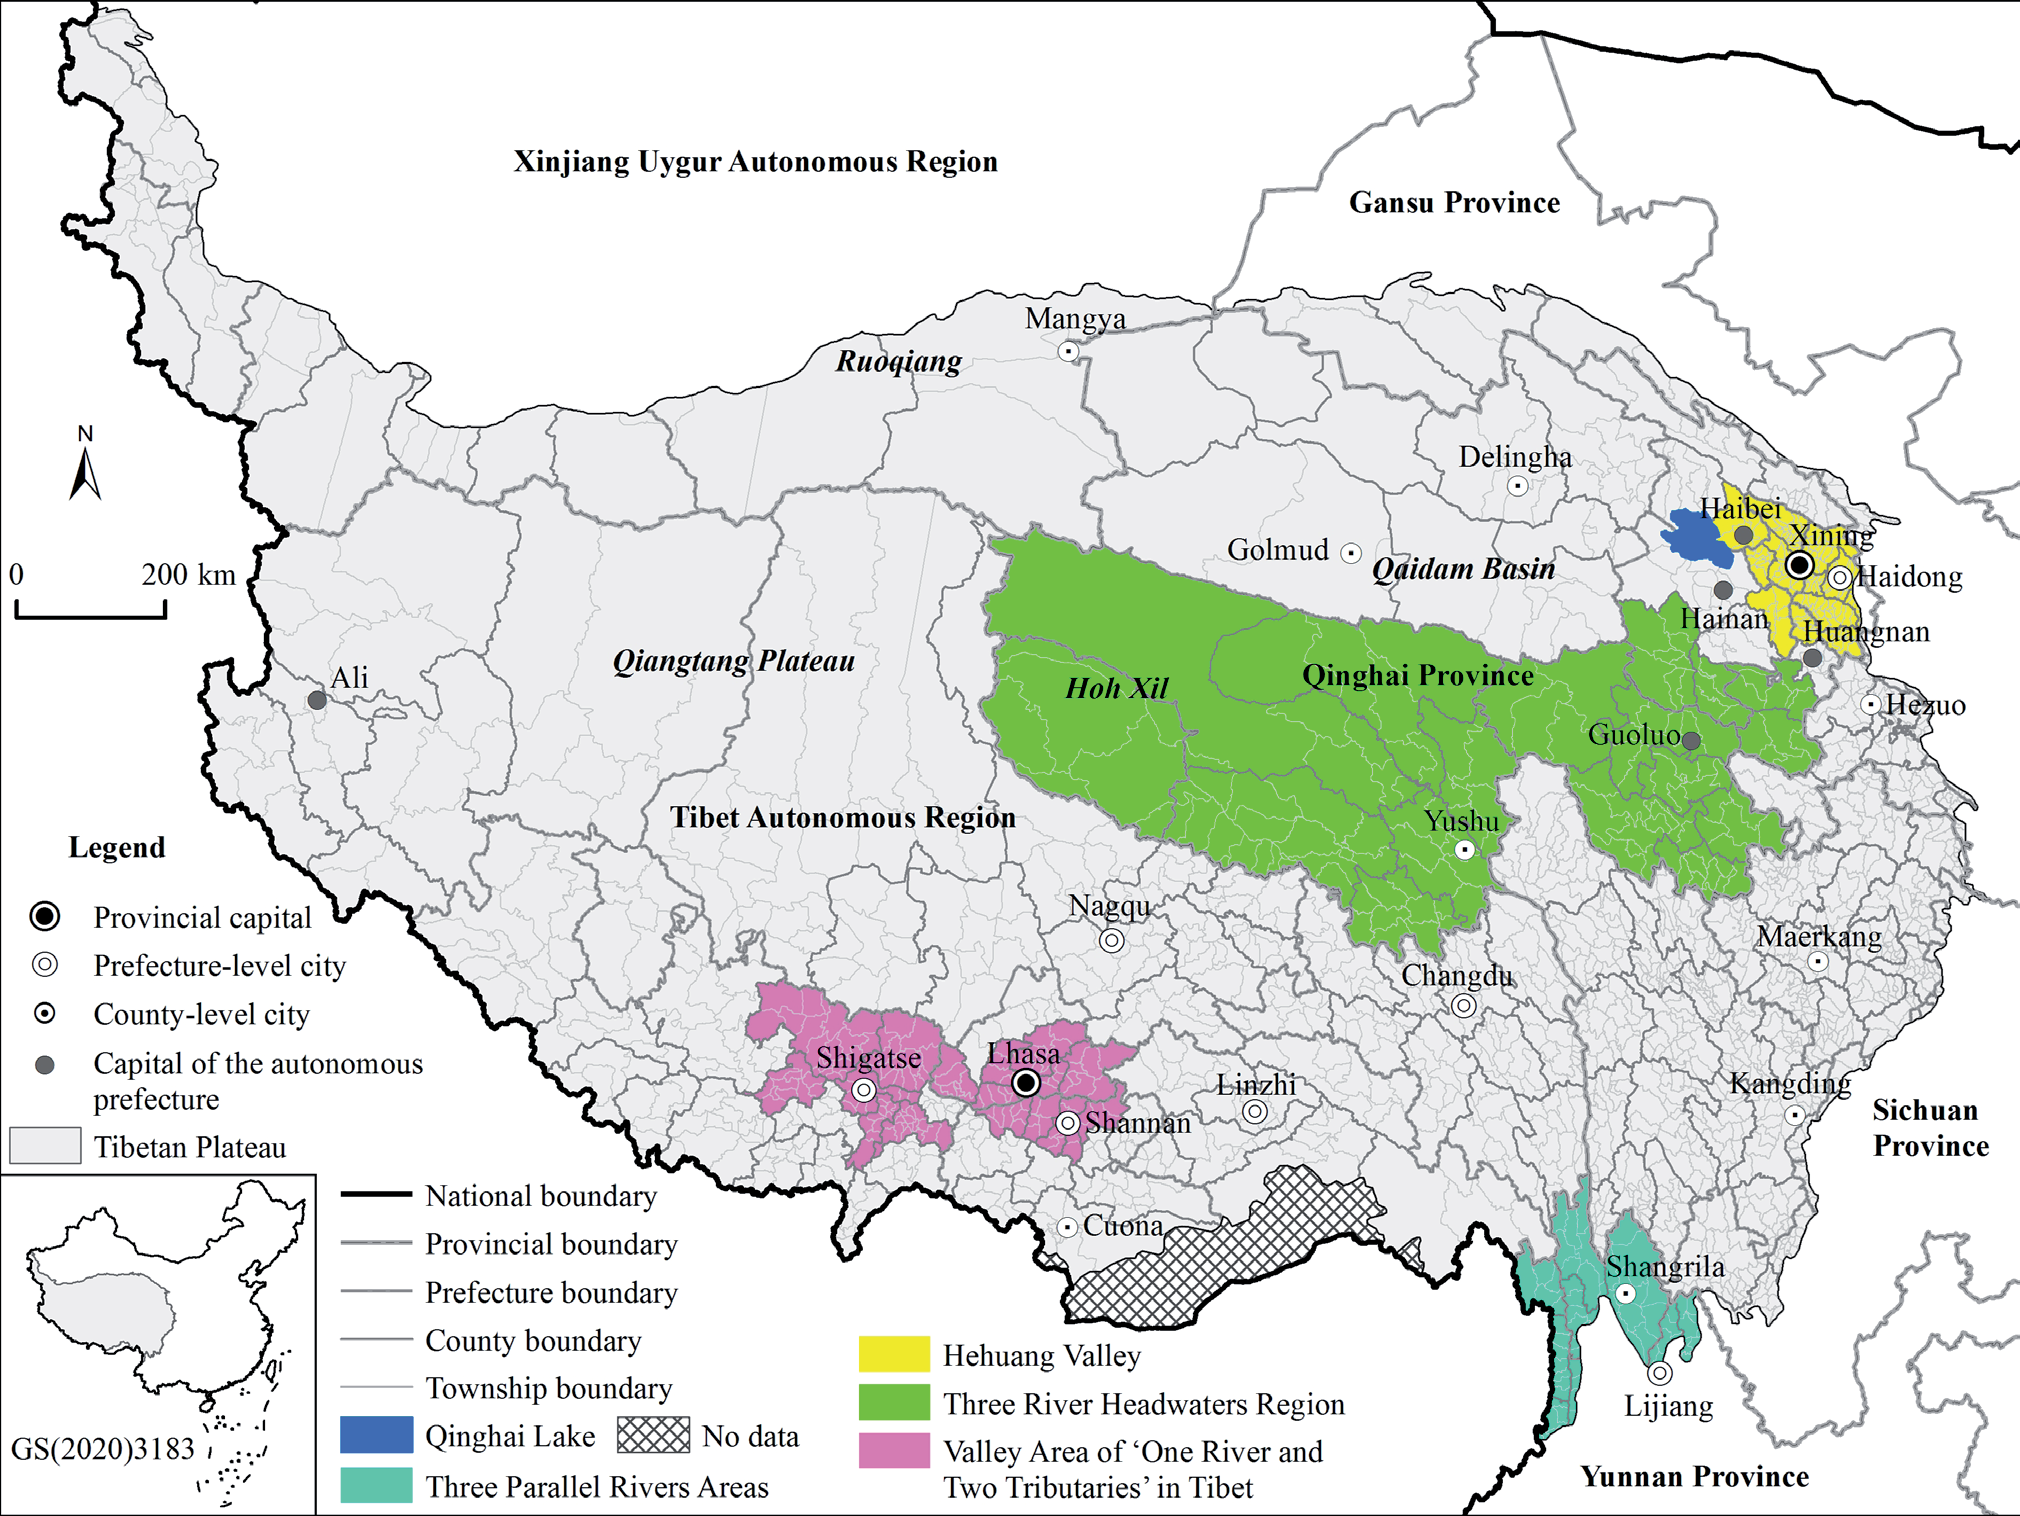
The Tibetan Plateau, known as the “Roof of the World,” “Asian Water Tower,” and the “Third Pole” [29, 33], is a region highly sensitive to global climate changes. It functions as an ecological barrier and plays dual roles as a catalyst and a magnifier of global change [34, 35]. Featuring the highest elevation and most extensive permafrost within the mid-low latitude zones of the Earth [34], it is recognized as the highest biogeographical entity globally. As an essential ecological security barrier for China and Asia, the plateau is at the forefront of the development of a network of national parks [36]. Alpine ecosystems, situated under high, cold, and arid conditions, exhibit pronounced sensitivity to climate change and human impacts [17], designating them as globally significant and vulnerable ecosystems. This makes it a key region for ecological and environmental transformation research [37]. In contrast to methodologies that deploy gridded data for microscale segmentation, this study utilized township-level administrative units as fundamental analytical units (Fig. 1). Employing administrative divisions as basic units facilitates precise alignment with population data, leading to more accurate outcomes, and supports easier governance and administrative oversight [38]. To ensure continuity and interannual comparability in our analysis, administrative divisions from 2020 were adopted as standards in the data processing and analytical phases.
Data Sources
This study utilized land use/cover data from 1980, 1990, 2000, 2010, and 2020, sourced from the Data Center of Resources and Environmental Sciences at the Chinese Academy of Sciences (http://www.resdc. cn/). The data derived from Landsat remote sensing imagery had a resolution of 30 m * 30 m. Land use was categorized into 6 primary categories (arable land, urban areas, forests, grasslands, bodies of water, and barren land) and 25 secondary categories. Population data for these years were obtained from decennial census data, which are recognized as the most accurate demographic data available in China. Administrative boundary data were obtained from the National Geomatics Center of China (http://ngcc.sbsm.gov.cn/).
Research Methods
Assessment of ESV
The conceptual and methodological framework for assessing ESV was developed by Costanza et al. (1997) [3]. The direct application of these frameworks in China may lead to underestimation or neglect of specific ESV. Xie et al. (2017) [1] and Xie et al. (2003) [17] adapted these methodologies to suit specific Tibetan Plateau conditions, focusing on per-unit area values. This study employed the refined ESV assessment method proposed by Xie et al. (2017) [1], outlined in Table 1, to conduct a detailed analysis of the ESV of the Tibetan Plateau. The calculation formula is as follows:
where ESVi is the ESV (yuan) of region i, Aim is the area of m type land in area i, and VCm is the value coefficient of ecosystem services per unit area for land type m. The variable n indicates the number of townships, and k refers to the number of different land-use types.
Centre of Gravity Analysis
In this study, the center of gravity analysis method was introduced to measure the ecological and population centers of gravity on the Tibetan Plateau and to determine the directions and distances of their spatial shifts across different years. The formula is as follows:
where xt and yt are the coordinates of the population and ESV of the study region in year t, pit represents the population size and ESV for township i in year t, and xt and yt are the geographical longitude and latitude coordinates of township i, respectively.
Table 1.
Per unit area ecosystem service value of the Tibetan Plateau (yuan/hm2).
Geographic Concentration
We employed the population geographic concentration and ecological geographic concentration metrics to depict the spatial distribution patterns of the population and ESV. The corresponding equations are as follows:
where RPOPi and RESVi represent the geographic concentrations of the population and ecosystem services in region i, respectively; POPi, ESVi, and Si represent the population size, ESV, and administrative area of region i, respectively; n denotes the number of townships. Higher RPOPi and RESVi values indicate a greater concentration of population or better quality of the ecological environment in the area, respectively, indicating a higher population density or better ecological environment quality.
Exploratory Spatial Data Analysis
The core of exploratory spatial data analysis is the use of spatial autocorrelation models to analyze the heterogeneity or homogeneity of research subjects, including global and local spatial autocorrelation. Univariate spatial autocorrelation is used to describe the spatial association of a single geographic phenomenon, whereas bivariate spatial autocorrelation analyzes the spatial association between two geographic phenomena [39]. A commonly used indicator for bivariate spatial autocorrelation is the bivariate Moran’s I index, which is calculated as follows [39]:
where xi and xj represent the attribute values of townships i and j, respectively; wij is the spatial weight matrix that indicates the adjacency relationship between townships i and j, with w=1 if adjacent and w=1 if not.
Utilizing the bivariate Moran’s I index, this study explored the spatial conflicts and coordinated development between the population and ESV. Based on these results, the townships were classified into four types: High-High (HH), High-Low (HL), Low-High (LH), and Low-Low (LL).
Spatial Mismatch Index
Socioeconomic factors diverge from natural resource endowments, resulting in a disparate spatial distribution of the population and ESV. The pronounced dissimilarity between these distributions might have engendered regional ecological imbalances. Drawing upon extant studies [40], we employed the spatial mismatch index (SMI) to scrutinize the concordance between the population and ESV. The formula is as follows:
where SMIi represents the spatial mismatch intensity between the population and ESV for township i. If SMIi<0, it indicates that the population demand in township i exceeds the ESV level, and if SMIi>0, it suggests that the ESV level exceeds the population demand in township i. A smaller absolute value of SMIi indicates a higher degree of coordination between population and ecosystem services.
Results
Spatiotemporal Changes in Population at the Township Level
Spatiotemporal Changes in Population Density
The population density on the Tibetan Plateau is significantly lower than the average population density across China [28, 41], exhibiting a distinctive pattern characterized by pockets of high population density in vast areas of sparsity. The number and the density of the permanent population on the plateau exhibited an upward trajectory (Table 2). Specifically, the total population increased from 9.5466 million in 1982 to 14.8978 million in 2020, accompanied by a corresponding increase in population density from 3.52 person/km2 in 1982 to 6.50 person/km2 in 2020.
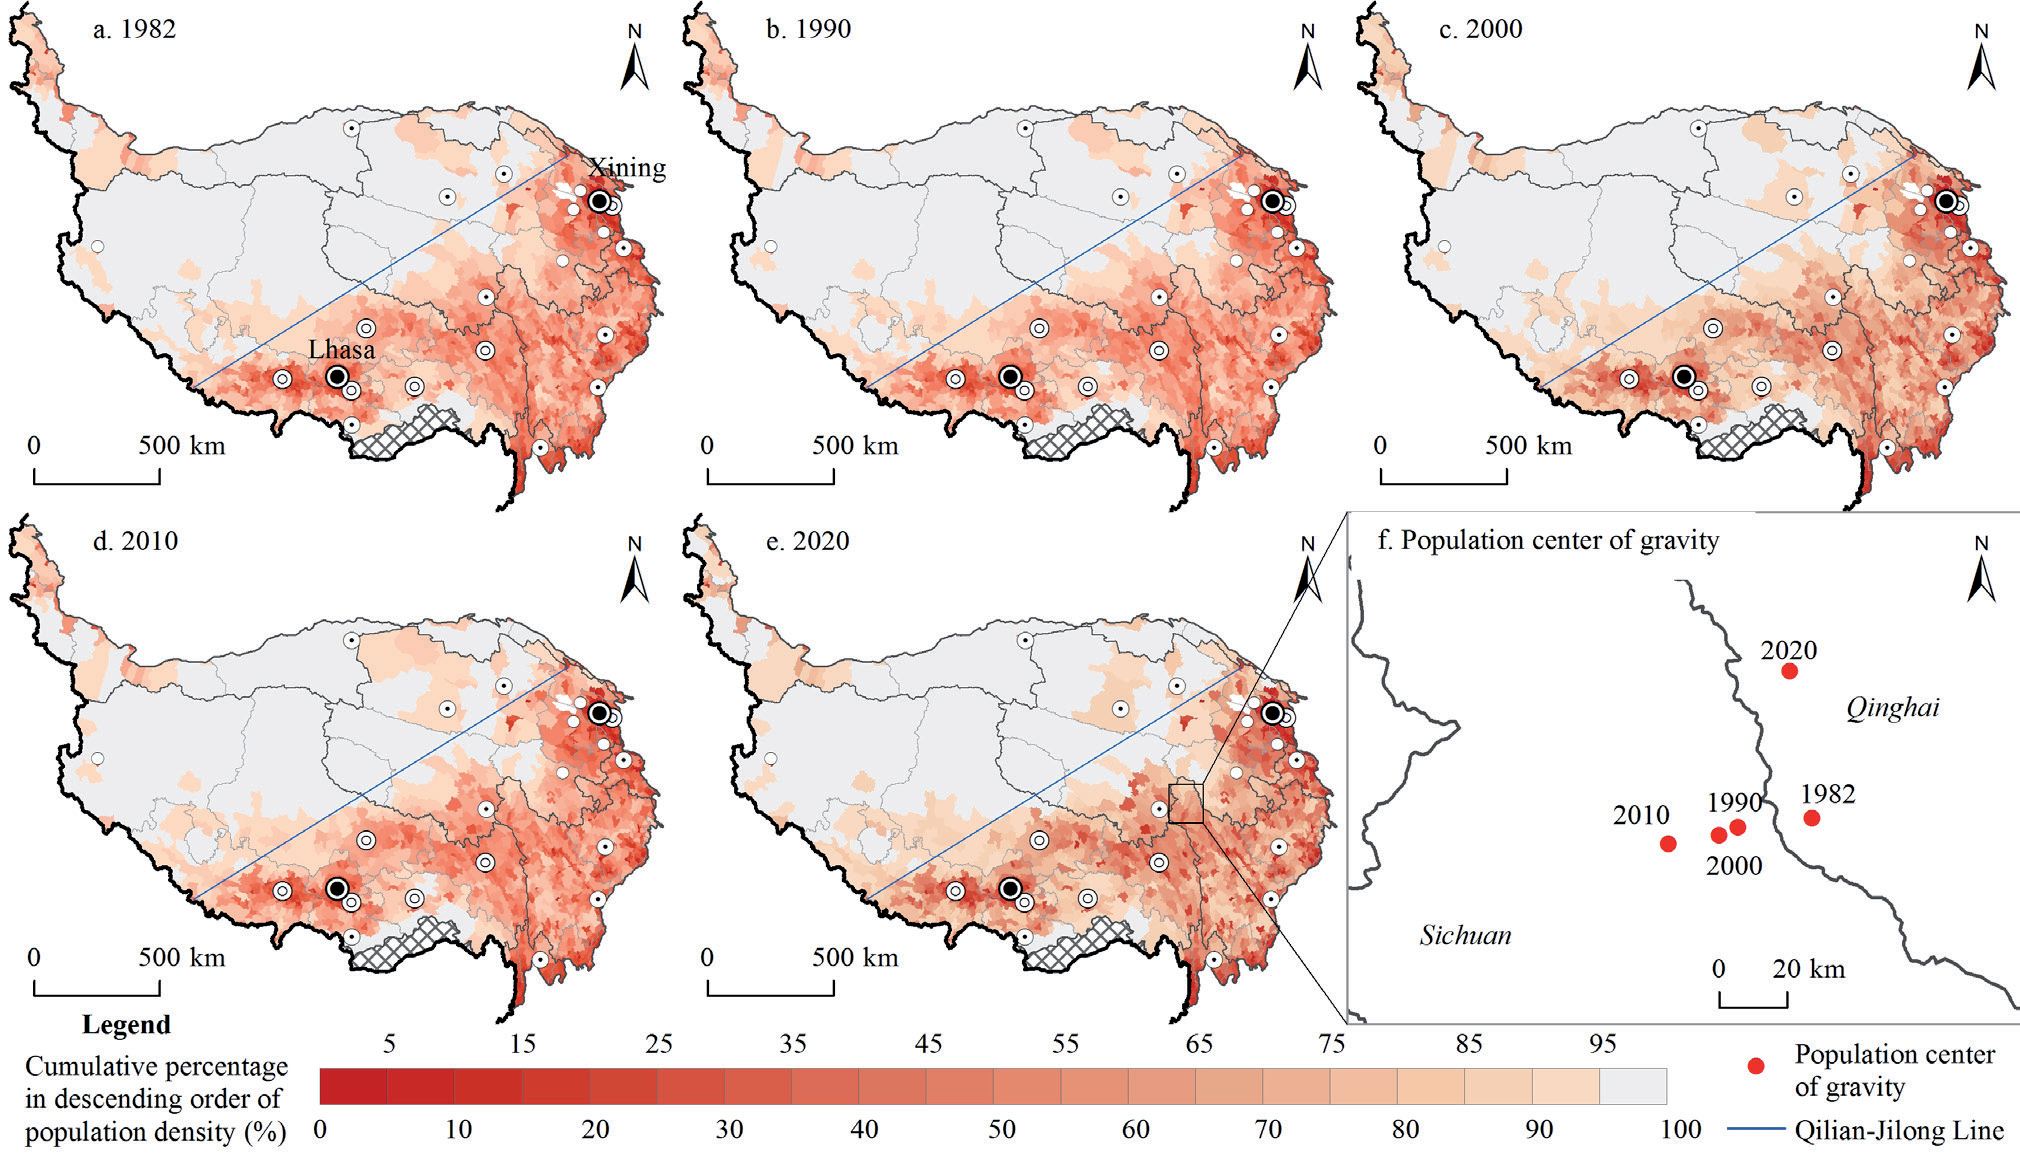
Overall, the spatial distribution of the population is dense in the southeast and sparse in the northwest [28]. Utilizing cumulative percentages, the population density distribution from 1982 to 2020 (Fig. 2a–e) reveals conspicuous regional disparities. Townships boasting higher population densities cluster in the northeastern reaches of the plateau, the valley area of “One River and Two Tributaries” in Tibet, the southeastern periphery of the plateau, and administrative centers of counties and prefectures. Meanwhile, townships with moderately elevated population densities are predominantly situated in southeastern plateau areas such as Hainan, Gannan, and Changdu prefectures, along the southeastern flank of the “Qilian-Jilong Line” [28]. Conversely, townships characterized by lower population densities are concentrated in regions such as Ali, the Qiangtang Plateau, Hoh Xil, the Qaidam Basin, and the Kunlun Mountains, situated along the northwestern periphery of the plateau. The enduring stability of the spatial configuration of population distribution across the Tibetan Plateau is discernible.
The migration trajectory of the population gravity center positioned east of the Qilian-Jilong Line unfolded in two discernible phases: from 1982 to 2010, the centroid progressively shifted westward towards Yushu City, Qinghai; from 2010 to 2020, it veered towards the northeast (Fig. 2f), deviating from the trajectory delineated by Gao et al. (2021) [28] for 2010–2017. This divergence is attributed to two reasons. First, the discrepancy in data sources, because the 2017 data were not census-derived, potentially engendering disparities with the 2020 census data. Second, rapid urbanization within the Hehuang Valley, with Xining and Haidong Cities at its core, where the urban population increased from 1,557,764 in 2010 to 4,816,774 in 2020, constituted 85.59% of the population increase on the Tibetan Plateau during 2010–2020. Hehuang Valley and its environs have emerged as the most conducive regions for substantial human settlements on the plateau.
Spatiotemporal Changes in Population Geographic Concentration
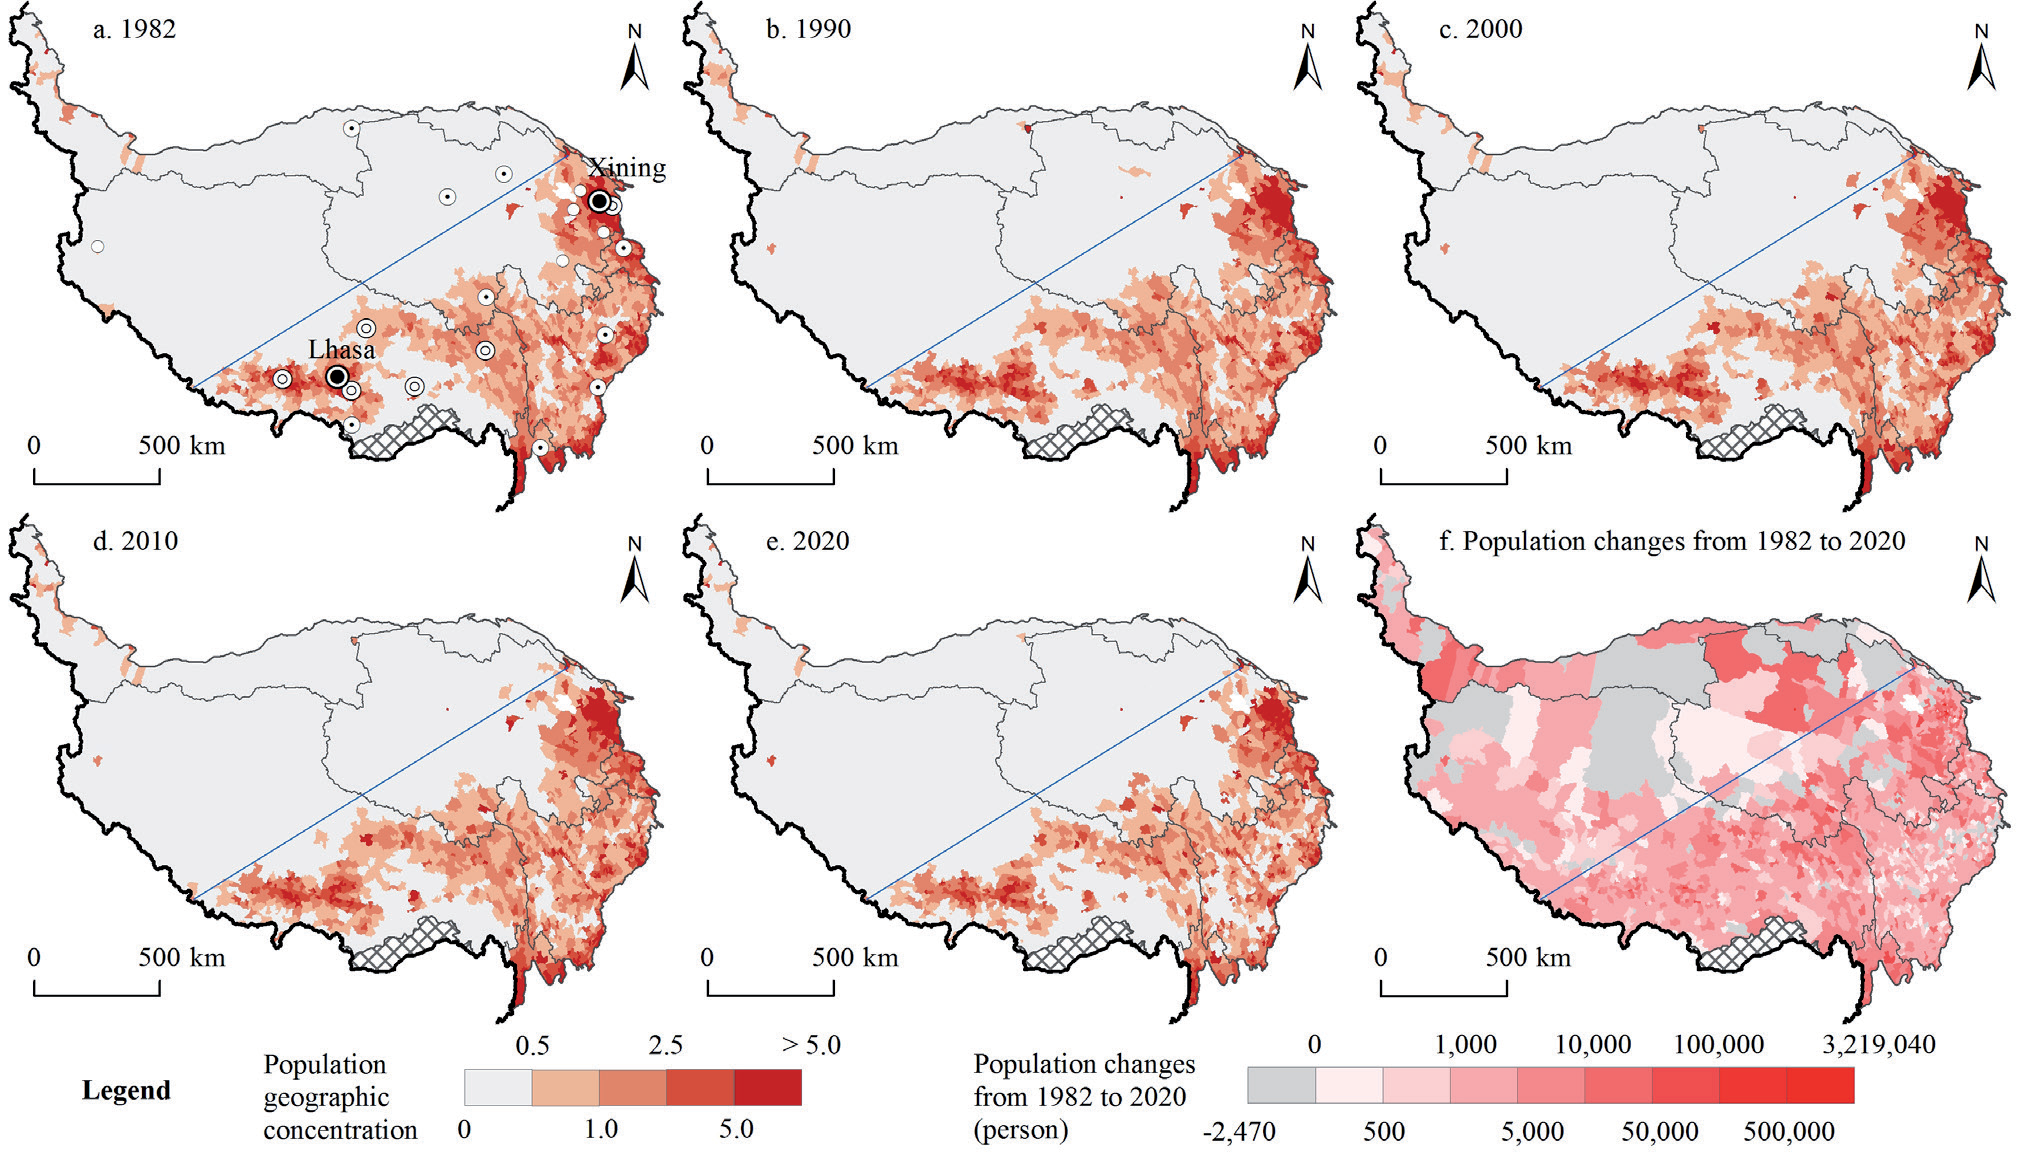
At the township level, the spatial distribution of the population geographic concentration on the Tibetan Plateau exhibited stable yet pronounced spatial heterogeneity (Fig. 3a–e). Townships characterized by higher population concentrations are primarily situated on the southeastern side of the Qilian-Jilong Line, with a few outliers on the northwestern side (including Delingha, Golmud, and Ali, where city- or county-level governments are located). Conversely, townships with lower population concentrations are predominantly situated on the northwestern side of the Qilian-Jilong Line (these regions are characterized by higher altitudes), encompassing areas (such as Yushu and Golog Tibetan Autonomous Prefectures in Qinghai and the southeastern reaches of Tibet) that are typically mountainous and have high-altitude terrains. Townships boasting the highest population concentrations are clustered within urbanized zones such as Xining, Haidong, Lhasa, Hezuo, Shigatse, Changdu, Maerkang, and Shangrila, particularly prominent in the Hehuang Valley and along the valley area of “One River and Two Tributaries” in Tibet.
From 1982 to 2020, an analysis of population changes across townships on the Tibetan Plateau (Fig. 3f) indicated that with the exception of 168 townships displaying a declining population trend, approximately 91.48% of the townships registered an increasing population trend. Townships witnessing a decline in population are predominantly situated in high-elevation areas, such as the Qiangtang Plateau, Qilian Mountains, and Kunlun Mountains. Conversely, townships experiencing significant population growth are primarily concentrated in urban areas and their environs, including the Hehuang Valley (Xining and Haidong), the valley area of “One River and Two Tributaries” in Tibet (Lhasa and Shigatse), the Three Parallel Rivers area (Shangrila and Lijiang), the Qaidam Basin (Golmud and Mangya, characterized by arid climates but abundant resources), and the southern region of Xinjiang (Hotan City, Hotan County, and Cele County).
Changes in Spatial Cluster of Population Geographic Concentration
The global Moran’s I indices for population geographic concentration at the township level on the Tibetan Plateau were 0.505, 0.536, 0.551, 0.557, and 0.584 across the study periods (Table 3), indicating a significant positive spatial association. Further investigation using local spatial autocorrelation methods revealed relatively stable regional spatial distribution patterns (Fig. 4). Townships exhibiting HH clusters are primarily situated in Hehuang Valley (centered around Xining and Haidong) and in urban centers such as Lhasa, Jishishan, Lijiang, Guide, Songpan, Danba, and Lintan. Conversely, the HL cluster townships are predominantly found in urban districts, such as Golmud. In contrast, the LH cluster townships are distributed along the peripheries of cities and counties, such as Golmud, Guide, Lintan, Songpan, Rangtang, and Danba. The prevalent distribution of LL cluster townships, indicative of lower population geographic concentrations, was observed predominantly on the northwestern side of the Tibetan Plateau and in southeastern Tibet and southern Qinghai.
Table 3.
Moran’s Index of results.
The emergence of this pattern is likely attributable to the superior natural environment and advanced level of urbanization of Hehuang Valley, rendering it a focal point for regional growth characterized by a substantial population base and robust attractiveness. Conversely, the northwestern reaches of the plateau, encompassing the Qiangtang Plateau, Hoh Xil, and the Kunlun Mountains, are less conducive to large-scale population concentrations because of their higher elevations; thus, these areas experience slower population growth or even decline. Moreover, the vicinity of Golmud, endowed with abundant resources such as lake salts, oil, natural gas, and asbestos, serves as a crucial transportation hub on the Qinghai-Tibet Railway and the Beijing-Tibet Highway and exerts a significant influence on population influx.
Spatiotemporal Changes in ESV
Changes in Per Capita ESV
From 1982 to 2020, ESV on the Tibetan Plateau was recorded at 12,433.00, 12,834.47, 12,468.96, 14,662.19, and 14,811.71 billion yuan, reflecting an overall increase of 2,378.71 billion yuan (Table 4). The annual average growth rate is approximately 0.46%, which is lower than the population growth rate (approximately 1.63%). Among the various ecosystem services, grasslands hold the highest value, followed by a minimal contribution from croplands, with the most significant increase observed in wetlands. The value of grasslands decreased by approximately 887.44 billion yuan. Waste treatment, water flow regulation, climate regulation, soil formation and conservation, and biodiversity maintenance are the major components of ESV on the Tibetan Plateau. Regulatory services dominate ESV, highlighting the need for further protection and restoration of functions, such as air regulation and aesthetic landscapes (Table 5).
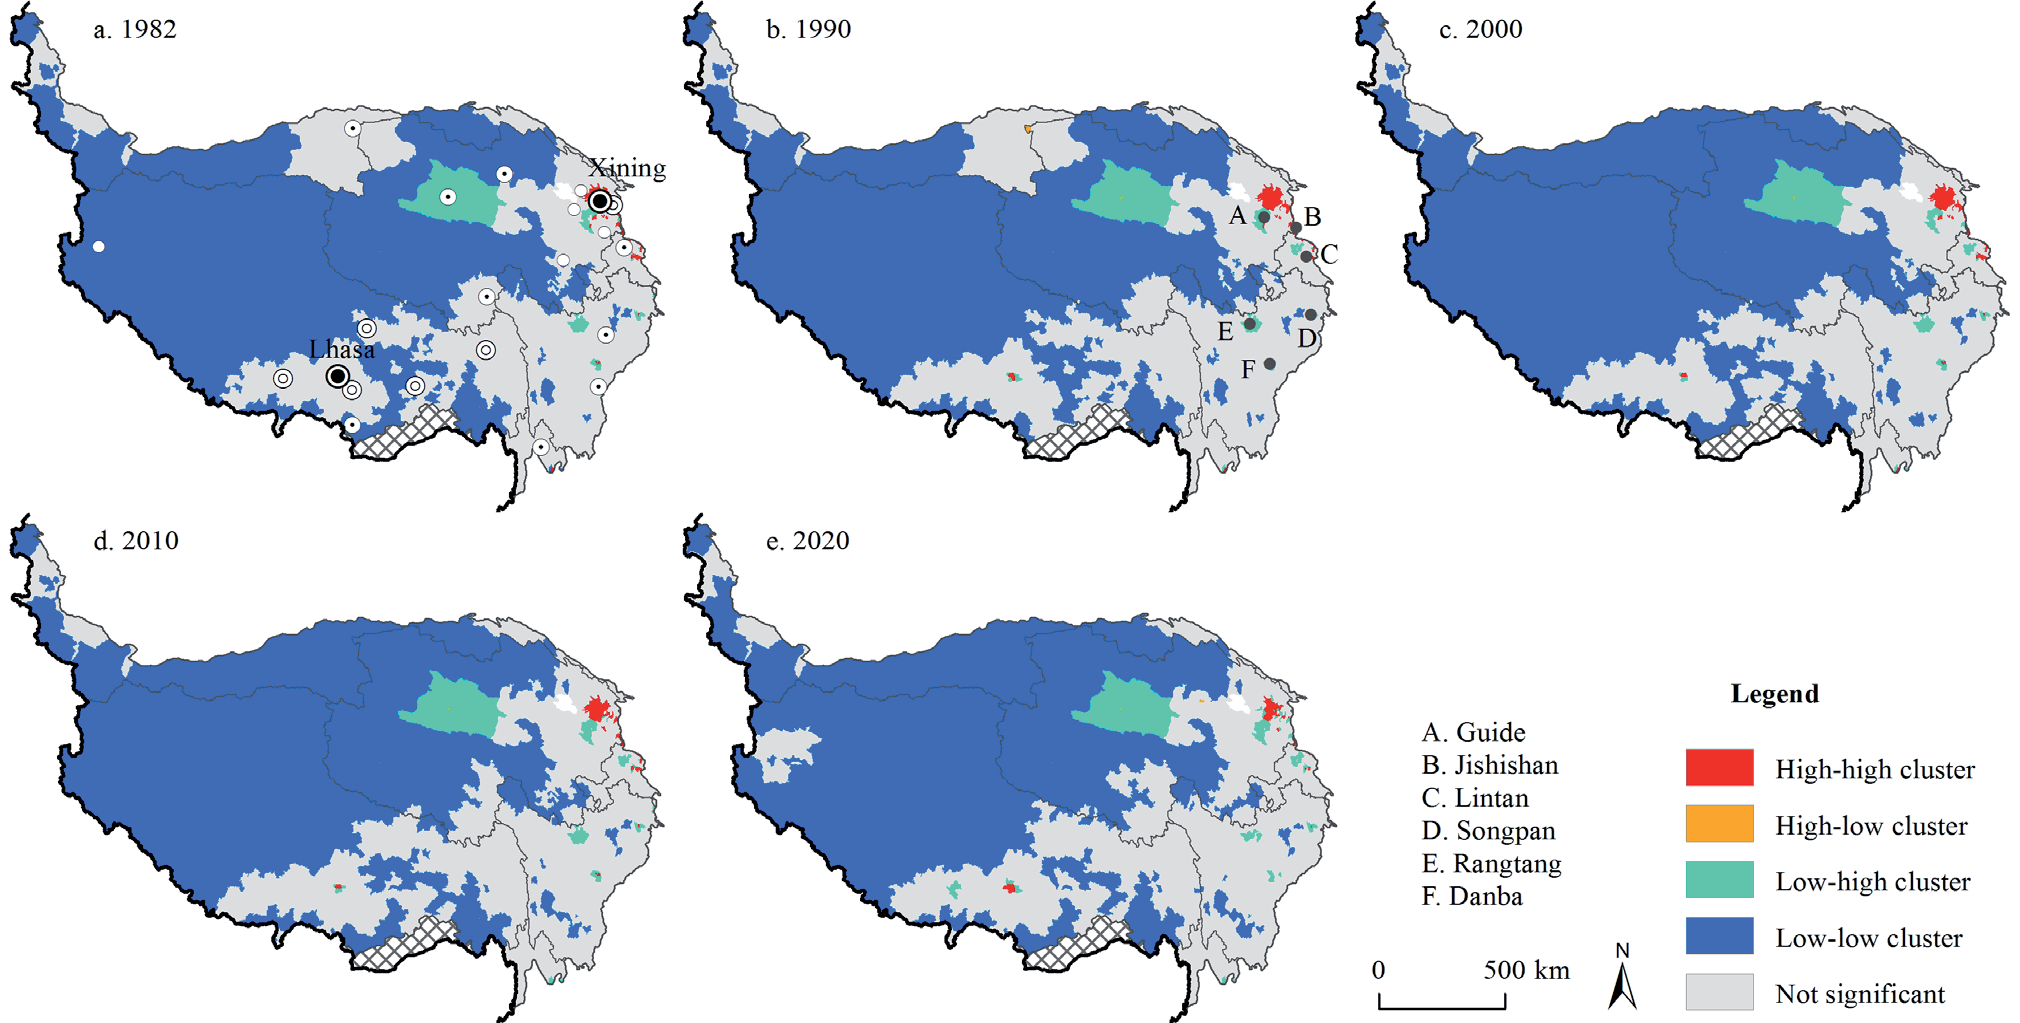
Table 4.
ESV of different types of land on the Tibetan Plateau.
Table 5.
Value of individual ecosystem services on the Tibetan Plateau.
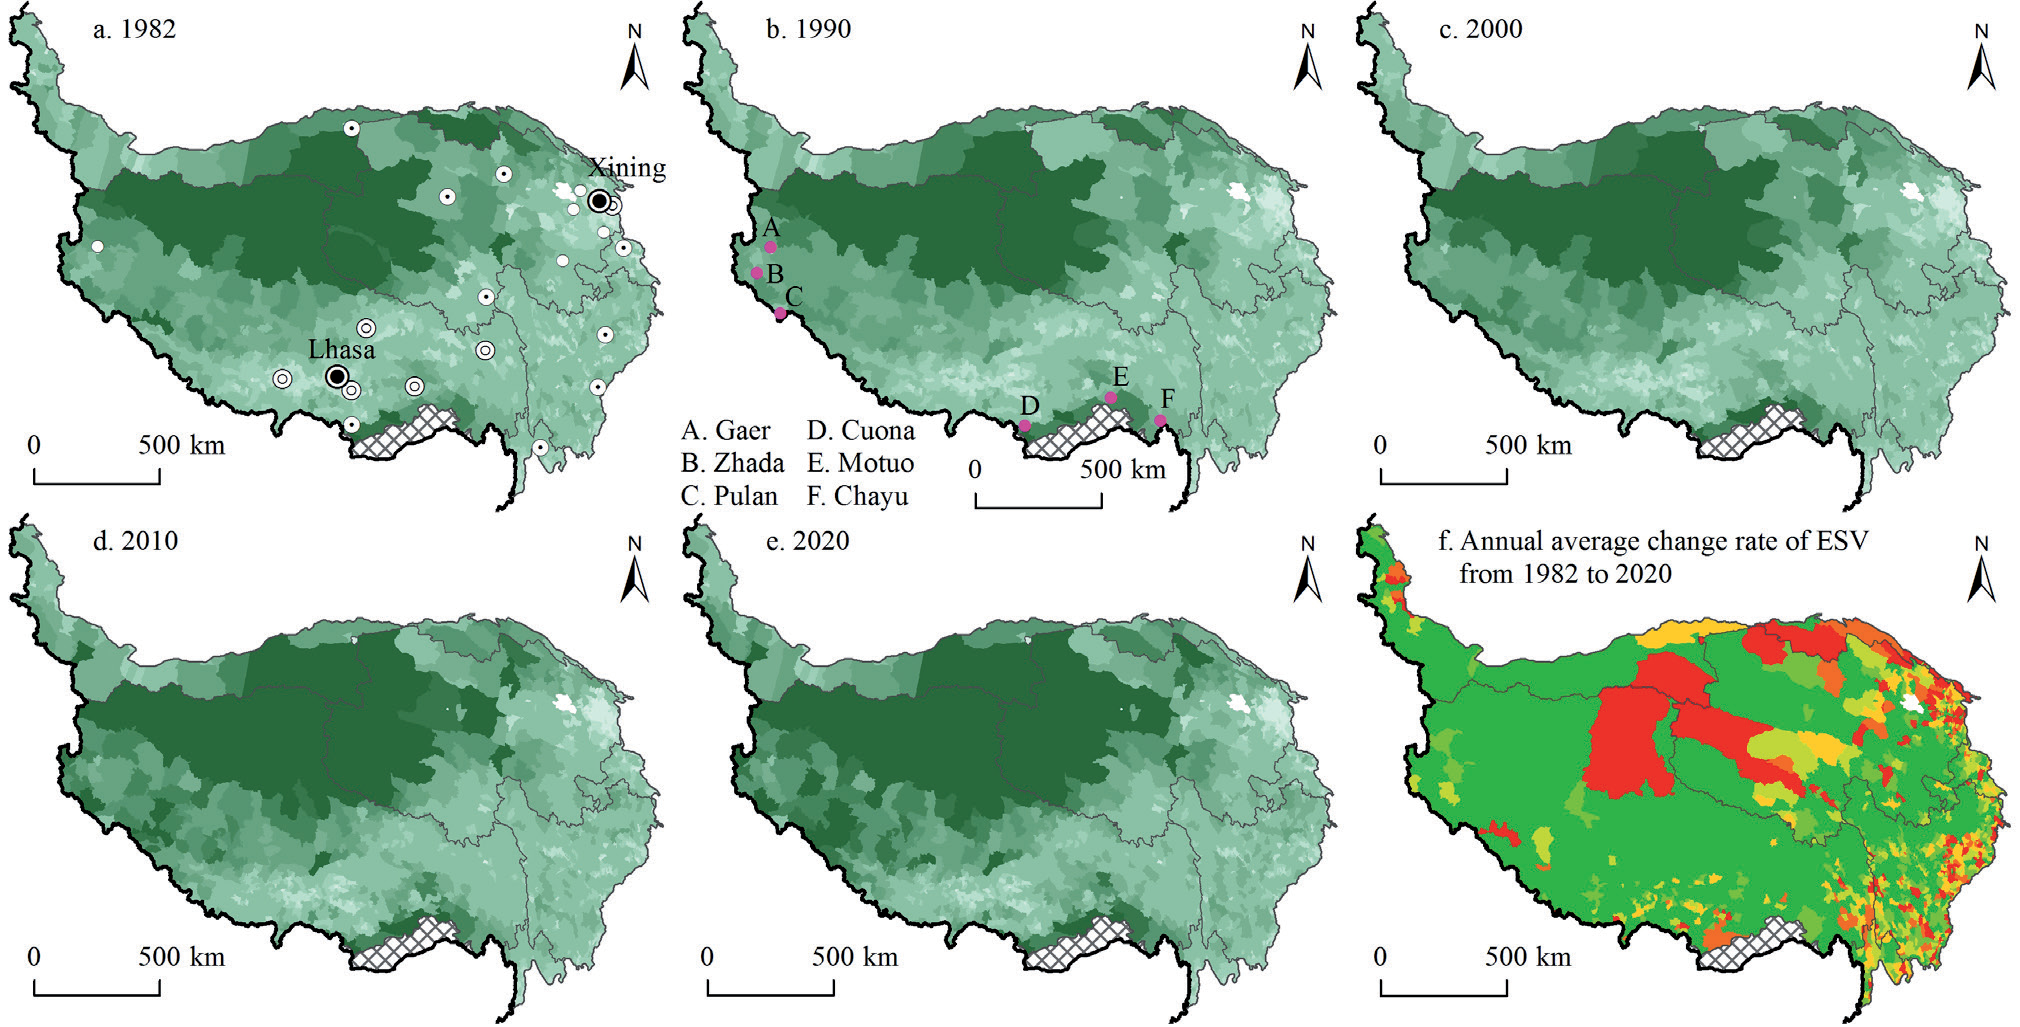
From 1982 to 2020, the per capita ESV on the Tibetan Plateau was 130.6, 117.3, 101.7, 106.0, and 84.0 thousand Yuan per capita, indicating an increasingly sharp downward trend. This trend contrasts with the spatial distribution pattern of the per capita ESV at the township level, which exhibited significant spatial variation (Fig. 5a–e). Townships with higher per capita values (above 4.00 million dollars) are primarily located in high-altitude areas, such as the Qiangtang Plateau, Hoh Xil, and Ruoqiang, and the Qilian Mountains. These regions, which also encompass major portions of the National Parks on the Tibetan Plateau, have higher elevations and have experienced a substantial population decrease. Following these are areas along the Himalayan range, where, due to high mountainous terrains (such as Zhada, Pulan, and Gaer) and geographical constraints (such as Chayu, Motuo, and Cuona), the population levels have consistently been low. Townships in the Hehuang Valley, the valley area of “One River and Two Tributaries” in Tibet, and Sichuan’s Aba region have lower per capita ESV, with some townships falling below 1,000 USD dollar.
Based on the annual growth rate of 0.46% in ESV, per capita ESV at the township level on the Tibetan Plateau has been classified into six types: rapid decline (annual change rate ≤ -0.92%), quick decline (-0.92% < annual change rate ≤ -0.46%), slow decline (-0.46% < annual change rate < 0%), slow growth (0 ≤ annual change rate < 0.46%), quick growth (0.46% ≤ annual change rate < 0.92%), and rapid growth (annual change rate ≥ 0.92%). Most townships on the Tibetan Plateau are categorized as experiencing rapid growth, as shown in Fig. 5f. Townships undergoing rapid decline are mainly concentrated in areas such as the Qiangtang Plateau, Hoh Xil, Ruoqiang, Qilian Mountains, Hehuang Valley, and parts of western Sichuan Province. Areas such as the Qiangtang Plateau, Hoh Xil, and Ruoqiang, which had the highest per capita values, also suffered the greatest decrease in ESV. The primary reason for this phenomenon is that these regions, known as the “plateau on the plateau,” are most sensitive to global climate change, leading to significant environmental transformations such as lakes drying up into grasslands and grasslands degrading into deserts, thereby causing large fluctuations in ESV.
Spatiotemporal Changes in Ecological Geographic Concentration
The classification of the ecological geographic concentrations over time is shown in Fig. 6a–e and demonstrates a relatively stable spatial distribution pattern from 1982 to 2020 across the townships on the Tibetan Plateau. Townships with high values (≥ 2.00) are primarily located in Hoh Xil, the Three Parallel Rivers area, the Qilian Mountains, southern Tibet, and multiple lake regions (such as Namtso, Yamdrok, and Sanjiangyuan, Gangcha, and Ruoergai). Townships with moderately high values (≥ 1.25) are mainly found in the Qiangtang Plateau, Hoh Xil, and the Three Parallel Rivers area. Townships with lower ecological geographic concentrations were distributed in the southern part of Xinjiang and the Qaidam Basin, areas characterized by a large proportion of desert and Gobi terrain.
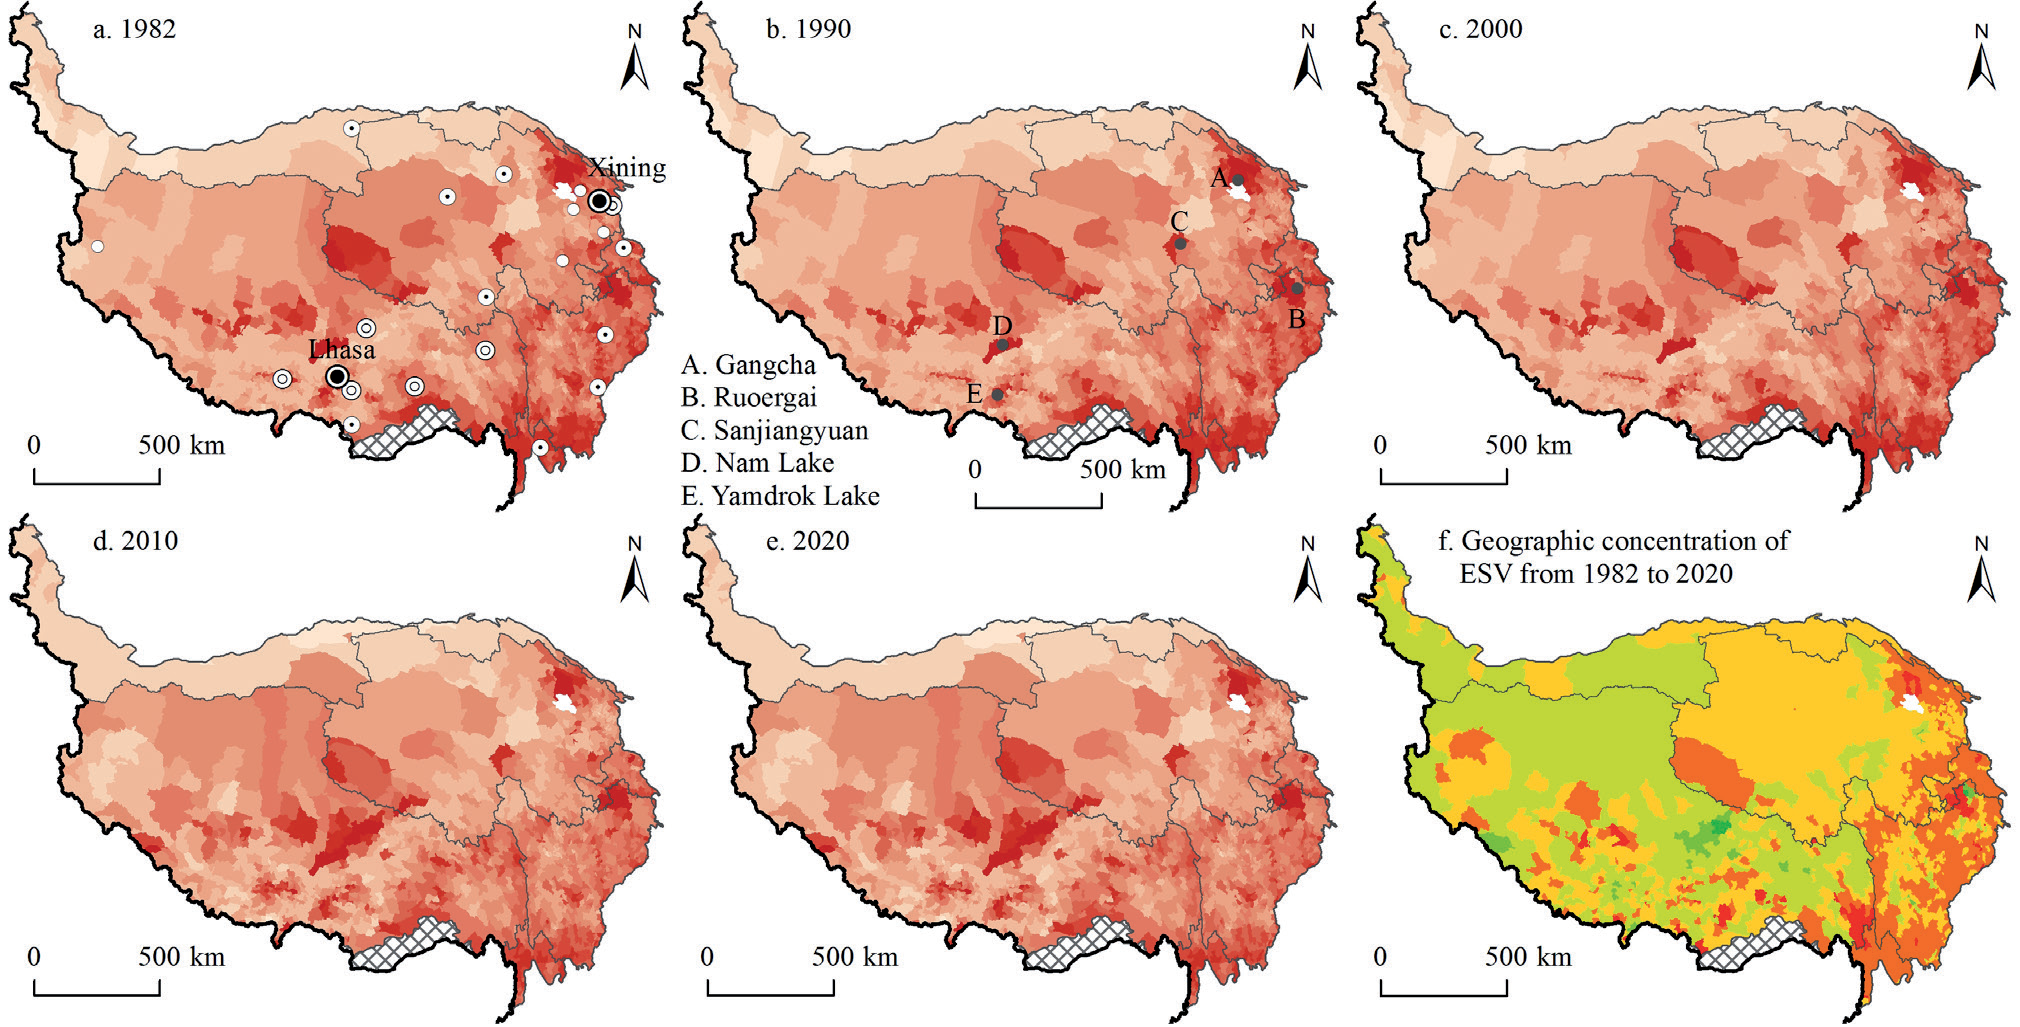
The changes in ecological geographic concentration at the township level (Fig. 6f) showed that townships with positive concentration change values (indicating ecological improvement) were clustered in Tibet and Xinjiang, with a few townships in Qinghai and Sichuan also experiencing an increase. Conversely, townships with negative concentration change values were primarily found in the Three Parallel Rivers areas of Sichuan, Gansu, and Qinghai, with some townships in Tibet demonstrating negative trends.
Townships in the Three Parallel Rivers area, Sichuan, Gansu, and northeastern Qinghai, exhibited relatively high ecological geographic concentrations; however, they also showed a negative trend, indicating a decline in ESV in these regions. These findings suggest that compared to the sparsely populated northwestern side of the “Qilian-Jilong Line”, the eastern regions of the plateau have a more favorable climate and host numerous nature reserves and national parks. However, the ecological challenges faced in these areas are even more complex.
Spatiotemporal Cluster Changes in Ecological Geographic Concentration
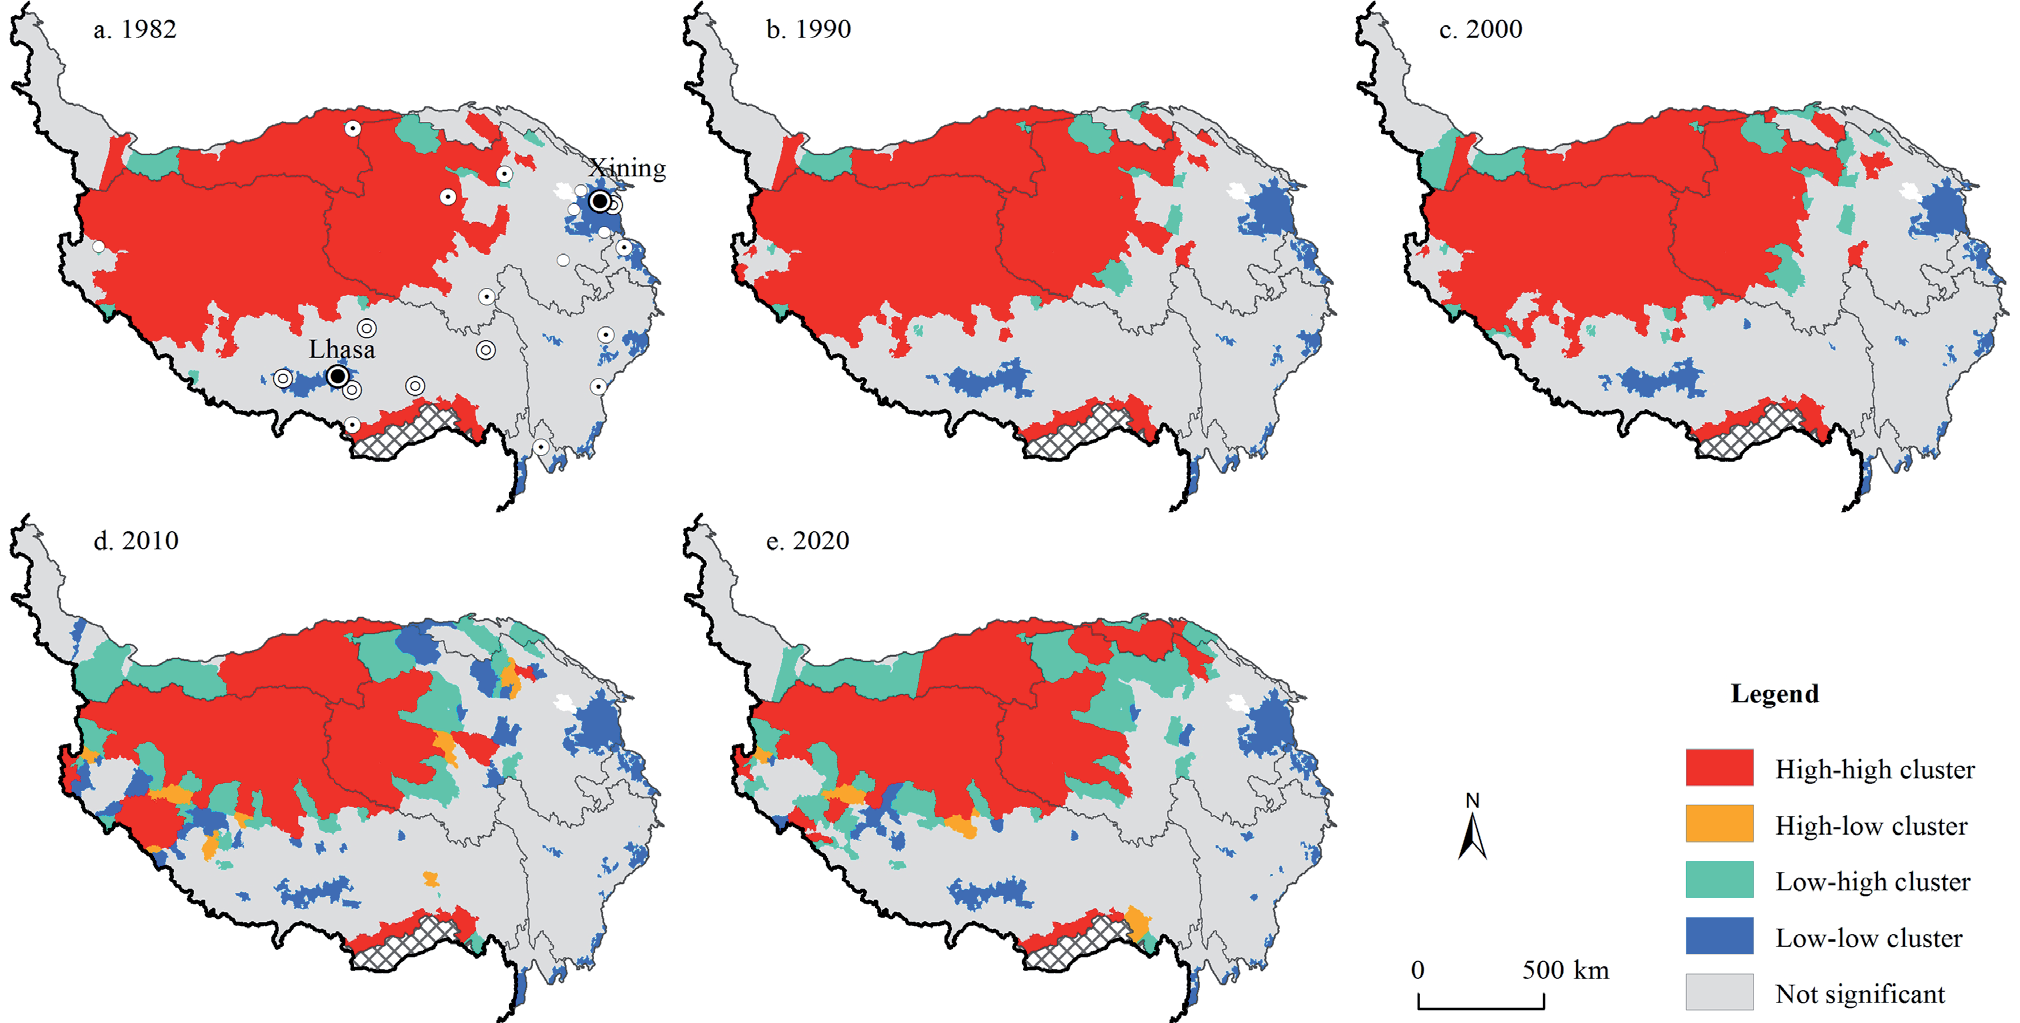
The global Moran’s I indices for ecological geographic concentration at the township level on the Tibetan Plateau were 0.715, 0.714, 0.693, 0.652, and 0.684 (Table 2), indicating a significant positive spatial association. This demonstrates that the distribution of ecological geographic concentration is not random, but exhibits spatial clustering. Using local spatial autocorrelation methods, the features of ecological geographic concentration revealed a relatively stable regional spatial distribution pattern (Fig. 7). Townships with LL clusters were predominantly located in the northern Tibetan Plateau (Ali, Qiangtang Plateau, Ruoqiang, and Qaidam Basin) and other mountainous areas. In contrast, the HH cluster townships were mainly found in the Three Parallel Rivers area, the northern shores of Qinghai Lake, Ban’ge, Sichuan’s Ruoergai, and Hoh Xil (Maqu Township).
Significant changes in the types of ecological geographic concentration clusters include some townships in the Qiangtang Plateau, such as Gumu, Rongma, and Cuozheqiangma, which have shifted from an LL cluster to a non-significant cluster. The townships near Namtso changed from a non-significant cluster to an HH cluster. The number of HH cluster townships in the Three Parallel Rivers area decreased.
Coordination between Population and ESV
To further explore the relationship between population and ESV, this study utilized correlation analysis, bivariate spatial autocorrelation, and spatial mismatch indices to reveal the coordination status between population and ESV at the township level on the Tibetan Plateau.
Correlation Analysis
Using Spearman’s rank correlation coefficient in SPSS software, the correlation coefficients for 1982, 1990, 2000, 2010, and 2020 were -0.314, -0.302, -0.300, -0.197, and -0.173, respectively (p < 0.01). These results indicate a strong negative correlation between population density and ESV, suggesting a clear lack of coordination between the two, although the degree of discordance decreased over time.
Spatial Association Features
The results of the global Moran’s I index indicate a significant negative spatial relationship between population geographic concentration and ecological geographic concentration (Table 2), with values of -0.479, -0.538, -0.561, -0.570, and -0.582. The predominant pattern on the Tibetan Plateau is the Low (ESV)-Low (population) cluster, mainly concentrated on the northwestern side of the “Qilian-Jilong Line” (Fig. 8).
Fig. 8.
Bivariate local spatial autocorrelation between population geographic concentration and geographic concentration of ESV on the Tibetan Plateau.
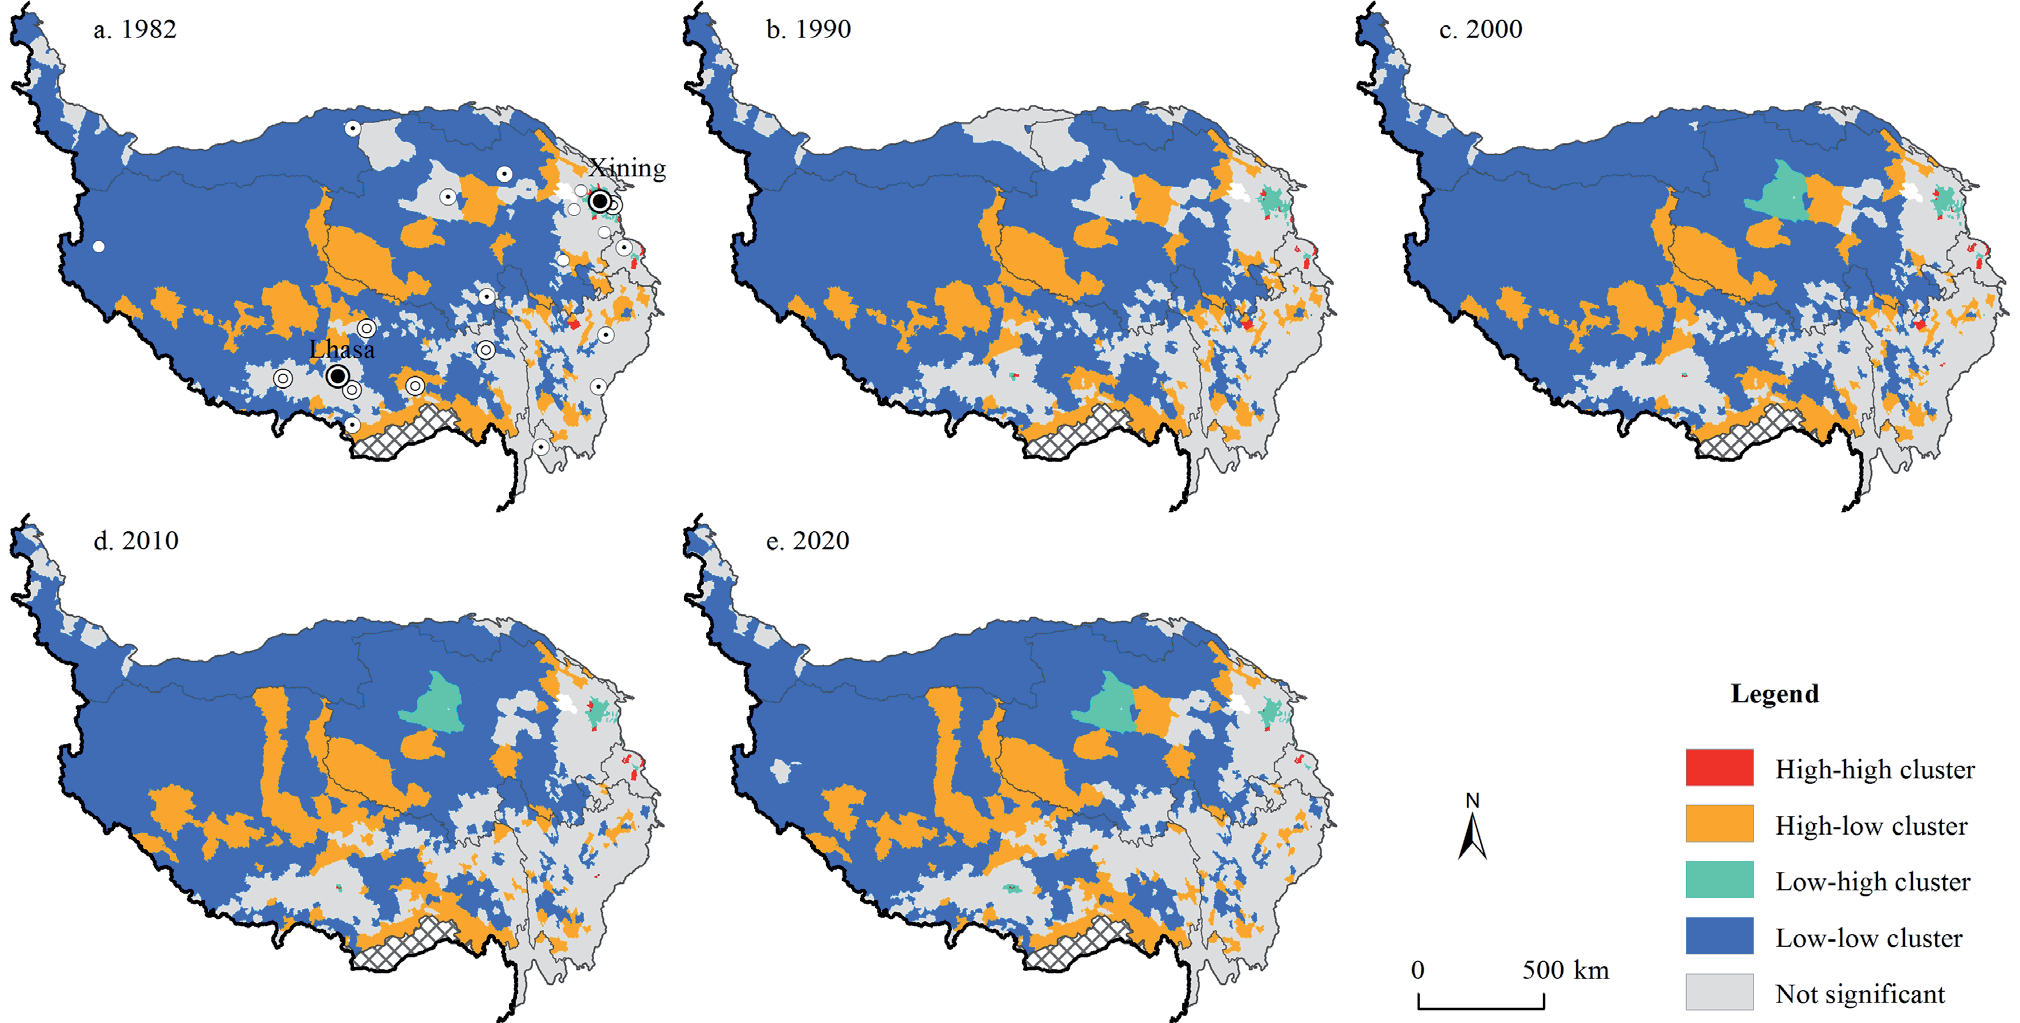
Fig. 9.
Spatial-temporal pattern of spatial mismatch between population and ESV on the Tibetan Plateau.
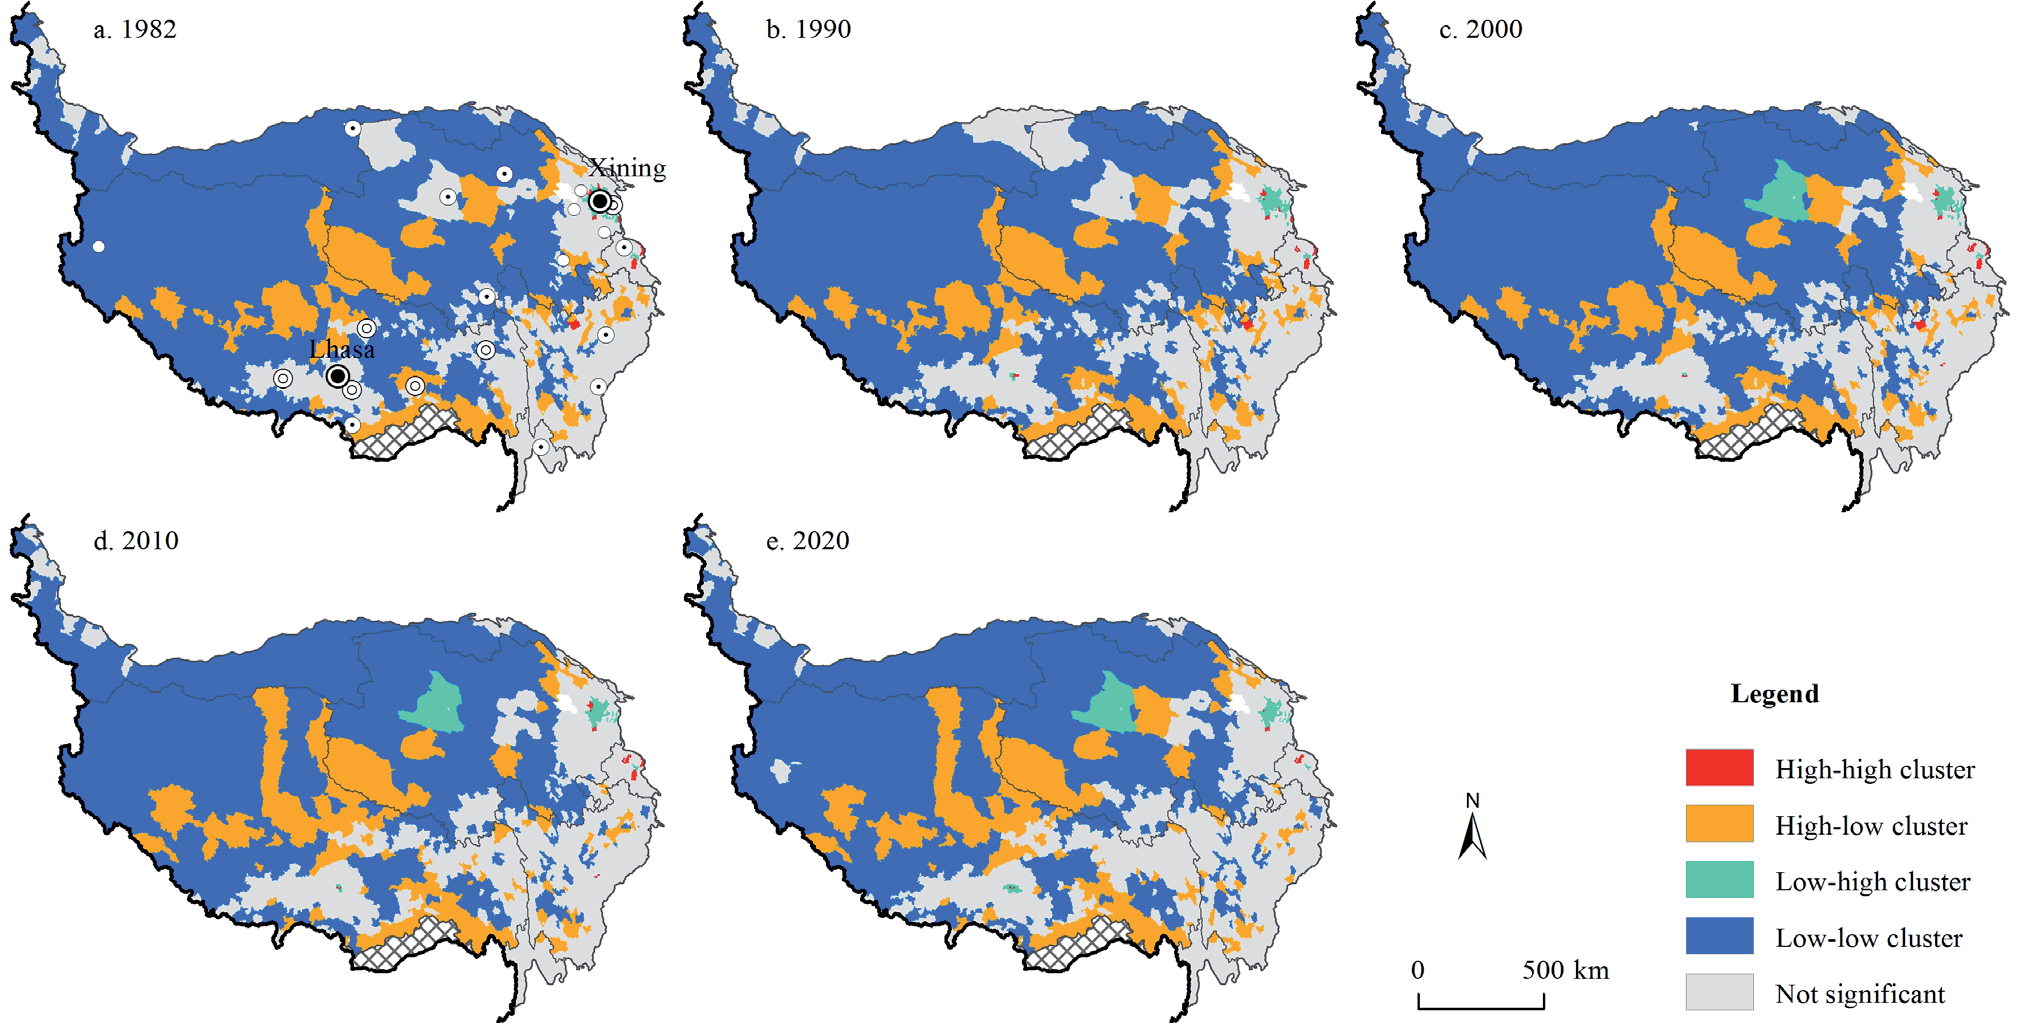
These areas typically have large grasslands with little forest cover and are affected by factors such as wetland degradation and population changes, leading to reduced ESV and lower population densities. Townships with HL clusters were mainly located in areas with multiple lakes and wetlands in Tibet, Sanjiangyuan, and the southern forests of Tibet. High (ESV) - High (population) cluster townships are few and scattered in the eastern part of the plateau and typically feature broad rivers, lakes, and wetlands. Townships with an LH cluster are clustered in areas with higher levels of urbanization such as Xining, Haidong, Lhasa, and Golmud, particularly concentrated in the Hehuang Valley and the valley area of “One River and Two Tributaries” in Tibet.
Coordination and Evolution Characteristics
Based on bivariate spatial autocorrelation analysis, spatial mismatch indices further elucidated the types, intensity, and evolution of mismatches between the population and ESV at the township level across the Tibetan Plateau (Fig. 9). Overall, the predominant type on the plateau is a positive mismatch, followed by a negative low mismatch, with fewer townships exhibiting a negative high mismatch. Overall, these patterns suggest a good level of coordination between ecological and population factors across the plateau.
Examining the spatial distribution and evolution over the years, townships with positive high/medium mismatches were located in areas such as the Qaidam Basin (excluding Golmud), Hoh Xil, Ruoqiang, and the Qiangtang Plateau. These regions are characterized by vast areas with sparse populations and high total values of ecosystem services but low population densities. The most widely distributed mismatch type was a positively low mismatch, covering most townships on the plateau. In contrast, townships with negative mismatches are spatially concentrated in areas such as the Hehuang Valley, the valley area of “One River and Two Tributaries” in Tibet, the Three Parallel Rivers area, and along the China National Highway G317 [34, 42]. These areas feature extensive agricultural and developed land, particularly in major urban centers, such as Xining, Haidong, Lhasa, and Golmud (negative high mismatch). These regions have large population concentrations, leading to a lower ESV, high population density, and a high degree of urbanization, resulting in a higher level of discordance.
Discussion
The Tibetan Plateau is one of the most environmentally fragile regions globally, and changes such as population growth, climate change, and environmental degradation have significantly exacerbated the vulnerability of ecosystem service functions and sustainable development capacity. The Chinese government has consistently pursued coordinated regional and high-quality development. ESV is closely linked to sustainable livelihoods, quality of life, and the subjective well-being of minority ethnic groups in the plateau region, such as the Tibetan, Mongolian, and Hui ethnic groups. Therefore, this study, utilizing data from various population censuses and land-use/land-cover datasets, explored the spatiotemporal evolution patterns and characteristics of the population and ESV at the township level on the Tibetan Plateau for the first time and measured the coordination between the population and ESV.
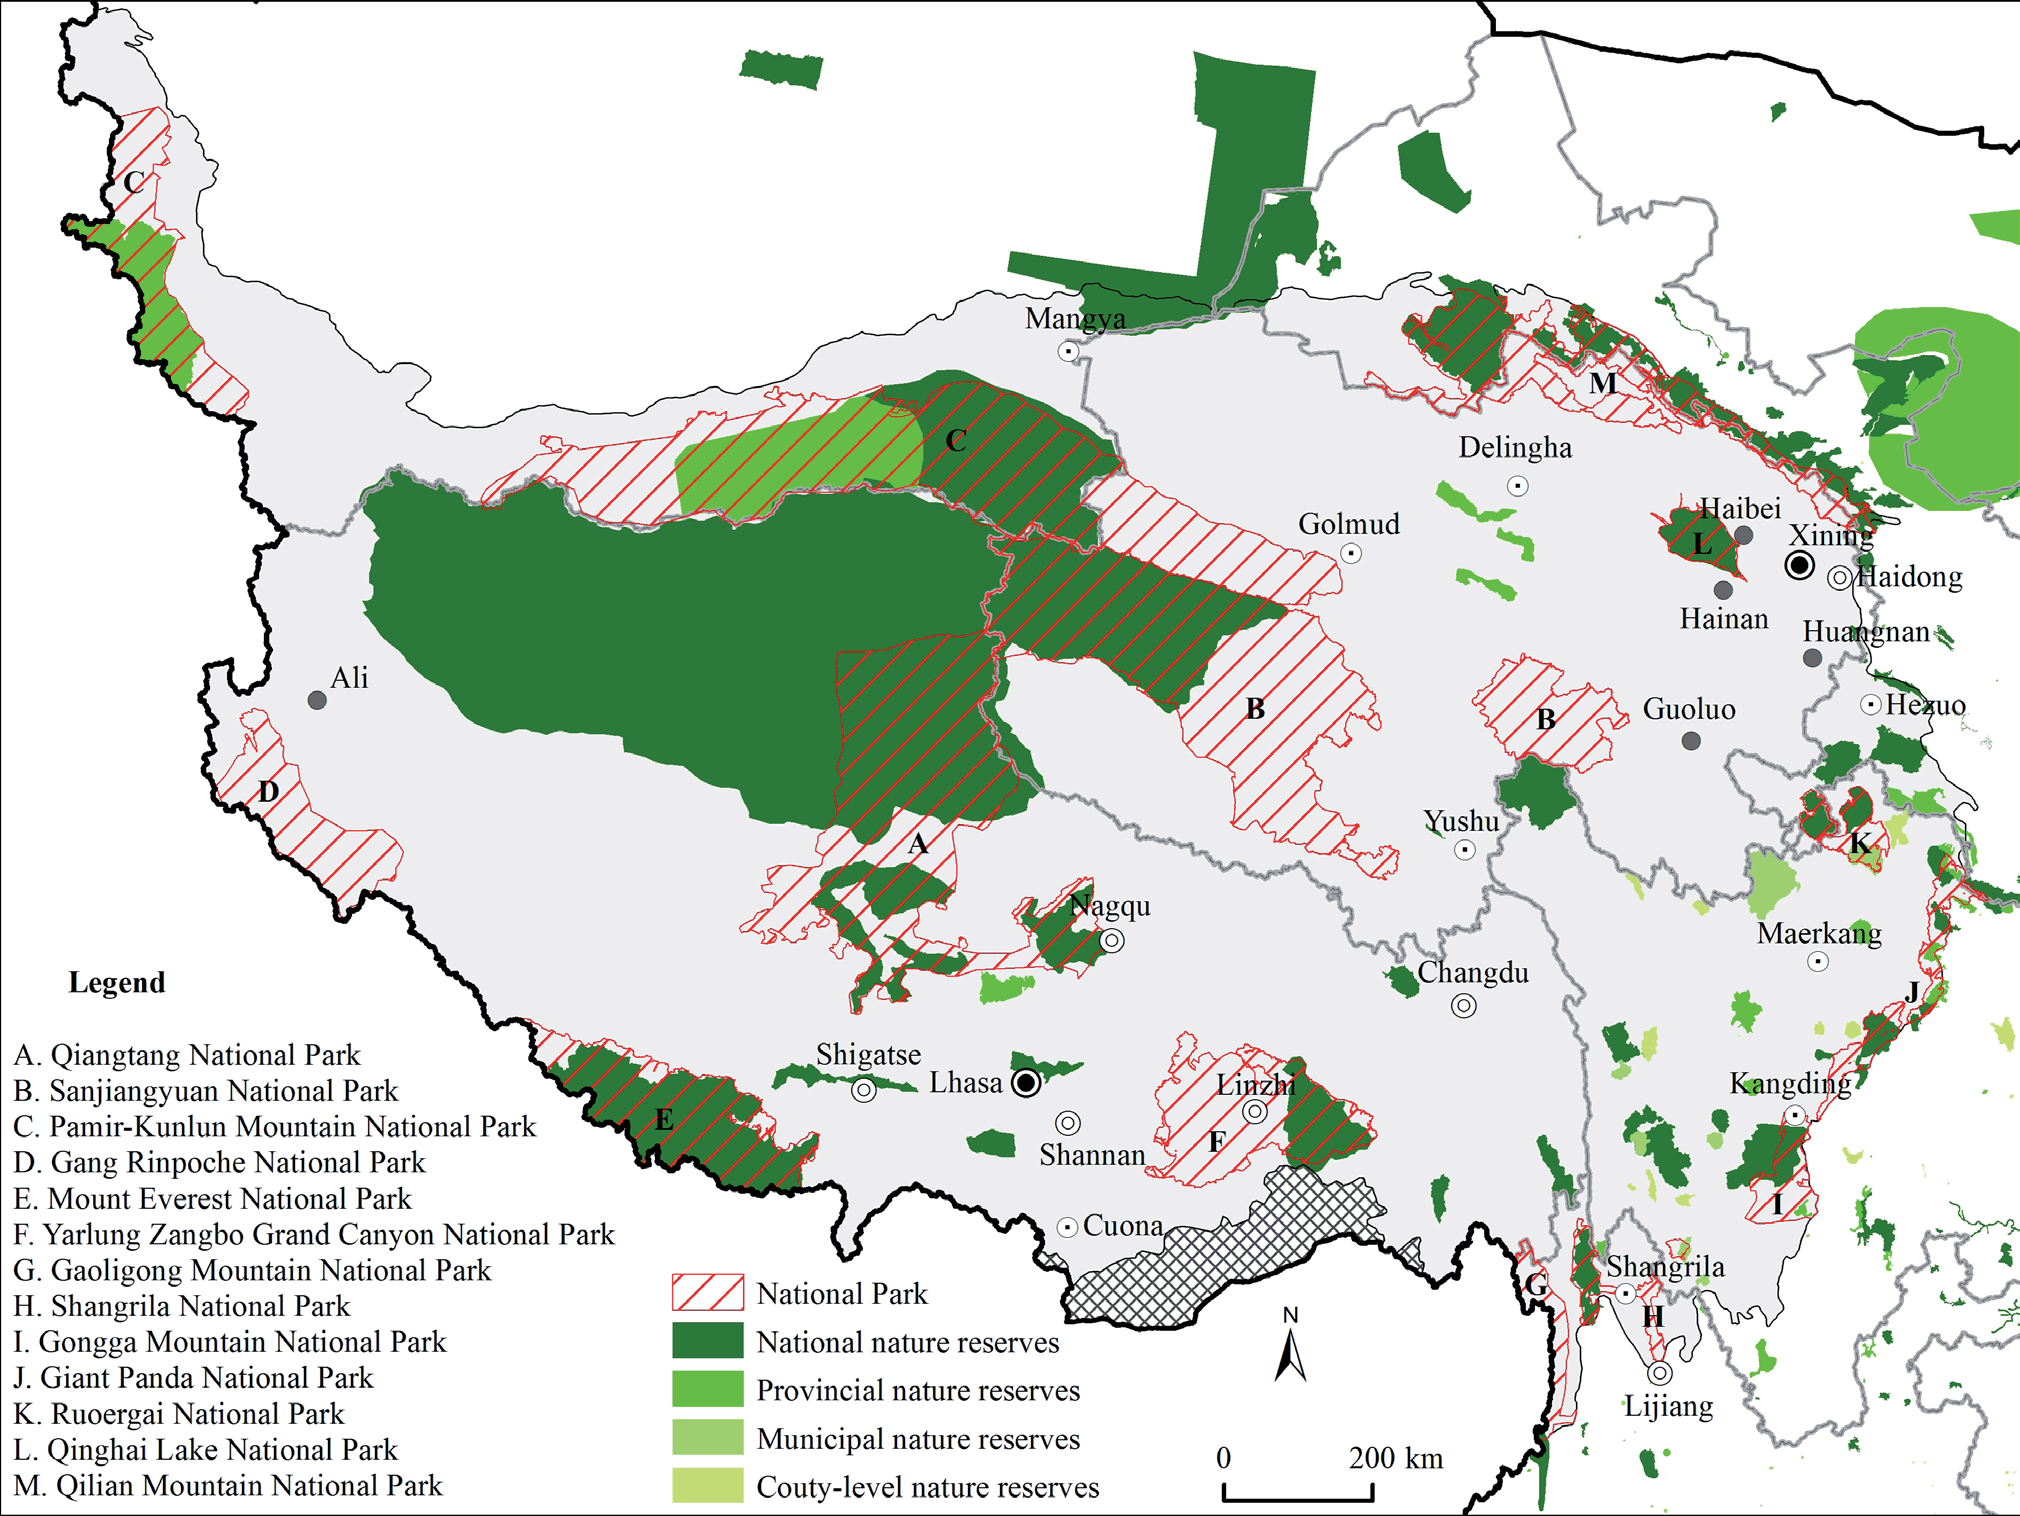
The results of the ESV measured in this study for the Tibetan Plateau are more consistent with those of Xie et al. (2003) [17] and Wu et al. (2022) [43], but show significant discrepancies with the results of Chen et al. (2021) [27], Cheng et al. (2019) [44], and Jiang et al. (2020) [45]. The main reason for this difference lies in using the measurement method proposed by Xie et al. (2003, 2017) [1, 17]. Additionally, our analysis of population gravity center trajectory differs from that of Gao et al. (2021) [28], particularly from 2010 to 2020. We analyzed the primary reasons, notably the rapid urbanization process in Hehuang Valley, which accounted for 85.59% of the population growth on the Tibetan Plateau. This has raised concerns regarding the ecological pressures in Hehuang Valley. Subsequent analysis confirmed our concerns: Hehuang Valley exhibits a high degree of discordance between population distribution and ESV on the Tibetan Plateau. Lastly, we noted the spatial overlap between natural reserves and national parks on the Tibetan Plateau [36, 46], with areas of population distribution and declining ecosystem services (Fig. 10), such as the Three Parallel Rivers area (Gaoligong Mountain National Park, Shangrila National Park), the southeastern edge of the Tibetan Plateau (Giant Panda National Park), and Ruoergai (Ruoergai National Park). The findings of this study provide valuable scientific insights into the ecological conservation of natural reserves and national parks on the Tibetan Plateau.
Conclusion
In the context of China’s Western Development policy and the construction of a network of national parks, this study employed methodologies such as ESV assessment, center of gravity analysis, geographic concentration, spatial mismatch index, and exploratory spatial data analysis to investigate the spatiotemporal characteristics of ESV and the population on the Tibetan Plateau at the township level for the first time, revealing the coordination between these elements. The main conclusions are as follows:
(1) The distribution of the population across the Tibetan Plateau’s townships is uneven, with an overall trend of population growth showing dense concentration in the southeast and sparsity in the northwest. The population center of gravity has shifted from moving westward within the plateau’s interior (1982–2010) to moving northeast (2010–2020). Townships with high population densities are concentrated in the Hehuang Valley, the valley area of “One River and Two Tributaries” in Tibet, the southeastern edge of the plateau, and county and prefecture capitals, whereas sparsely populated townships are located along the “Qilian-Jilong Line” in the northwest. The geographic concentration of the population also displays distinctive regional characteristics. Rapid urbanization in Hehuang Valley has influenced this shift in the population center from gradually moving west to moving northeast.
(2) The ESV of the Tibetan Plateau increased from 1,243.30 billion Yuan to 1,481.17 billion Yuan. Grassland ecosystems hold the highest value, with significant increases in wetland ecosystem services; significant ecosystem functions include regulation of water flows, climate regulation, and waste treatment. The per-capita ESV showed a declining trend. The townships on the Qiangtang Plateau, Hoh Xil, and Ruoqiang had high ESVs. The decline in ESV in areas such as the Qiangtang Plateau, Hoh Xil, the Qilian Mountains, and Hehuang Valley due to human activities and global climate change indicates that the concentration of ecological geography in the eastern part of the plateau is declining, potentially exacerbating ecological and population issues.
(3) There is a negative correlation between population and ESV on the Tibetan Plateau; however, the degree of coordination has improved. The predominant type among townships is a positive spatial mismatch, particularly in areas such as the Qiangtang Plateau and Hoh Xil, where the total value of ecosystem services is high but the population is low, making these areas critical global ecological security barriers. Moreover, this study reveals that urbanization in areas such as the Hehuang Valley, the valley area of “One River and Two Tributaries” in Tibet, and the Three Parallel Rivers area has severely impacted the ecological environment.

