

Introduction
The ecological environment is highly important as a spatial carrier for the production, living, leisure and recreational activities of people [1], while the economy and population always constitute the core of regional development [2]. After the reform and opening up, China’s economic development was remarkable, but at the same time, problems related to resources and the environment became increasingly prominent. This has affected the production activities and lives of people and poses a notable obstacle to economic transformation and development [3]. The regional economy, population and ecology are closely linked [4]. To achieve healthy socioeconomic development and efficient operation, the economy, population and ecology should be effectively integrated and coordinated [5]. Therefore, the coordination of regional economic, demographic and ecological development has become an urgent issue.
Research on the relationships among population, economy and ecological environment has an early history, yielding fruitful results, and related research has mainly focused on the relationships between the two systems, i.e., population and economy, and the ecological environment. There are three widely known theories on the relationship between population and economic development: optimistic, pessimistic, and moderate theories. According to optimistic theory, there is an optimistic attitude towards population growth, and it is considered that an increase in population facilitates the promotion of social and economic development. Keynes proposed the well-known long-term stagnation theory, which states that in a mature economy, the decline in population growth is the main reason for the decrease in the social demand and investment, and a population surge is conducive to reversing the population growth trend [6]. According to pessimistic theory, a population increase will likely negatively impact socioeconomic development. Coale and Hoover proposed that continued population growth will hinder economic development, which is the main reason why developing countries will become poorer; therefore, they advocated limiting the increase in population to prevent this phenomenon [7]. The moderate theory states that population growth in a given country or region should match the development of the regional economy, resources and environment. Wicksell first proposed the concept of a moderate population, noting that the population size and density of a country should remain within a reasonable range and that the total population should not exceed the national population density. Furthermore, they noted that the total population should not exceed the capacity of the agricultural resources and food supply [8]. The relationship between population and ecological environment can be divided into two main schools of thought: pessimists and optimists. Scholars of the pessimistic school consider that an unlimited increase in the population size will put pressure on the ecological environment and generate a negative impact. Wallace noted that there should be a necessary limit to population growth; otherwise, population growth could exhibit geometric progression, could be easily disturbed by external factors (diseases, wars, etc.) and could be reactivated [9]. Optimists, such as Boserupt and Kahn, noted that with the continued improvement in science and technology, the output efficiency of material resources will accordingly be improved [10, 11]. The relationship between the economy and ecosystem has been widely investigated, with Li revealing the spatial and temporal impacts of sustainable development of the ecosystem services and economy in Shanxi Province, which could help promote sustainable development and optimize ecosystem decision-making [12]. Based on the above studies, relevant shortcomings remain: (1) there are still relatively few studies on the relationships among the above three systems, and the coordination of regional economic, demographic and ecological development has become a prominent problem. (2) Fewer temporal and spatial analysis studies have been performed between regions, and the characterization of the coupled and coordinated spatial and temporal relationships of these three systems among cities is highly important for ensuring sustainable development. (3) Quantitative evaluation of ecological subsystems mostly depends on ecosystem service value assessment, while the Gross Ecosystem Product (GEP), as a supplement to and development indicator of the ecosystem services in China, is less commonly used in coupled coordination systems, while this system better conforms with research on the coupled coordination system of the regional coupled coordination system of China.
The Bohai Rim region (BRR) is one of the most dynamic, open, and innovation-driven regional growth poles in the Chinese economy. It is well positioned for development due to its rich land resources and strong port base. In addition, it has the potential to become a highly influential economic belt in the regional economy of China and even Northeast Asia, following the footsteps of the Yangtze River Delta and the Pearl River Delta [13]. Nevertheless, the rapid development of the BRR is challenged by ecological, economic and population imbalances. Under the visionary guidance of the nation’s ecological civilization theory, a research area comprising 43 cities in the BRR is considered. An accounting framework for the GEP that considers the characteristics of the BRR was developed using land use data, weather station data and socioeconomic statistical data; these data were subsequently used as ecological indicators. Additionally, a system of regional economic and demographic indicators was used. To explore the implications of these findings, advanced methodologies, including the entropy weight method, coupled coordination degree (CCD) model, and techniques such as the standard deviation ellipse and centroid shift, were adopted. The objectives are as follows: (1) to determine the changes in the GEP in the BRR at the considered time scale, (2) identify the spatial change process of the three coupled coordination study periods in the BRR, and (3) analyze the CCD in the BRR to explore the spatial correlation. This study aims to promote sustainable development with harmonious coexistence of the population, economy and ecology in the BRR. Creating a mutually beneficial relationship between the ecology, population and economy could lead the region to a promising future.
Data Sources and Methodology
Overview of the Study Area
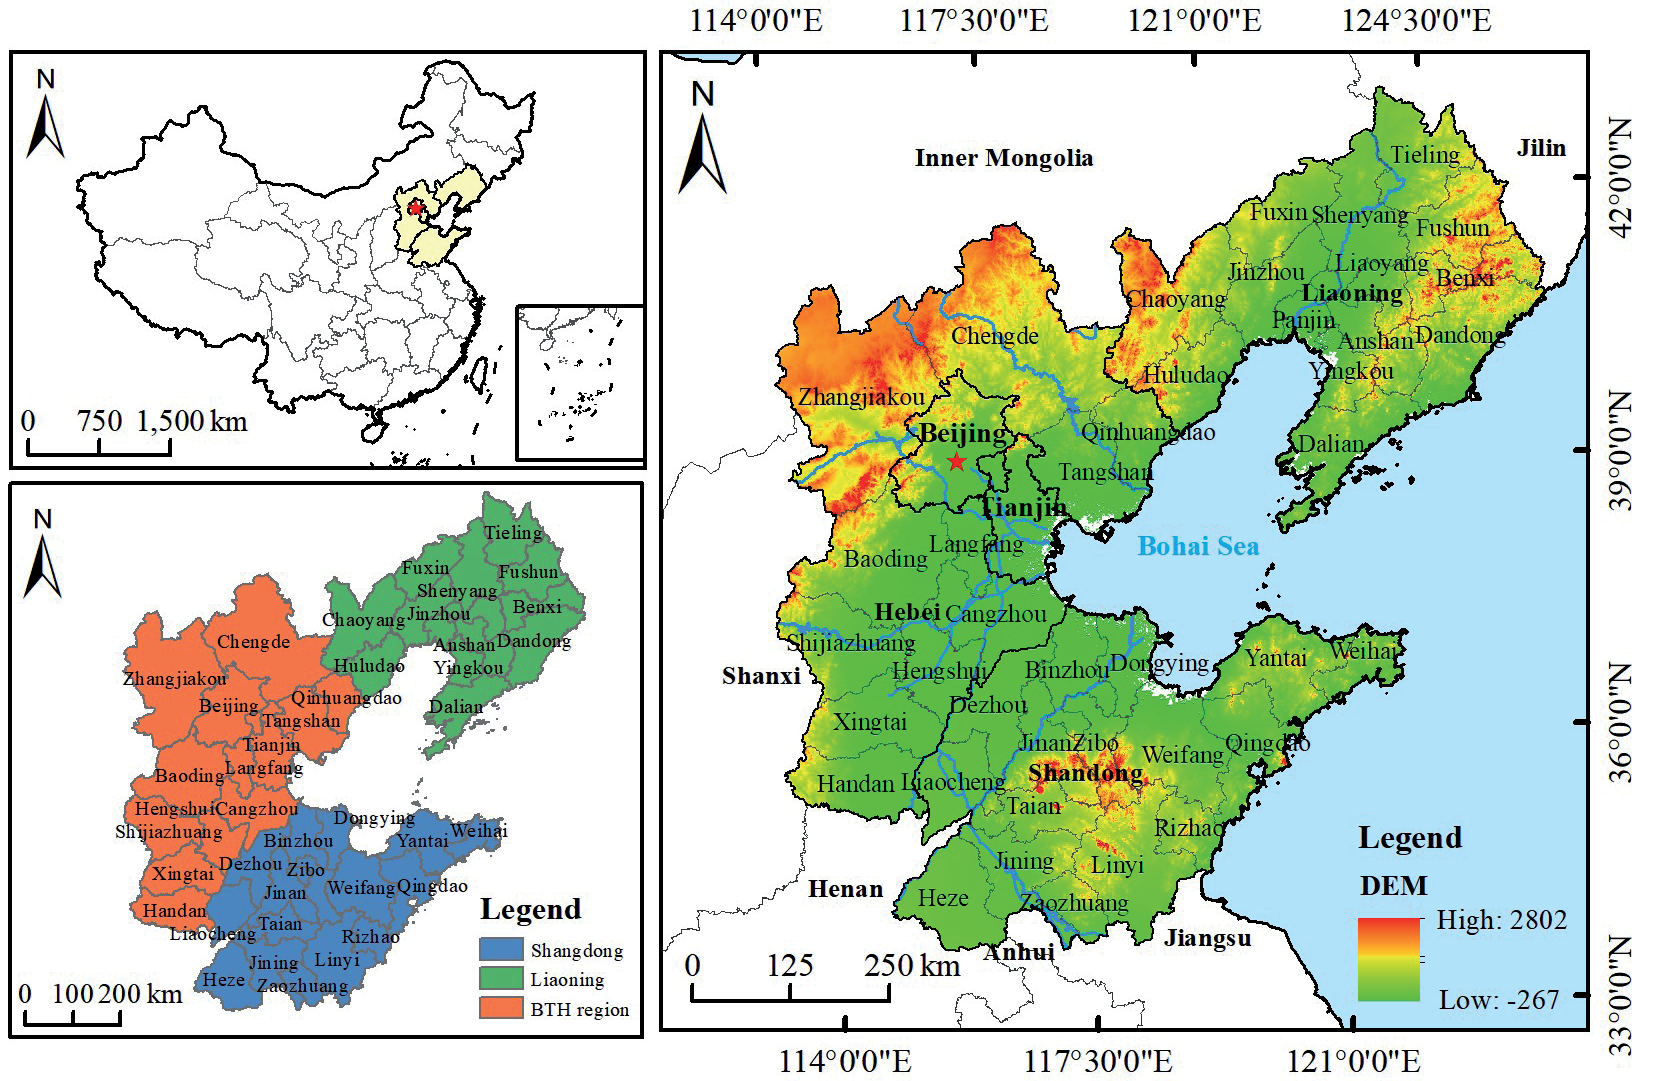
The BRR, also referred to as the Bohai Economic Region, is surrounded by the Liaodong Peninsula, Shandong Peninsula and North China Plain, exhibiting a C shape (Fig. 1). It mainly covers 43 cities in the Beijing-Tianjin-Hebei (BTH) region (Beijing, Tianjin and Hebei Provinces), Liaoning Province and Shandong Province. The total land area is 515,000 km2. As of 2020, the population of these five provinces and municipalities was 256 million, accounting for 19.80% of the total population of China. The regional gross domestic product (GDP) reached 18.47 trillion yuan, accounting for 18.23% of China’s national GDP. From a geographic standpoint, the BRR is not only the central part of the Northeast Asia Economic Zone but also one of the starting points of the China-Eurasia Land Bridge in the eastern part of the continent, connecting Europe and Asia. The topography of the BRR slopes from northwest to southeast, with the northern and western parts of the region having high terrain, while the central and eastern parts consist mostly of plains. The large number of rivers in the region, coupled with its unique geographical advantages, provides favorable conditions for population concentration. From the perspective of economic development, the BRR is the engine of development in northern China and the third-largest growth pole of China’s economic development. Due to differences in economic development, population growth, and environmental degradation, the spatial development of the entire BRR varies, obviously. Hence, this article delves into the coupled and coordinated relationships among the economy, population, and ecology in the region to provide policy recommendations for its future development.
Data Sources
The land use data in this study were derived from the Annual China Land Cover Dataset (CLCD), compiled by Wuhan University [14]. This dataset utilizes all available Landsat data from the Google Earth Engine (GEE) platform, as well as stabilized samples extracted from the China Land Use/Cover Dataset (CLUD) and training samples collected through visual interpretation from sources such as Google Earth. The Chinese land use classification was generated using a random forest classifier. The meteorological data used in this study were derived from the ERA5 single-level monthly average dataset covering the period 1979 to present. ERA5 (ECMWF Re-Analysis 5) is a fifth-generation reanalysis product of global climate and weather data spanning the past 40 to 70 years developed by the European Centre for Medium-Range Weather Forecasts (ECMWF) [15]. The ERA5 data were extracted and organized on an annual basis to obtain information on variables such as precipitation, evaporation, and surface runoff for the 43 study unit stations in the BRR. These data provide comprehensive soil information worldwide. Additionally, data on agriculture, forestry, animal husbandry, fisheries, and landscape and tourism were obtained from the China Urban Statistical Yearbook [16] and the statistical yearbooks for each province [17-21].
Studies on the level of economic development that use the framework of the coupled and coordinated model have reached a relatively mature stage. Two main approaches have been commonly employed: the single indicator method (utilizing per capita GDP) and the comprehensive indicator method. In this study, the total GDP, per capita GDP and per capita local fiscal revenue were selected as indicators of the scale of regional economic development to comprehensively reflect the regional level of economic development. The per capita fixed asset investment and per capita local financial revenue were chosen to reflect the quality of regional economic development. The proportion of secondary industry and the proportion of tertiary industry were selected to represent the structure of regional economic development. The population data in this study were established based on the total population to reflect the scale of population development in the region. The urban population and urbanization rate were used to reflect the level of population development, while the natural growth rate and population density were used to reflect the quality of population development in the region. The weights of the indicators obtained by the entropy method are presented in Table 1.
Table 1.
Development of the Indicator System and Weights for the Economy and Population.
Gross Ecosystem Product Research Method
GEP refers to the total value of various final products and services provided by ecosystems for human well-being and sustainable economic and social development. The term primarily includes the value of material products, regulating services, and cultural services provided by ecosystems [22]. The calculation of GEP consists of two parts: functional assessment and value assessment. In the present work, indicators were comprehensively selected to estimate the GEP of the BRR by considering the characteristics of the BRR and drawing from the experience and methods of GEP assessment in other regions. Three primary indicators, namely, material products, regulating services, and cultural services, are considered, as are eleven secondary indicators, such as agriculture, forestry, animal husbandry, fisheries, climate regulation, and landscape tourism. The GEP can be expressed as follows:
In Equation (1), GEP represents the ecosystem service value, EPV represents the total value of material products, ERV denotes the total value of terrestrial regulating services and ECV is the total value of cultural services; all values are measured in CNY per hectare (yuan/a). Specific details regarding the indicator system and calculation methods for the GEP in the BRR are shown in Table 2.
Modelling of the Coupled Coordination Degree
Construction of a Coupled Coordination Degree Model
The degree of coupling allows us to determine whether the system is coordinated through its interactions and provides an indication of the level of coordination [35]. To construct a coupled coordination model for the ecology, economy and population, the specific steps are as follows:
1. Construction of the ecology-economy-population coupling model
Calculation of the coupling degree, C:
In Equation (2), C represents the degree of coupling. U1, U2, and U3 denote the comprehensive indices of ecology, economy and population, respectively, for each research unit.
2. Construction of the ecology-economy-population coupled coordination model.
Calculation of the coupled coordination degree, D:
Table 2.
Indicator System for Calculating the GEP in the BRR.
In Equation (3), D represents the degree of coupled coordination. T indicates the coordination index. α, β, and λ are the weights assigned to ecology, the economy and the population, respectively; in this case, α = β = λ = 1/3.
Furthermore, the CCD was divided into 8 stages, representing 8 distinct levels of coordination [36]. The specific classification is listed in Table 3.
Construction of Spatial Measurement Models
The spatial autocorrelation model can measure the spatial clustering characteristics of a variable. This approach is mainly used to analyze the spatial dependency or spatial correlation between the CCD and the geographic locations of the study units.
The literature referenced in this study employs the global Moran’s index to assess the presence of spatial correlation among cities [37]. Moran’s index can be calculated as follows:
Table 3.
Ecological-Economic-Demographic Coupling Harmonization Classification Levels.
In Equation (5), n represents the number of provinces. xi and xj denote the coupled coordination between research unit i and research unit j and their respective means, respectively. wij represents the spatial weight matrix. The Moran’s index ranges from -1 to 1. The global Moran’s index test determines the presence of spatial correlation but does not provide spatial correlation characteristics. Therefore, further calculations were needed to compute the local Moran’s index. Local Moran’s index can be calculated as follows:
Standard Deviation Elliptic Matrices and Centre of Gravity Analysis
The standard deviation ellipse is a spatial statistical method that quantitatively describes the overall characteristics and spatiotemporal evolution of the spatial distribution of research objects through various parameters, such as the centroid, major axis, minor axis, and rotation angle. The spatial extent of the standard deviation ellipse represents the spatial distribution of the study elements. The centroid and the orientation angle indicate the relative position of the spatial distribution of geographic elements and the main trend direction of the geographic element distribution, respectively. The major and minor axes represent the dispersion of the geographic elements in the major and minor directions, respectively. The specific calculation steps for each parameter can be found in previous studies [38].
Results and Discussion
Results of Gross Ecosystem Product Accounting
In terms of GEP (Table 4), the GEP in the BRR grew from 2,762.58 billion yuan to 5,531.04 billion yuan from 2000 to 2020. After adjustment for price factors, the growth rate reached 100.21% (based on constant 2000 prices). It exhibited a significant upwards trend. Specifically, the value of material products increased from 535.21 billion yuan to 2,056.66 billion yuan, i.e., an increase of 1,521.45 billion yuan. The actual growth rate was 284.27%. Over the past 20 years, the supply capacity of material products from the BRR has been gradually enhanced, thereby meeting the growing material demand of local residents and surrounding areas. The value of regulating services increased from 2,091.67 billion yuan to 2,470.62 billion yuan (with an increase of 378.95 billion yuan). The actual growth rate was only 18.11%, which was significantly lower than that of the material product. This reveals that human activities have imposed some issues and risks on the ecosystems in the BRR. The intensity and methods of ecosystem protection need to be strengthened and improved. In particular, the value of soil conservation decreased from 168.35 billion yuan to 157.81 billion yuan. This phenomenon suggests that rapid population growth in the BRR has led to changes in land use, which in turn has influenced the decrease in this value. On the other hand, the cultural service value experienced the largest increase, from 135.70 billion yuan to 1,003.76 billion yuan. The actual increase was 8,680.63 billion yuan, with a significant growth rate of 639.71%, implying that the BRR has prioritized the development of tourism products since 2000 (with sustained and rapid growth in the tourism industry). This is mainly attributed to the abundant tourism resources in the region and convenient transportation in the BRR.
Table 4.
GEP Accounting Results for 2000-2020.
Fig. 2.
Calculation Results of GEP Added for the Cities in the BRR. Abbreviations of the Various Services: MP: Material Products; RS: Regulating Services; CS: Cultural Services; GEP: Gross Ecosystem Product.
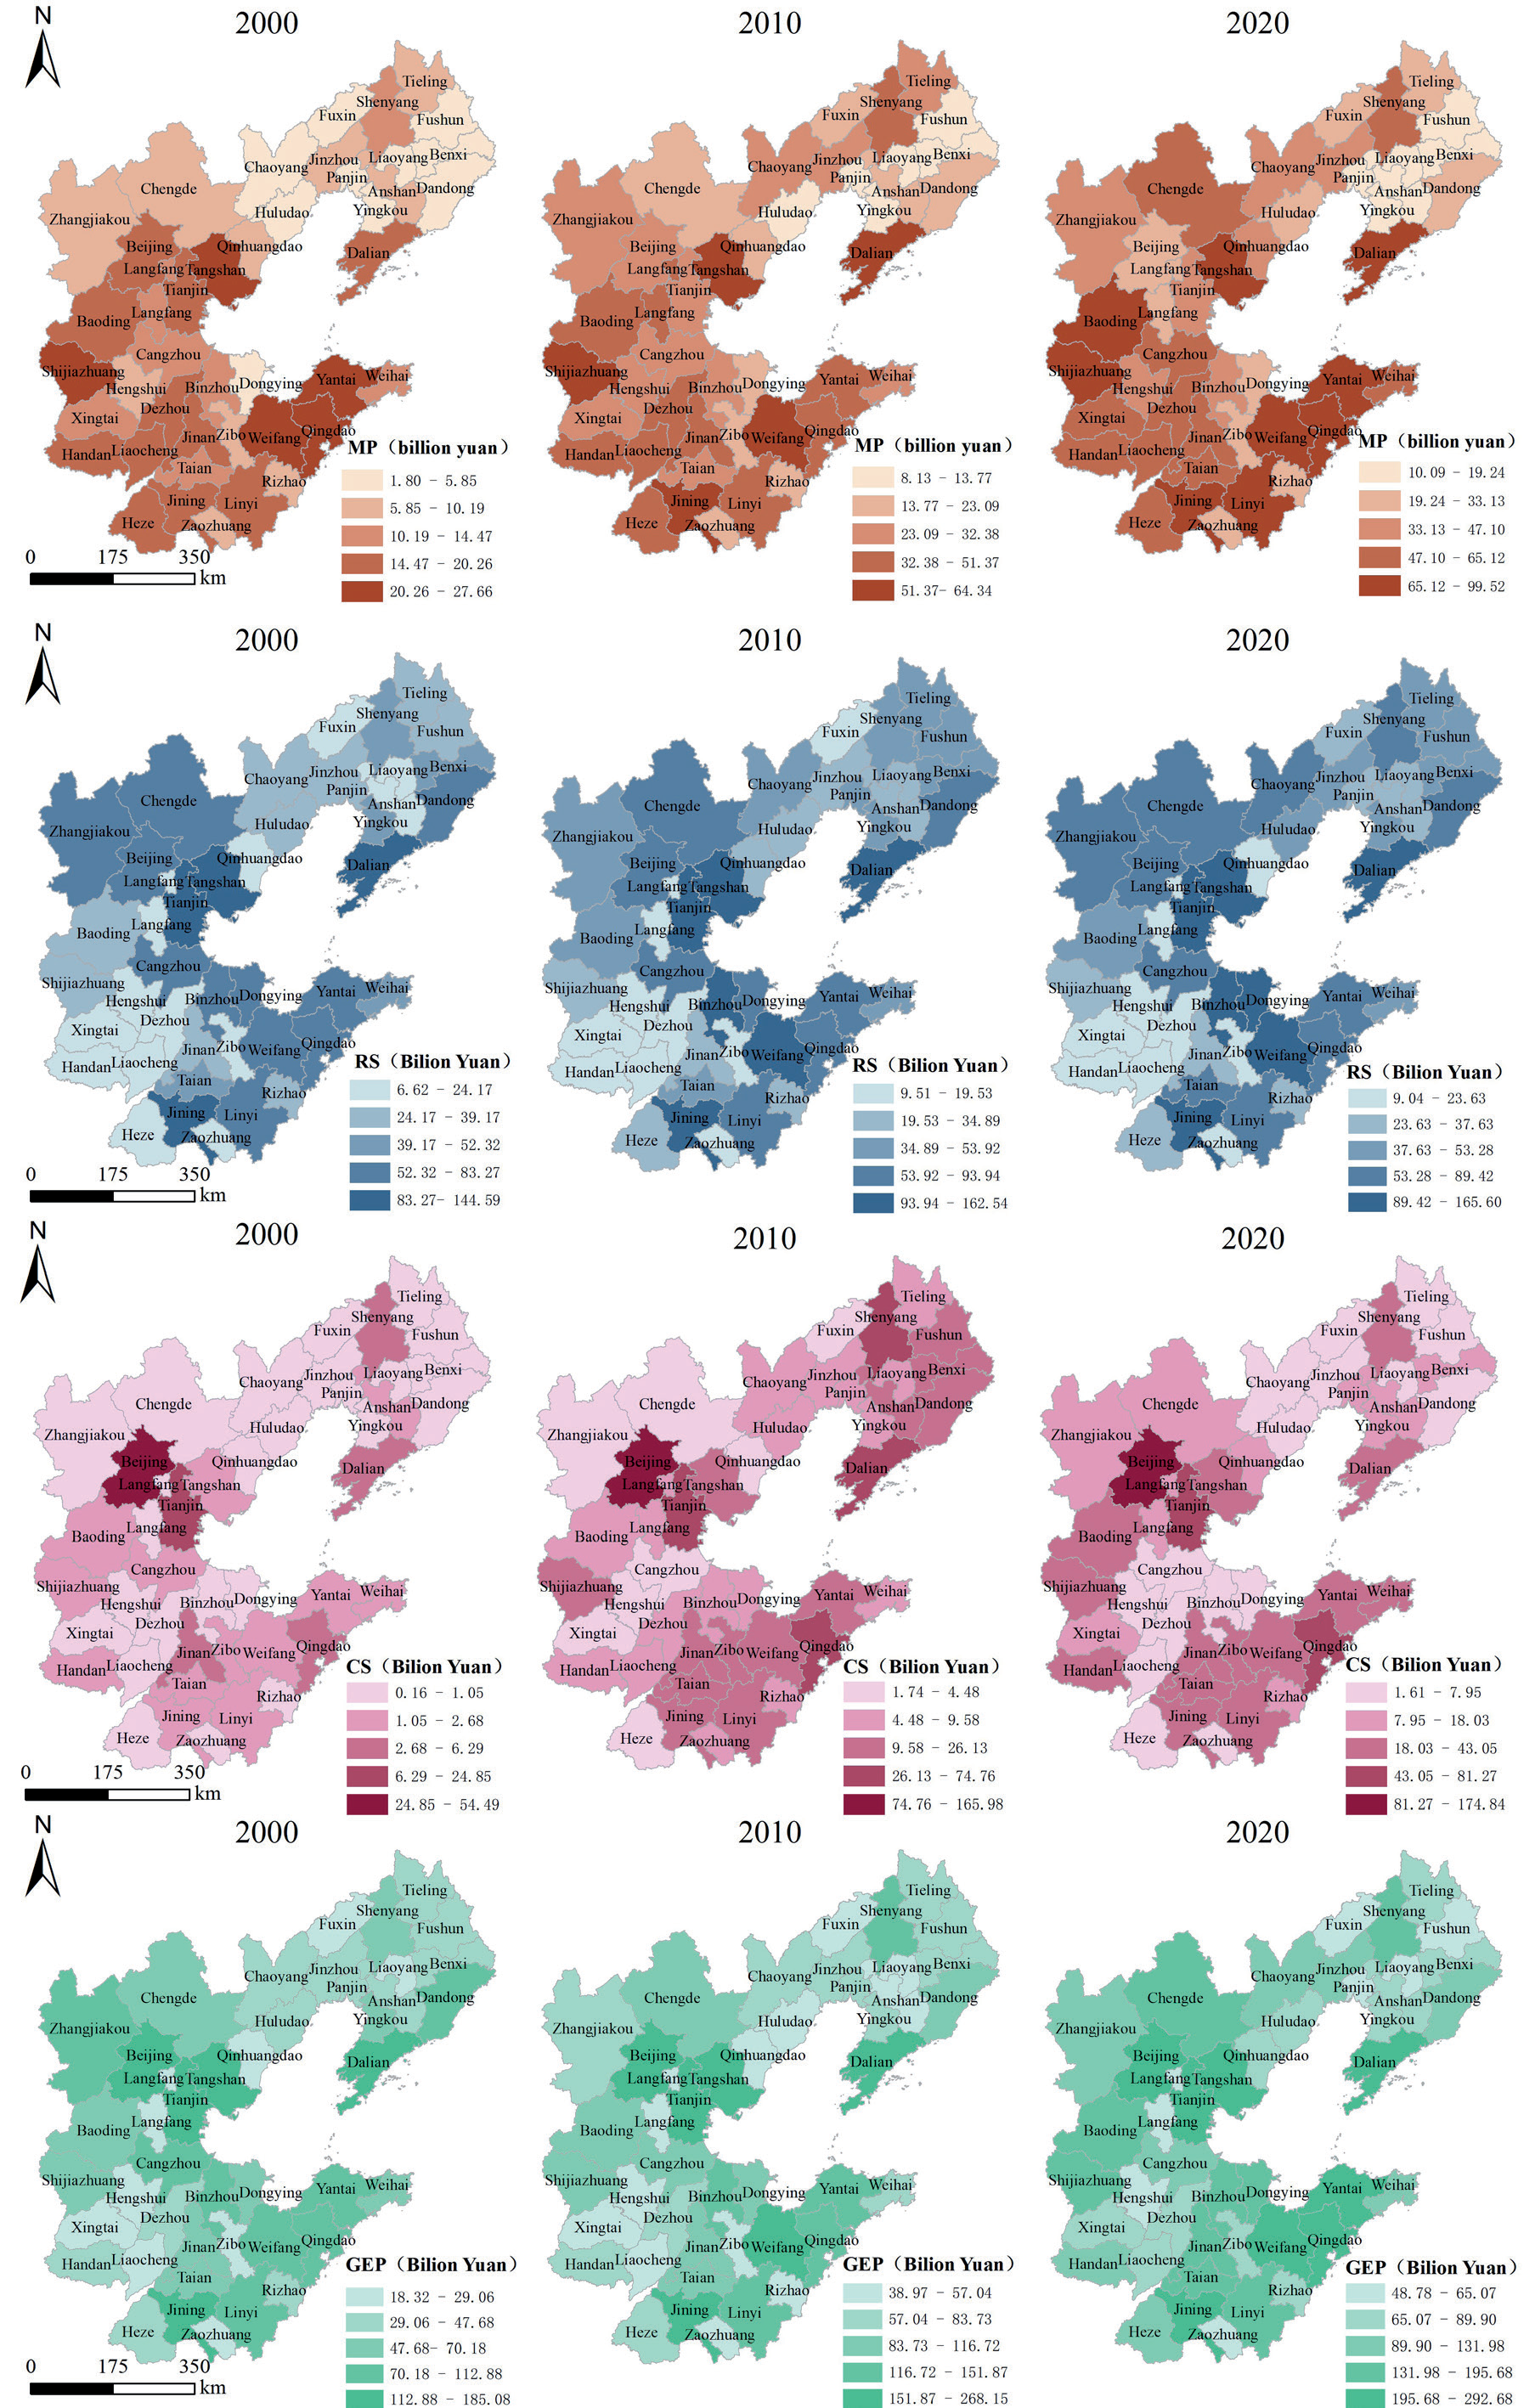
Table 5.
CCD and Level Classification Of Ecology, Economy and Population in the BRR
| Year | 2000 | 2010 | 2020 |
|---|---|---|---|
| CCD | 0.15 | 0.25 | 0.31 |
| Coupling coordination level | Severe imbalance | Moderate imbalance | Mild imbalance |
There were significant differences in the GEP among the cities in the BRR (Fig. 2). In terms of material products, cities such as Weifang, Yantai and Shijiazhuang are valued higher than other cities. For regulating services, cities such as Tianjin, Jining and Dalian have higher values of regulating services due to their rich natural resources. In addition, in terms of cultural services, Beijing, Tianjin, and Qingdao are at the top of the list due to their superior tourism resources. From the perspective of GEP, Beijing and Tianjin had the highest GEP, with both cities exceeding 250 billion yuan in 2020. Over the years, GEP accounted for approximately 10% of the GEP in the BRR, which was significantly greater than that in other cities. These cities are closely followed by Tangshan, Dalian and Jining, whose shares were more than 4% in the targeted years. These cities have rich wetland resources that contribute to the overall GEP. Cities such as Langfang, Zaozhuang and Liaoyang have a relatively low share of the GEP added, less than 1% of the region as a whole. This mainly stems from their relatively low economic level and lack of necessary infrastructure and financial and technological resources to support ecological conservation efforts. Regional innovation and development are often challenging and unsustainable in these areas. As a result, lagging efforts have emerged in terms of ecological protection. GEP Added originates from a combination of factors. Overall, the different levels of economic and social development, as well as the distinct natural environment characteristics, among the cities in the BRR have contributed to significant spatial disparities in the GEP.
Spatiotemporal Evolutionary Analysis of the CCD
According to Table 5, the overall CCD of the BRR increased from 0.15 in 2000 to 0.25 in 2010. The coupled coordination level transitioned from a state of severe imbalance to moderate imbalance. Between 2010 and 2020, the CCD further increased from 0.25 to 0.31, reaching a stage of mild imbalance. Overall, the CCD in the BRR exhibited an upward trend. However, the overall CCD remained relatively low over the 20-year period, indicating that the coupled coordination system has not yet achieved a favorable development state and that there is further room for improvement.
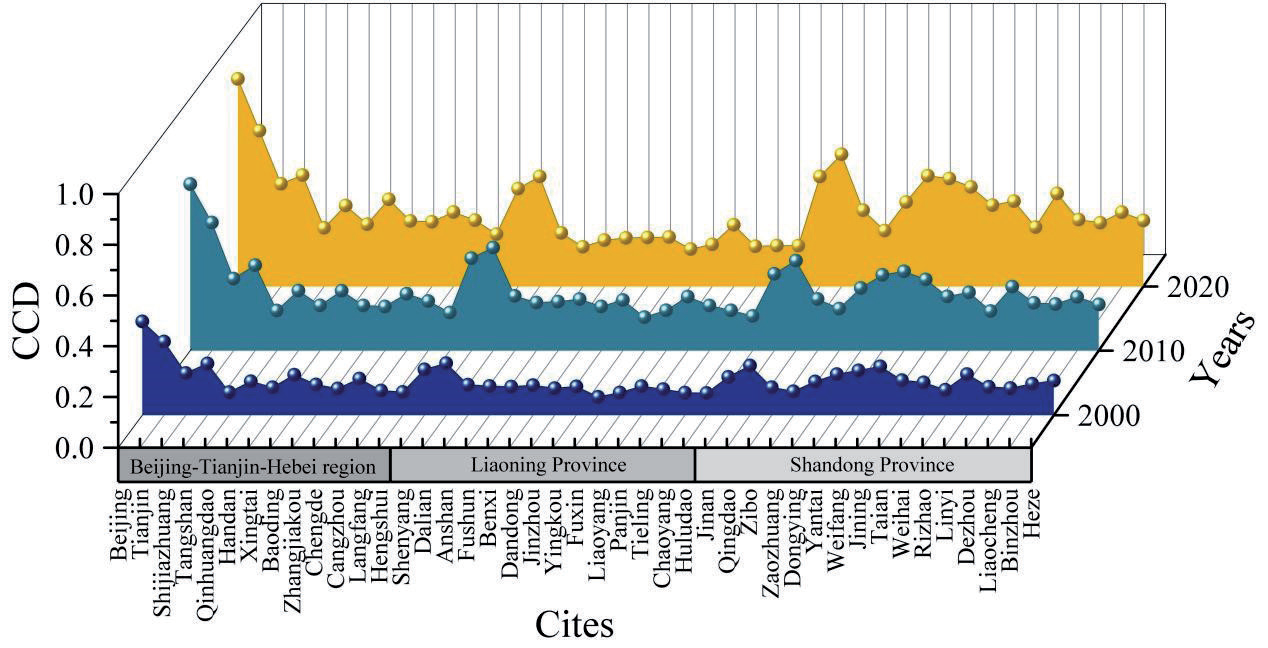
Between 2000 and 2020, the CCD in the BRR varied significantly among the cities (Figs 3, 4). In accordance with the development trend, the CCD varied greatly (from 0.1 to 0.8), and between different cities, the CCD showed an increasing trend from 2000 to 2020. This demonstrates that the BRR has been increasingly concerned with sustainable development during these 20 years. For each region, the CCD in the BTH region, Beijing, and Tianjin was greater than that in the other regions, and the CCD also reached the highest level in the BRR. In recent years, ecological and environmental management efforts have been increasing, ecological and environmental quality has continued to improve, and a greater GEP has been obtained. Moreover, the level of economic and social development has been increasing, which has led to a significant reduction in population pressure due to the phenomenon of urban proliferation. In Liaoning Province, except for Shenyang and Dalian, the overall CCD of each city was not high, possibly because its level of economic and social development still has much room for improvement. Another reason is that rapid economic and social development has been achieved to a certain extent at the expense of the internal ecological environment; in the process of development, better coordinated development could not be achieved. Recently, the city of Shandong Province has experienced a rapid increase in the level of coupled coordination, mainly because these areas have entered the fast lane of social development.
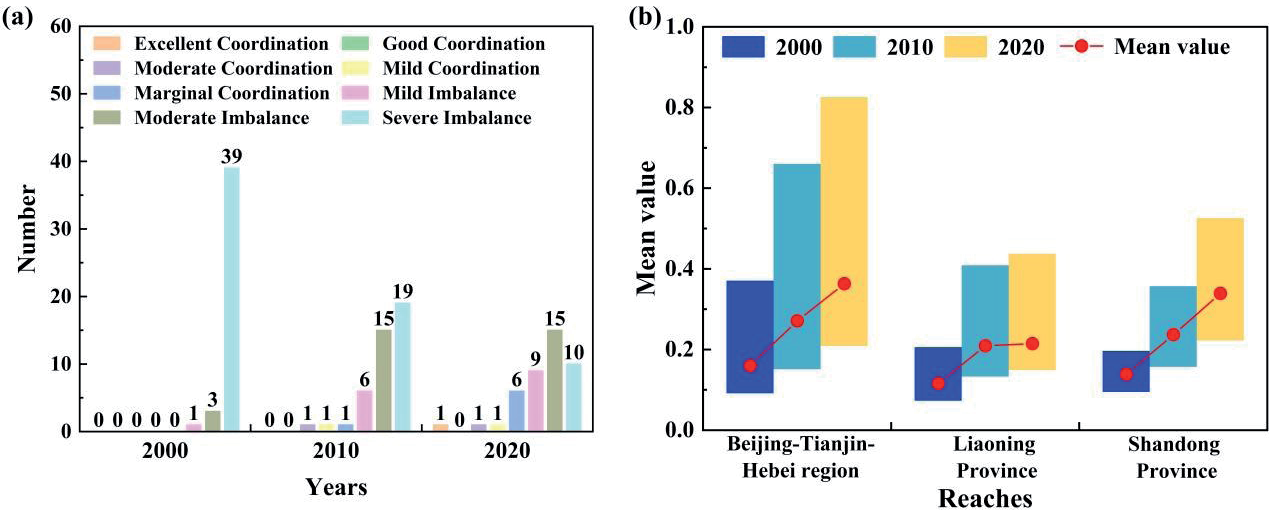
For the development of coupled and coordinated cities at all levels (Fig. 4a), 39 cities, or 90% of the BRR, were severely dysfunctional in 2000, suggesting that the level of CCD in the BRR was generally low in 2000. Furthermore, the majority of the cities were severely decoupled from ecological, demographic and economic development. With China’s increasing emphasis on sustainable development, the number of severely dysfunctional cities in 2010 and 2020 has shown a decreasing trend, accounting for only 10 cities in 2020. Nevertheless, the number of cities that were barely coordinated or above increased but was still relatively small, suggesting that there is still a great deal of room for CCD development in the BRR. The average CCD in each region of the BRR showed an increasing trend from 2000 to 2020 (Fig. 5b), among which Liaoning Province grew from 2010 to 2020, but the increase was only 2.48%. This indicates that Liaoning Province, an old industrial base of the Northeast region, encounters greater difficulties in committing itself to the construction of sustainable development. Among the regions, BTH had the largest difference in CCD, while Liaoning Province and Shandong Province had smaller differences, indicating that the BTH region should focus on both linkages among cities and the development of cities individually, as should Liaoning Province and Shandong Province. Hence, attention should be given to the use of CCD to drive smaller cities while carrying out high-quality development.
To further explore the spatial evolution process of the CCD in the BRR, ArcGIS 10.8 was used to generate standard deviation ellipses and centroid migration trajectories for the coupled coordination of the BTH region, Liaoning Province, Shandong Province, and the overall BRR from 2000 to 2020 (Fig. 5).
From 2000 to 2020, the centroid of the standard deviation ellipse for the CCD in the BTH region underwent initial movement to the northeast (from 2000 to 2000) and subsequent movement to the southwest (from 2000 to 2015). The total distance of this movement was 4.26 km, all of which occurred in Langfang city, Hebei Province. The area of the standard deviation ellipse increased by 806.23 km2, indicating that the coupled coordination in the BTH region tended to expand to the south. In the same period, the centroid of the standard deviation ellipse for the CCD in Liaoning Province showed an overall southwestward movement. The distances of these movements were 1.18 km and 7.39 km, respectively. During the study period, the area of the standard deviation ellipse decreased by 910.85 km2, confirming that the coupled coordination in Liaoning Province tended to gather in the southwest. From 2000 to 2020, the centroid of the standard deviation ellipse for the coupled coordination of the coupled coordination system in Shandong Province generally moved to the northeast. The total distance of this movement was 11.62 km. The standard deviation ellipse decreased obviously by 1240.55 km2. This finding implies that the coupled coordination in Shandong Province tends to converge to the northeast. For the overall BRR, the centroid of the standard deviation ellipse for the CCD (from 2000 to 2010) initially moved towards the northeast by 10.73 km and then (from 2010 to 2012) shifted southwestwardly by 37.07 km. As can be observed from the changes in the standard deviation ellipse, the rotation angle remained relatively stable from 2000 to 2020. During the period from 2000 to 2010, the standard deviation of the minor axis of the ellipse increased by 5473.94 km, while the standard deviation of the major axis decreased by 24,272.59 km. The area of the standard deviation ellipse decreased by 286,500.77 km2. An increase in the aggregation of coupled coordination in the main direction can be obtained.
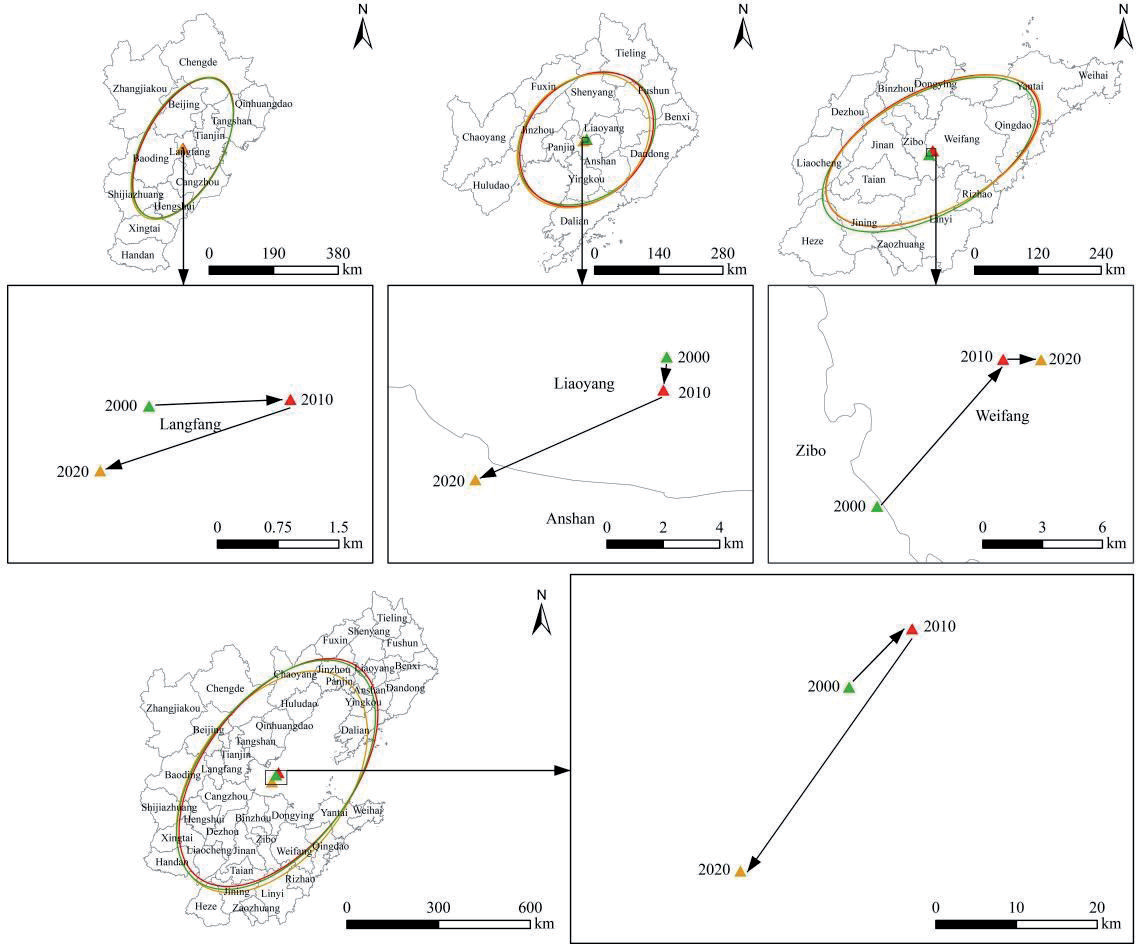
From 2010 to 2020, the standard deviation of the major axis increased by 23,328.81 km, while the standard deviation of the minor axis decreased by 7,668.05 km. The area of the standard deviation ellipse increased by 7,796.42 km2. It can be concluded that there was contraction in the east‒west direction and expansion in the north‒south direction of the CCD, with a tendency to disperse towards the southwest. In general, the CCD has switched towards the south. This finding validates the significant improvement in the coupled coordination level, primarily in the southern part of the BRR, with Shandong Province playing a prominent role, thus signifying that Shandong Province has strengthened its driving force in the coupled coordination of ecological-economic production, population, and economy.
Spatial Correlation Analysis of the CCD
There are evident regional differences in the CCD among cities in the BRR. Hence, the spatial correlation of coupled coordination was investigated by calculating the global Moran’s index, as shown in Table 6. The results show that Moran’s I exhibited a decreasing trend from 2000 to 2010 and then an increasing trend from 2010 to 2020. These values are greater than 0, while the corresponding p values are less than 0.05. This significance test suggested the existence of significant spatial correlations among the cities.
Table 6.
Global Moran's Index.
| Year | I value | P value | Z value |
|---|---|---|---|
| 2000 | 0.5321 | 0.005 | 4.7788 |
| 2010 | 0.4955 | 0.005 | 4.4391 |
| 2020 | 0.5285 | 0.001 | 4.5979 |
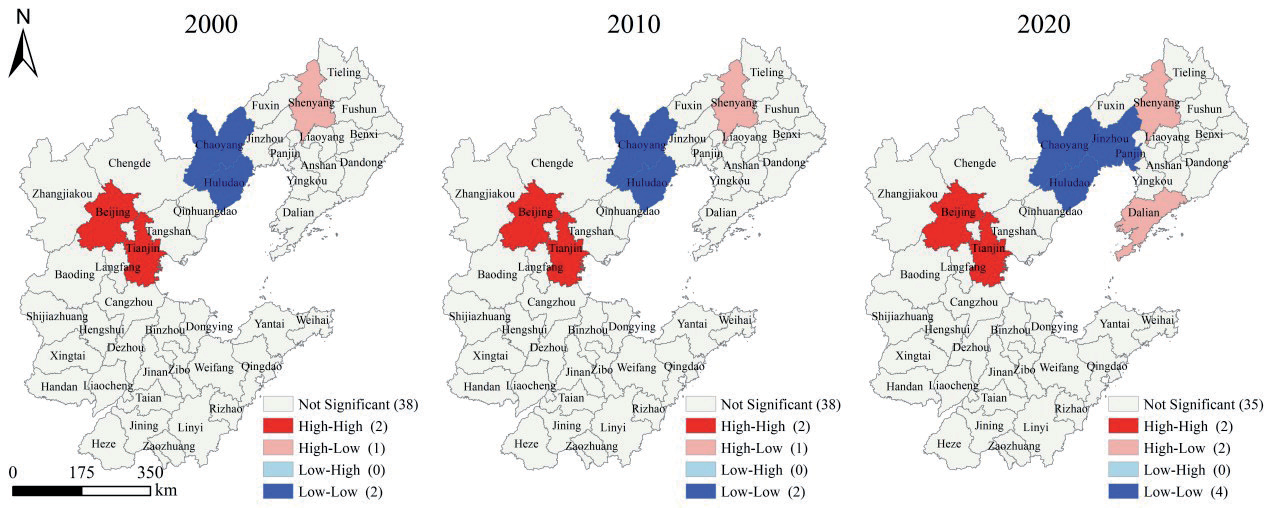
The Moran’s I values for 2000, 2010, and 2020 indicate spatial correlation in the CCD among cities in the BRR. However, Moran’s I fluctuates, and the spatial correlation tends to weaken over time. Notably, the global Moran’s index indicates only the presence of correlation, without providing specific information about spatial clustering characteristics. To further analyze the cities with strong spatial clustering, it is necessary to calculate the local Moran’s index.
As shown in Fig. 6, the Lisa cluster map was obtained by analyzing the local Moran’s index.
The analysis categorizes the CCD in various cities in the BRR into four types: high-high, high-low, low-high and low-low. These four types exhibit spatial distributions in the shape of a zero. Overall, the high-high cluster area shows relatively stable patterns, mainly characterized by Beijing and Tianjin forming a consistent high-high cluster pattern. This phenomenon stems from regions shifting their focus from the one-sided pursuit of economic growth and placing greater emphasis on the surge in population. Additionally, Huludao and Chaoyang formed a stable low-low cluster, with slight changes observed during the study period. Specifically, Jinzhou city shifted from a negligible cluster to a low-low cluster between 2010 and 2020. In other words, as an underdeveloped area within the province, the western region of Liaoning Province holds both prospects for future development and current challenges to overall progress. Accelerated development and modernization efforts in the western region of Liaoning are major strategic issues that directly affect the overall development of Liaoning. Therefore, it is vital to coordinate regional development, protect the environment and foster institutional innovation to eliminate the current situation. Shenyang and Dalian, as representatives of the high and low clusters, with the latter joining the cluster in 2020, demonstrate the key role played by the dual core of Shenyang and Dalian in driving Liaoning’s economic growth. However, there is still much room for improvement in stimulating the development of neighboring regions. It is therefore necessary to further strengthen the links between the two core cities of Shenyang and Dalian. A shift from a polarized spatial structure to a hub-and-spoke spatial structure promotes the development of peripheral city clusters. Most cities do not exhibit agglomeration effects, possibly because of complex social factors that influence GEP. Considering only the population and economy as factors may be one-sided. Another possible reason is that certain provinces experience a decoupling effect between GEP and economy/ population, resulting in a low level of the CCD and minimal impact on surrounding cities. Therefore, there is no cohesion effect.
Conclusion
To consider the economic development and vigorous promotion of ecological civilization in the BRR, various cities in the region were chosen as the research area. During the experimental period, a GEP accounting index system that combines statistical data, meteorological data and land use data was established to calculate the GEP of each city in the BRR. A three-dimensional coupling and coordination mechanism among the economy, population, and ecology was constructed. The entropy weight method, CCD model, standard deviation ellipse method and center of gravity offset method were then used to derive the degree of coupling and coordination between the GEP and economy, and to analyze the population of the BRR. These findings provide novel insights into integrated planning and sustainable development among the cities in the BRR. The key conclusions are as follows:
(1) From 2000 to 2020, the GEP in the assessment area exhibited an increasing trend, which agrees with the findings of Xie et al. [39]. The GEP in the region increased from 2,762.58 billion yuan to 5,531.03 billion yuan, with a growth rate of 100.21% (adjusted for price factors). Between 2000 and 2010, the growth rate increased significantly. The value of material products increased from 535.21 billion yuan to 2,056.66 billion yuan, representing an increase of 15,214.45 billion yuan or a real growth rate of 284.27%. In contrast, the value of regulating services increased from 2,091.67 billion yuan to 2,470.62 billion yuan, an increase of 378.94 billion yuan in real terms, with a real growth rate of only 18.11%. The cultural services value exhibited the largest increase, increasing from 135.70 billion yuan to 1,003.76 billion yuan, with an increase of 8,680.63 billion yuan and a real growth rate of 639.71%. There were significant differences in the GEP among the cities in the BRR. Beijing and Tianjin attained the highest GEP, both exceeding 250 billion yuan in 2020; these results agree with those of Ma et al. [40]. Over time, the GEP accounted for approximately 10% of the BRR, which is significantly higher than that of other cities. Conversely, certain cities (e.g., Langfang, Zaozhuang, and Liaoyang) accounted for a lower proportion of the GEP, each accounting for less than 1% of the overall region. This can be explained by their lower economic development levels.
(2) In summary, the CCD in the BRR increased. The overall coupled coordination level of the region increased from 0.15 in 2000 to 0.25 in 2010, transitioning from a state of severe imbalance to moderate imbalance. From 2010 to 2020, the coupling coordination level further increased from 0.25 to 0.31, reaching the stage of moderate imbalance. Spatially, Beijing and Tianjin exhibited relatively high levels of overall coupling coordination during the study period. In recent years, the level of coupling coordination among cities in Shandong Province has increased rapidly, and the results of this study agree with those of Ma et al. In contrast, cities in Hebei Province have experienced gradual, albeit relatively slow, development in coupling coordination since 2000. Except for Shenyang and Dalian, the level of coupling coordination was generally low for cities in Liaoning Province. Standard deviation ellipse analysis revealed a southward shift in the center of the CCD in the BRR. This suggests that coupling coordination in the southern part of the region has improved significantly through Shandong Province.
(3) The distributions of the CCD among the cities in the BRR exhibited distinct regional variations. By calculating the global Moran’s I, the spatial correlation of coupling coordination in 2000, 2010, and 2020 can be explored. The Moran index initially showed a decreasing trend and then an increasing trend, with all values exceeding 0 and p values less than 0.05. The significance test revealed that there was a significant spatial correlation between the cities. The classification of the coordination aggregation types for the CCD in the BRR included four categories, namely, high-high aggregation, high-low aggregation, low-high aggregation, and low-low aggregation, forming a spatial pattern resembling a zero-shaped distribution. The high-high aggregation area, which comprises Beijing and Tianjin, remained relatively stable. Huludao and Chaoyang formed a stable low-low aggregation pattern, with slight variations during this period. Remarkably, Jinzhou city transitioned from nonsignificant to low-low aggregation between 2010 and 2020. Cities such as Shenyang and Dalian exhibited high-low aggregation. Most cities did not exhibit significant aggregation. Possible reasons for this may be the complexity of the social factors affecting the GEP. A focus solely on the factors of population and economy may provide an incomplete understanding of coordination aggregation types.

