

Introduction
Carbonate rocks, hosting karst aquifers, cover approximately 15% of the Earth’s ice-free land [1], while in China, this estimate is higher, about one-third. Because of the characteristics of openness, vulnerability, and variety in karstification developing processes in the karst underground river system, the karst groundwater system revealed outstanding different recharge processes facing environmental change or the impact of human activities. Karst aquifer receives increasing attention as an important water supplement resource in many countries, which provides one-quarter of the world’s drinking water resource [2]. Southwest China is one of the world’s most spectacular examples of humid tropical to subtropical karst landscapes. Groundwater is also the most important water resource in the karst area of Southwest China, but the water quality is threatened by the growth in population and anthropocentric influence [3]. Therefore, identifying the sources of groundwater recharge in different seasons is important for protecting groundwater resources.
Karst aquifer has high heterogeneity due to uneven permeability developing karstic process [4], which results in difficulties in exploring and protecting surface and subsurface water resources in the karst area. Dansgaard [5] pointed out that the hydrochemical changes show the origin of vulnerability and can be its expression. Groundwater vulnerability cannot be measured or directly obtained in the field, so the existing assessment methods are based on some major contributing factors that can be measured remotely.
Hydrogen and oxygen isotopes are widely used to track hydrological processes, such as groundwater recharge, groundwater-surface water interactions, and surface or soil water evaporation effects [6-8]. In groundwater studies, hydrogen and oxygen isotopes are conservative environmental tracers and are influenced by many factors, such as the evaporation and recycling of surface moisture, temperature, and precipitation amount [9-11]. Considering the karst groundwater system exhibits outstanding geochemical susceptibility characteristics when it is impacted by environmental change or human activities, the variations of stable hydrogen and oxygen isotopes and hadrochemical effects. Hence, we record the impact information for the karst groundwater system to reveal the recharge processes [12-14]. The stable inorganic carbon isotope (δ13CDIC), a typical time tracer, has been used to define the hydrodynamic behavior of a karst system, such as flow types and recharge types [15, 16]. The purpose of this research was to study the hadrochemical characteristics and stable hydrogen, oxygen, and inorganic carbon isotopes in a typical karst groundwater river among different precipitation periods, and we tried to depict the different geochemical processes in different seasons of karst groundwater by variation values of hydrogen, oxygen, and inorganic carbon isotopes.
Study Area
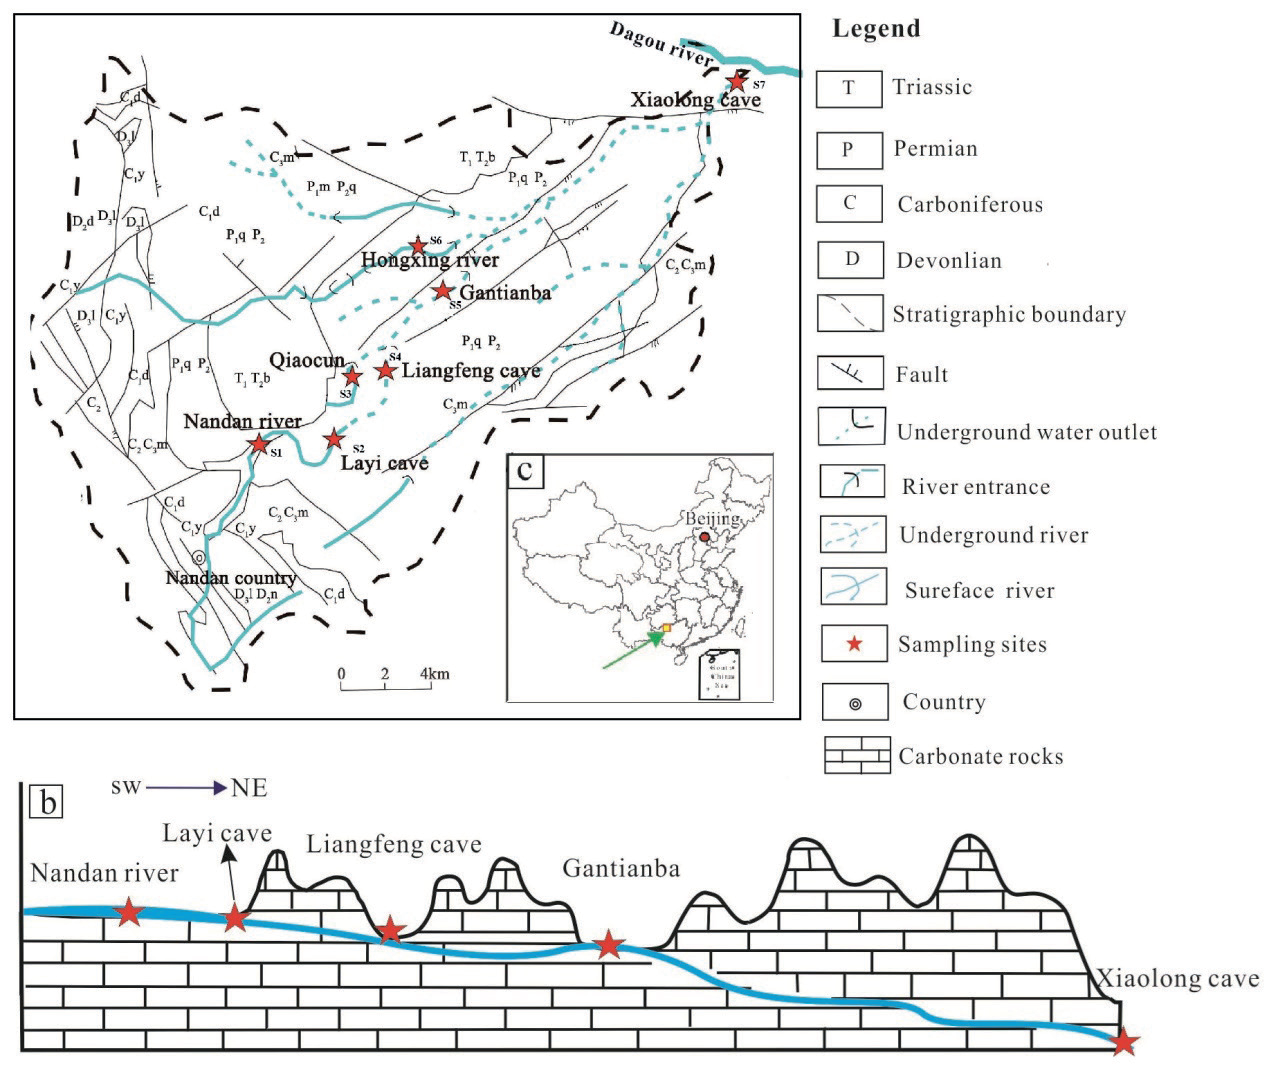
Nandan County is situated in the northwest of Guangxi province, southwest China. Lihu underground river is the largest groundwater river system in Nandan County, exhibits a dendritic distribution, and spans a total length of 25.6 km (Fig. 1). The water system of Lihu underground river spreads in a dendritic shape, in which Layi cave is the source of Lihu underground river from upstream Nandan river to underground river, from Layi cave to Gantianba is the middle and upper reaches of the river section which is about 10 km long and the depth of groundwater level is lower than 30 m. The open and dark streams alternate in this river section, and the hydraulic gradient is 0.64%. From Gantianba to Xiaolong cave are the middle and lower reaches of the river section, which is about 15.6 km long, and the depth of the underground water table increases sharply to between 20 m and 200 m, with a hydraulic gradient of about 1.22%. The underground river flows out of the Xiaolong Cave and enters the Dagou River, which is a tertiary tributary of the Pearl River. The average annual discharge of the Lihu underground river is 4593.75 L/s during the high-water period and 3339.66 L/s during the low-water period. Urban development, agricultural activities, and industrial operations directly impact the water quality of the underground river. The drainage basin of the Lihu underground river system represents a typical karst catchment, covering an area of 517.4 km2. Approximately 85% of this area is supported by Carboniferous, Permian, and Triassic carbonates, primarily limestone and dolomite. The elevation within the study area ranges from 650 m to 1200 m, decreasing gradually from the northwest to the southeast. The geomorphological characteristics of the Lihu Underground River catchment transition from peak forests in the upper reaches to peak clusters interspersed with plains and finally to peak clusters with depressions in the downstream areas. The local climate is strongly influenced by the Asian monsoon, resulting in a multi-annual precipitation average of 965.2 mm, with approximately 65.7% occurring during the rainy season from May to August.
Materials and Methods
Seven sampling sites were selected to monitor the hydrochemical characteristics and stable isotopes of the Lihu groundwater system. Site 7 (S7) is the outlet of the Lihu groundwater river, and sites 1 to 6 (S1-S6) are distributed along the course of the Lihu underground river. The water table is about 30 m, and the hydraulic slope is 0.64% from site 1 to site 6. From site 6 to site 7, the water table ranges from 20 m to 200 m with an interval distance of 15.6 km, and the hydraulic slope is about 1.22%. S1 is the surface river of the Nandan River (NR, S1), which flows into the Lihu underground river. S2 is located at Layi cave (LYC, S2), which is the entrance of the Lihu underground river. S3 is a big spring in Qiaocun (QCS, S3), which is the water source of Nandan city, and the spring flows to the Lihu underground river. S4 is located at Liangfeng cave (LFC, S4), which is the underground river’s midstream. The Lihu underground river flows out of the Liangfeng cave and enters the underground after 200 m. The underground river flows out of Gantianba (GTB, S5) after 3 km, then enters the underground after 300 m. S6 is located on the Hongxing River (HXR, S6), which is a tributary of Lihu underground water that flows into the underground river after Gantianba. S7 is the outlet of this underground river, Xiaolong Cave (XLC, S7). Water samples were collected in May 2014 (Spring), October 2014 (Autumn) and January, 2015 (Winter), and July 2015 (Summer).
Electrical conductivity (EC), pH, and HCO3− and Ca2+ concentrations were detected in the field. A portable water quality analyzer (Hach, USA) determined pH and EC values, with 0.01 and 1 μS/cm precisions, respectively. HCO3− and Ca2+ concentrations were evaluated using a calcium assay kit (Aquamerck, Germany) with precisions of 6 mg/L and 2 mg/L, respectively. The water samples were preserved at 4ºC in clean polyvinyl fluoride bottles, sealed with wax, and analyzed for hydrochemical properties within 10 days of collection. Na+, K+, and Mg2+ concentrations were measured by inductively coupled plasma optical emission spectrometry (ICP–OES Optima 2100 DV) with a lower detection limit of 0.01 mg/L. SO42− and Cl− concentrations were determined by ion chromatography (IC), also with a lower detection limit of 0.01 mg/L. The precision of both IC and ICP–OES analyses was within ±5% for major elements. Cation ion analysis was performed at the Chongqing Key Laboratory of Karst Environment & School of Geographical Sciences, Southwest University, while anion ion analysis was conducted at the Key Laboratory of Karst Dynamics, Ministry of Natural Resources. Stable isotopes were analyzed at the Environmental Stable Isotope Lab of the Chinese Academy of Agricultural Sciences (AESIL, CAAS). Isotope values are reported in the standard δ notation relative to VSMOW for oxygen and hydrogen isotopes and relative to VPDB for carbon isotopes. The experimental accuracy for δ13C during this study was ±0.15‰, and the precision levels for δ18O and δ2H were ±0.2‰ and ±0.6‰, respectively.
Results
Hydrochemical Characteristics
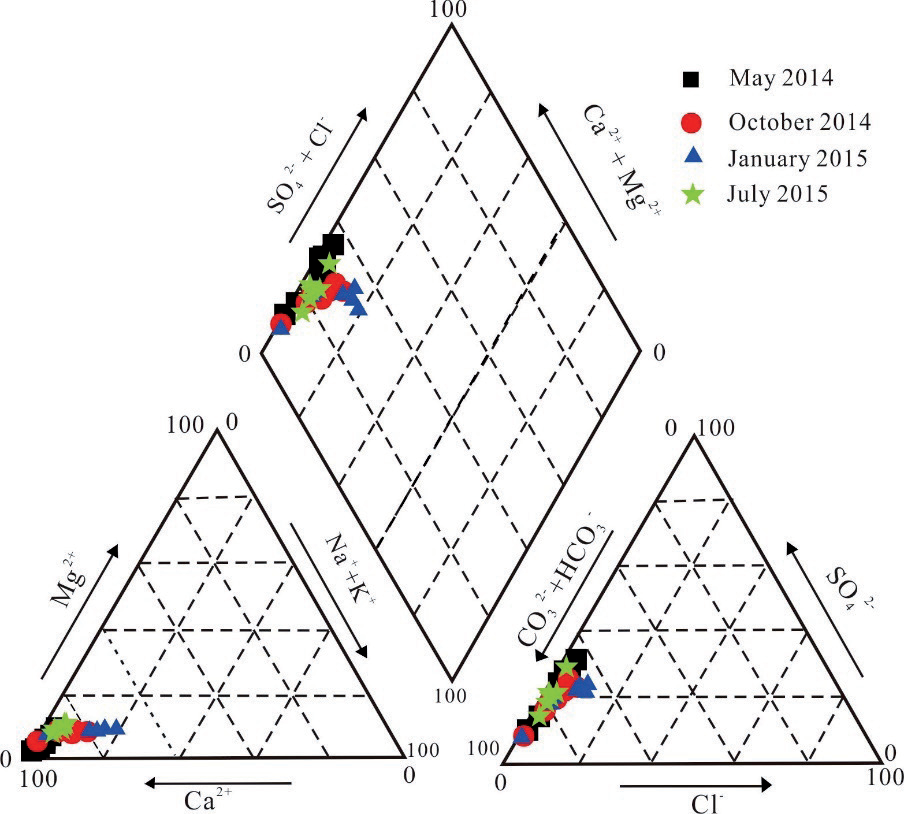
The chemical composition and physical properties of the water samples are shown in Table 1. Mean pH values were similar in May and October 2014 and January 2015 in the Lihu underground river system, but the mean pH value in July 2015 was 8.02, which is higher than the other times. The EC values ranged from 295-364 us/cm in May 2014 and 337-419 us/cm in October 2014, respectively, and 389 to 523 us/cm in January 2015 and 291-321 us/cm in July 2015, respectively. Mean values of EC decreased from January to October, and EC values show a similar variation trend with temperature but an opposite variation trend with precipitation. In July 2015, a higher pH value coincided with a lower EC value, which indicated the high precipitation dilution effect impacted the hydrochemical characteristics in the underground river system. Ca2+ and HCO3- are the dominant cation and anion and revealed the highest concentration, and the concentration of SO42- was just less than that of HCO3-. The concentration of these ions also revealed a similar variation trend with EC values. The concentrations of Ca2+, HCO3- and SO42-, NO3- fluctuated greatly during their transport from upstream to downstream. In spring and summer, the concentration of Ca2+, HCO3-, and SO42- is low due to the dilution effect of precipitation, and the concentration of NO3- is maximum at the upstream S1 and S2, which is mainly affected by fertilizer use in agriculture. In autumn and winter, the concentrations of Ca2+, HCO3- , and SO42- are higher, and the concentration of NO3- reaches the maximum at the middle reaches S4 and S5, which is mainly affected by tourism. K+ and Na+ showed an overall fluctuating downward trend from upstream to downstream, reaching the lowest value at S7. On the other hand, the concentration of Cl-, SO42-, and NO3- plasma gradually increased from S1 to S2 and reached the maximum at S2, mainly due to the fact that S2 receives surface sewage from the upstream. Then, Cl-, SO42-, and NO3- plasma concentrations gradually decreased and reached the lowest value at S7. This was mainly affected by the dilution effect and self-purification of the water body. According to Fig. 2, the hydrochemical type of Lihu groundwater river water is Ca-HCO3. The subtotal concentrations of Ca2+ and Mg2+ accounted for about 80% of the total cations concentration, indicating that carbonate weathering and dissolution are the controlling factors influencing the hydrochemical characteristics in Lihu underground river (Fig. 2).
Table 1.
Hydrochemical characteristics and stable isotopic parameters of water samples from the Lihu underground river system.
Isotopes (δ2H, δ18O and δ13C)
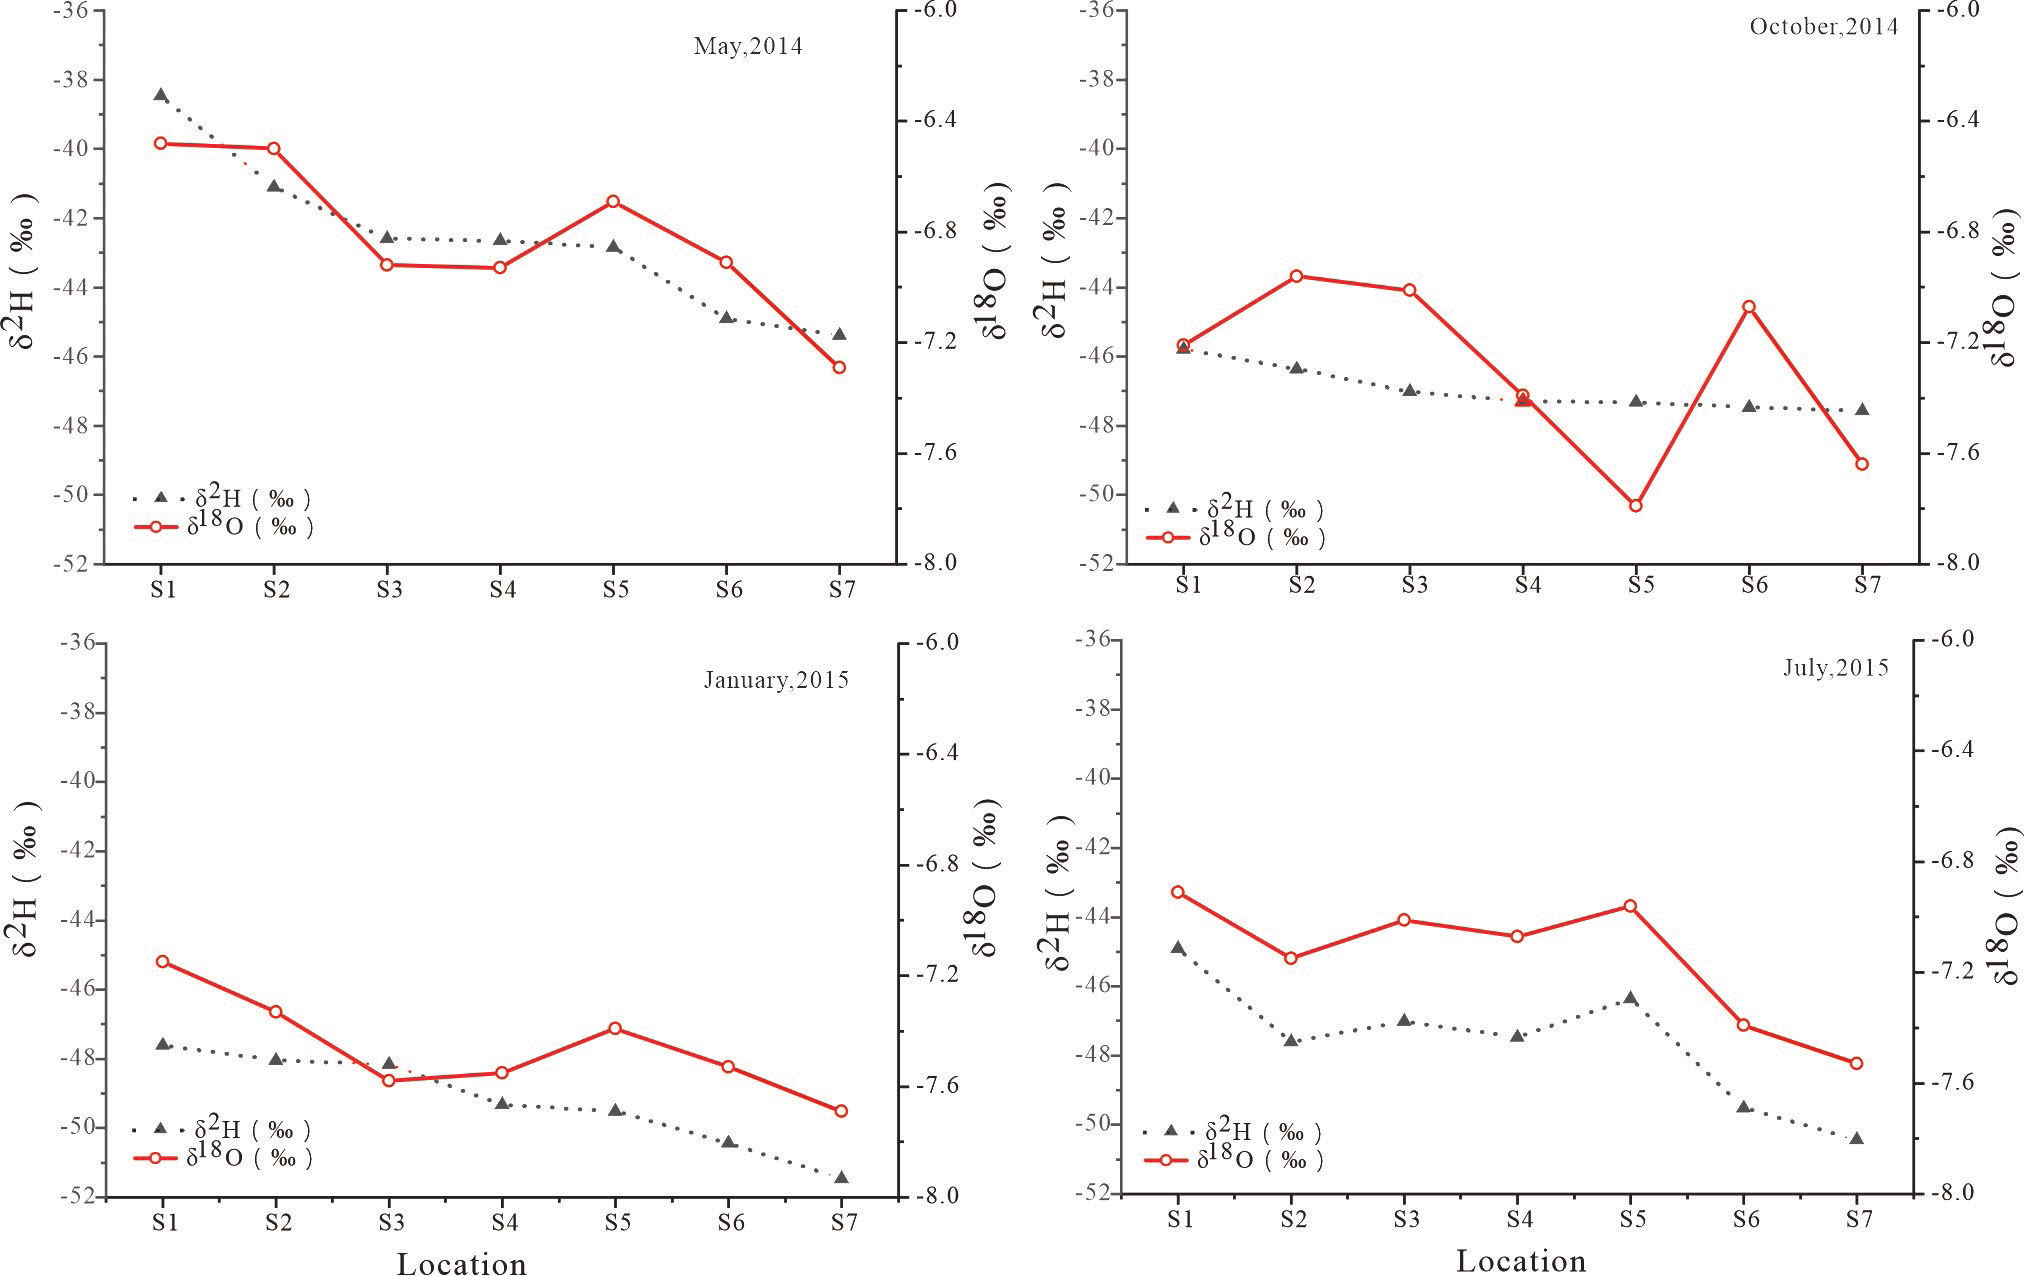
The stable isotopes of oxygen and hydrogen in water have been used to track the water exchange process and resistant time in karst aquifers. The values of δ18O and δ2H ranged from -51.47‰ to -38.46‰ with mean values of -46.59‰ and -7.69‰ to -6.48‰ with a mean value of -7.18‰, respectively. There are also seasonal variations in the isotopic composition of the Lihu underground river system (Fig. 3). In spring, the δ18O values ranged from -45.38‰ to -38.46‰, with an average of -42.56‰ and the δ2H values ranged from -7.29‰ to -6.48‰, with an average of -6.82‰. During the summer season, the isotopic values exhibited a slight shift towards lighter values, with δ18O ranging from -50.43‰ to -44.9‰ and δ2H ranging from -7.53‰ to -6.91‰, the average value is -47.61‰ and -7.15‰, respectively. Similarly, in autumn, the isotopic values remained relatively consistent with those observed in spring and summer, ranging from -47.57‰ to -45.79‰ for δ18O with mean value -46.97‰ and from -7.79‰ to -6.96‰ for δ2H with mean value -7.30‰. However, during the winter season, there was a significant reduction in the isotopic values, with δ18O ranging from -51.47‰ to -47.6‰ with mean value -49.22‰ and δ2H ranging from -7.69‰ to -7.15‰ with mean value -7.46‰. In the flow direction of the Lihu underground river, there is a progressive trend of isotopic depletion in hydrogen and oxygen isotopes.
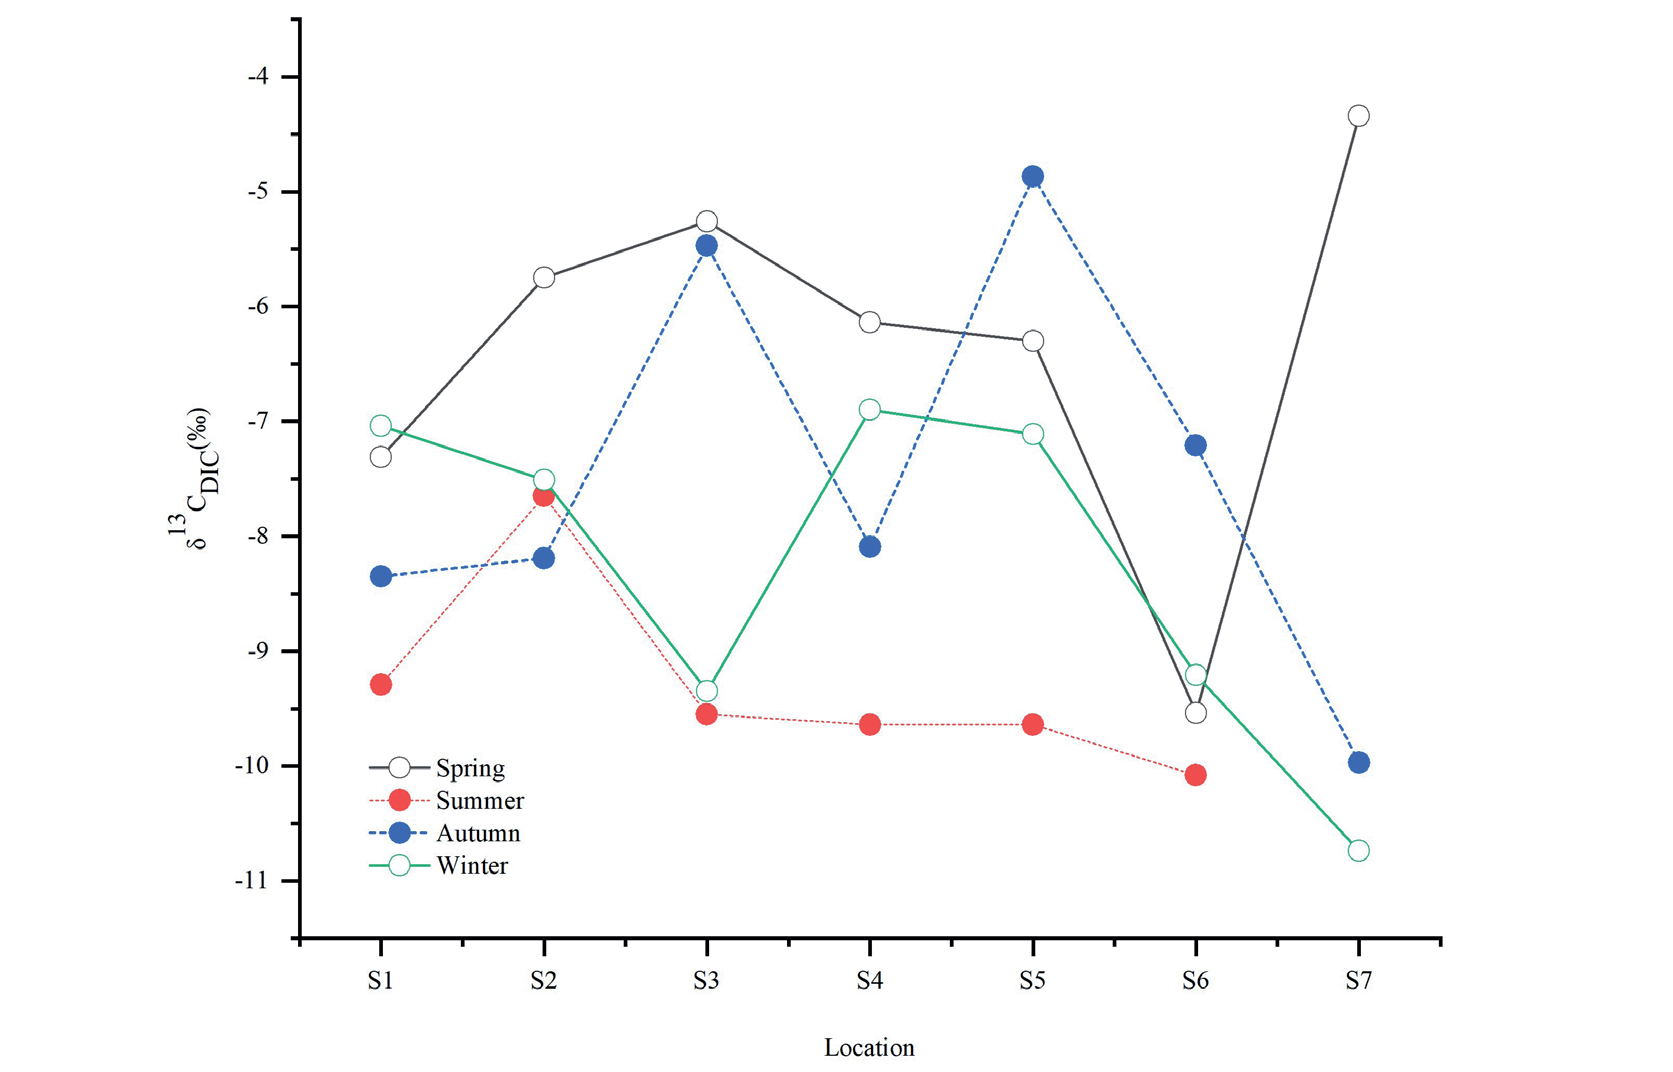
δ13CDIC values of water samples showed decrease trend from May 2014 to January 2015, which were -9.54‰ to -4.34‰ (mean -6.34‰) in May 2014, -9.97‰ to -4.87‰ (mean -7.45‰) in October 2014, and -10.74‰ to -6.90‰ (mean -8.27‰) in January 2015, -10.08‰ to -7.65‰ (mean -9.31‰) in July 2015. In general, δ13CDIC(‰) values of water samples in the rainy season are more enriched than those in the dry season (Fig. 4). The difference observed suggested that there is a more obvious variation in δ13CDIC during the sampling period. The variation of δ13CDIC in the study area is from -10.74‰ to -4.34‰.
Discussion
Cation Exchange in Underground Rivers
It was found that three processes might have influenced the contents of Na+ and Cl- when the concentration of Na+ excessed that of Cl-: (1) cation exchange reactions, (2) weathering of feldspar in sandstone samples, and (3) reaction of silicate minerals derived mainly from sandstone weathering [17, 18]. Considering the study area is featured by a typical karst area, weathering of feldspar or reaction of silicate minerals, which is commonly concerned with sandstone weathering, should not be the principal reason inducing higher Na+ concentration and lower Cl- concentration in the Lihu underground river system. The bivariate graph of (Ca2+ + Mg2+)–(HCO3- + SO42-) against (Na+ + K+)– Cl- (Fig. 5) was used to clarify the ionic exchange [18], and the slope of approximately -1 could indicate active cation exchange in the aquifer. According to the slope of the linear regression of hydrochemical parameters (Fig. 5), the slope values in January 2015 (-4,65) and October 2014 (-1,25) were flatter than those in May 2014 (6.33) and July 2015 (-18.61), which were close to -1. Generally, active cation exchange should more likely occur in the dry season in the Lihu underground river system because the long residence time between water and bedrock during the dry season supplies sufficient time for active cation exchange.
Seasonal Variations in Precipitation and Evaporation
Evidence of Hydrochemical Effects
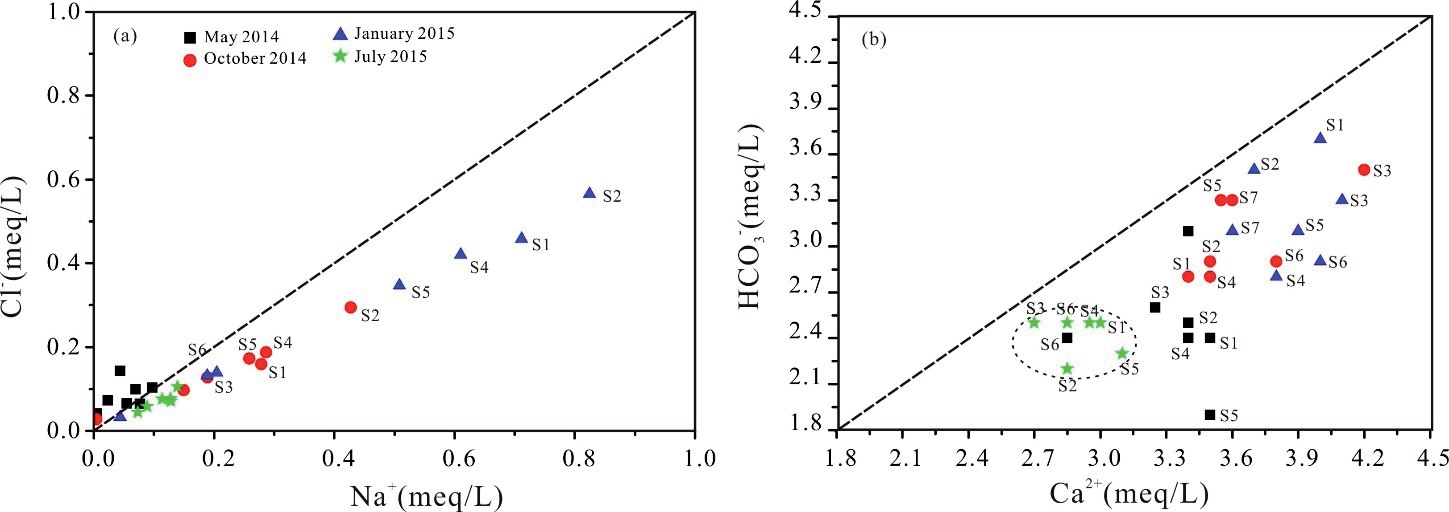
Seasonal changes in chemistry show that variations are not caused by evaporation alone; both Na+ and Cl- concentrations in the underground river system were greatest in January 2015 samples and lowest in May 2014 samples (Fig. 6a)); it can also conclude that the enrichment of Na+ vs. Cl- ions in the water samples of the underground river is mainly influenced by precipitation, apparently in that about 65.7% of the annual precipitation occurred during rainy season (from May to August). Concentrations of Na+ and Cl- are strongly correlated in most underground water samples (besides water samples in May 2014), but they define a trend whose slope is different from that expected by evaporation alone, and the majority of the samples have a ratio greater than or equal to one. In addition, it can also be found that the enrichment of Ca2+ vs. HCO3- ions in the water samples of the underground river (Fig. 6b)).
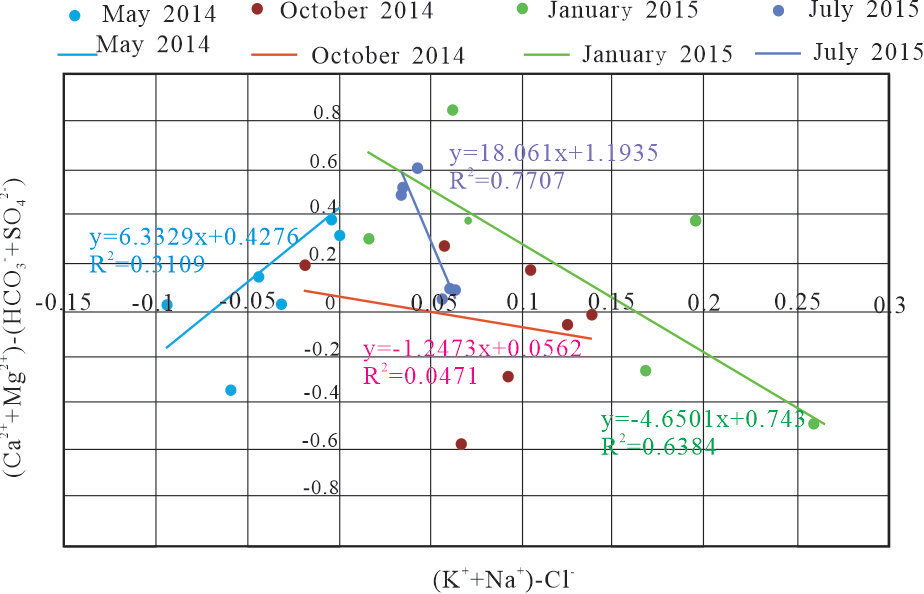
Fig. 6.
Hydrochemical mixing diagrams with concentrations of Cl-, Na+, Ca2+, and HCO3 - (meq/L), including all Lihu underground river system samples. a) Concentration of Na+ vs. Cl-; b) Concentration of Ca2+ vs. HCO3 -.
Isotope of δ2H and δ18O
The global meteoric water line is defined by the equation δ2H = 8δ18O + 10 [19], and the local meteoric water line (LMWL) is defined by the equation δ2H = 8.38δ18O + 16.75. The slope (8.38) and intercept (16.75) of the LMWL are significantly higher, reflecting the humid and rainy climate of the subtropical monsoon region [20]. The δ18O and δ2H values of Lihu underground river water samples almost fitted the LMWL and GMWL, indicating that the Lihu underground river source is precipitation. All the points are below the LWML, which is mainly due to the open and dark streams alternating with each other in the Lihu underground river. The deuterium and oxygen isotopes of underground rivers are affected by evaporation.
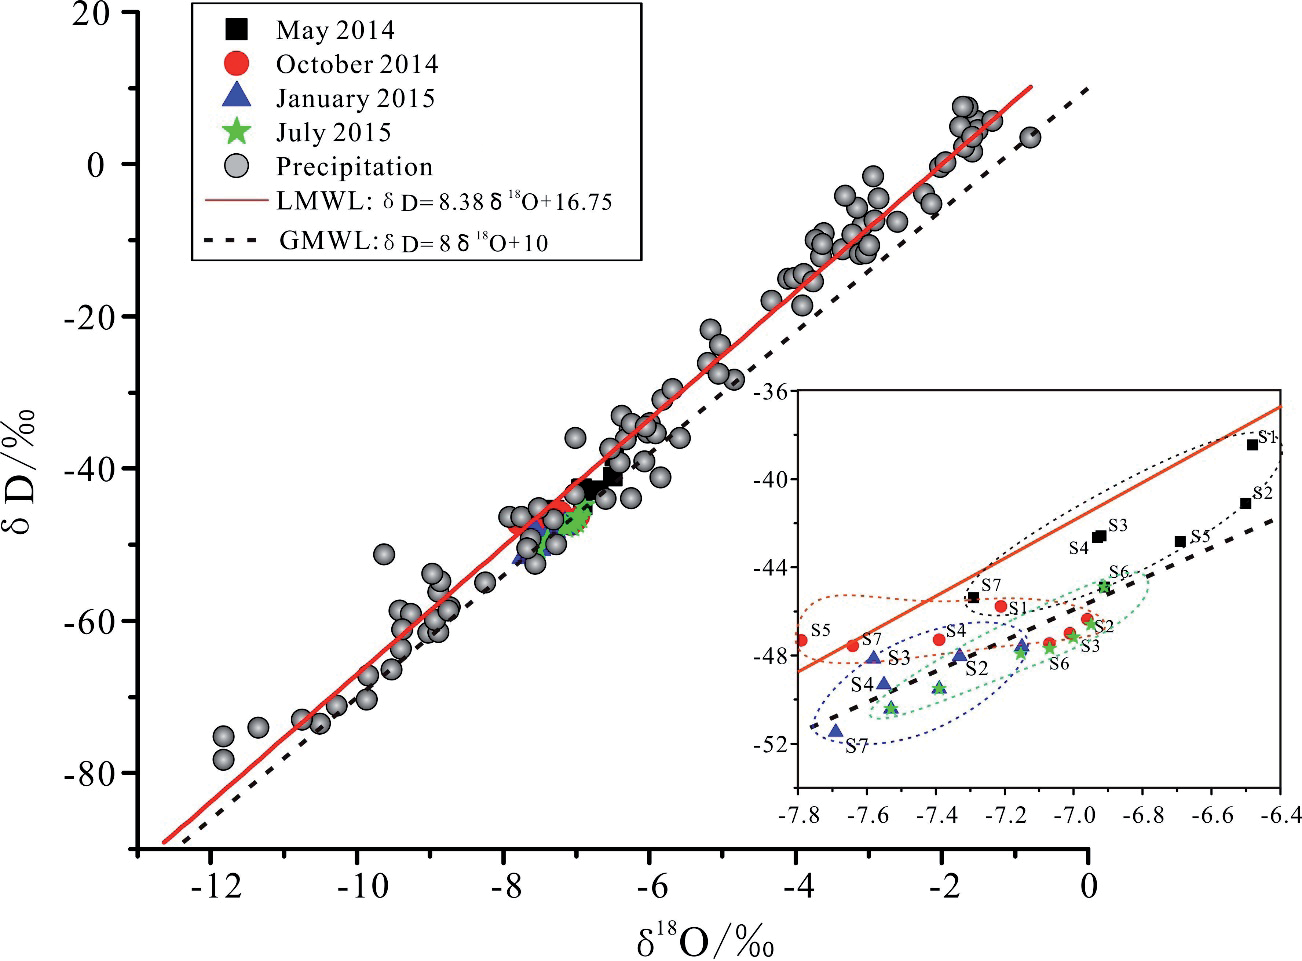
Visually, the water samples can be divided into three significantly different groups (Fig. 7). Group 1 included water samples from May 2014 and July 2015, Group 2 from October 2014, and Group 3 from January 2015. As shown in Fig 7, most of the water samples were plotted near the LMWL, indicating that local modern meteoric water is the dominant Lihu underground river system source. Additionally, water samples collected in May 2014 and July 2015 were closer to LMWL than those collected in October 2014 and January 2015. The slope and intercept of the water regression line (collected in January 2015) indicate the important effect of evaporative enrichment on water collected in January 2015 [21]. The crucial storm events occurred between May and August in Nandan County, which accounts for 65.7% of the annual precipitation. Thus, the water sources in May 2014 and July 2015 are dominated by local precipitation and are highly influenced by evaporation; in January 2015, they are more affected by evaporative enrichment, and in October 2014, they are influenced by evaporation and local precipitation.
Deuterium Excess
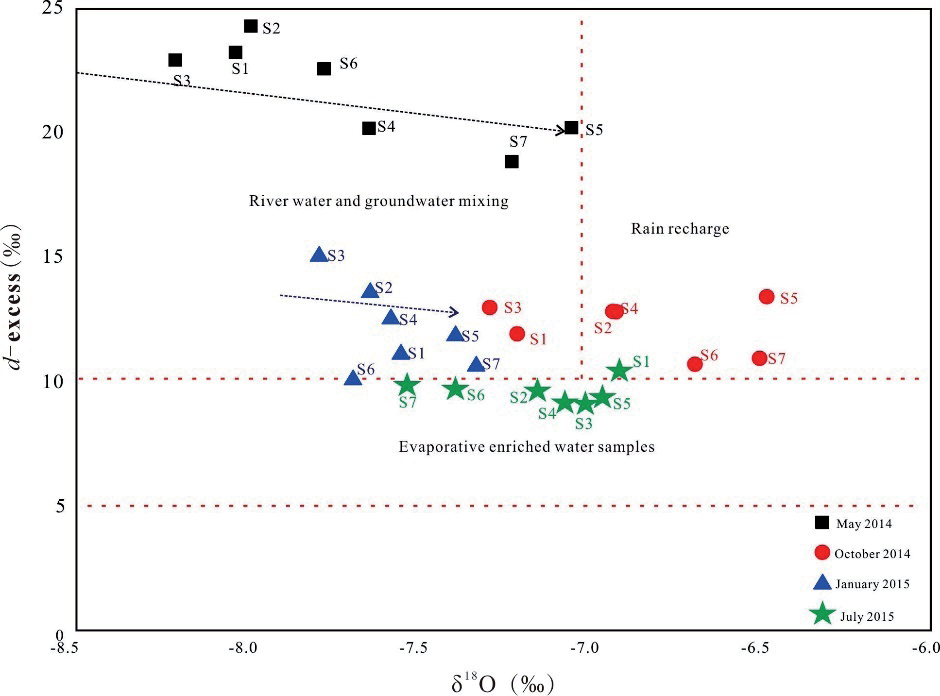
The deuterium excess (d-excess) was defined as d = δ2H-8δ18O [5]. The deuterium excess depends on variations in humidity, ocean surface temperature, and wind speed during primary evaporation, which can, in return, give information on the sources of water vapor [22]. Also, the d-excess is influenced by non-equilibrium evaporation, which causes a decrease in the d-excess and indicates an increase in the vapor phase. The d-excess values of water samples collected in May 2014 ranged from 18.79‰ to 24.22‰ with a mean of 21.70‰ which showed higher d-excess values than that in October 2014 (ranged from 10.67‰ to 12.94‰ with a mean of 112.19‰) and in January 2015 (ranged from 10.05‰ to 15.01‰ with a mean of 12.08‰). The low d-excess values indicate an increase in the vapor phase in October 2014 and in January 2015 (Fig. 8). The lower d-excess values in July 2015 (9.07‰ to 10.38 ‰, mean 9.55‰) indicate the evaporative enriched water samples because a great deal of evaporation occurs in the summer.
The cross plot of d-excess vs. δ18O for the water samples in January 2015, particularly at sites S2,S3,S4,S5 and S7, reveals an inverse correlation. Low d-excess values along the Lihu underground river indicate a significant evaporative enrichment of recharged groundwater, particularly in July 2015. Furthermore, the cross plot of d-excess versus δ18O for the water samples suggests that the discharge events in May 2014 and January 2015 involved a mixture of river water (surface water) and groundwater, while the event in October 2014 was more influenced by rain recharge (Fig. 8).
Generally, evaporation and precipitation are significant processes governing the recharge of the Lihu underground river. In winter (January 2015), despite d-excess values indicating a combined influence of surface water and rainfall, the presence of predominantly old groundwater due to very low rainfall leads to a pronounced evaporative effect on the isotopic composition of groundwater. During the spring (May 2014) and summer (July 2015), groundwater recharge is primarily driven by rainfall, with the most significant effect observed in the summer, where intense evaporation is evident from d-excess values. In autumn (October 2014), as rainfall and surface water decrease and the weather cools, the underground river’s isotopic composition and d-excess values merely reflect rainfall characteristics.
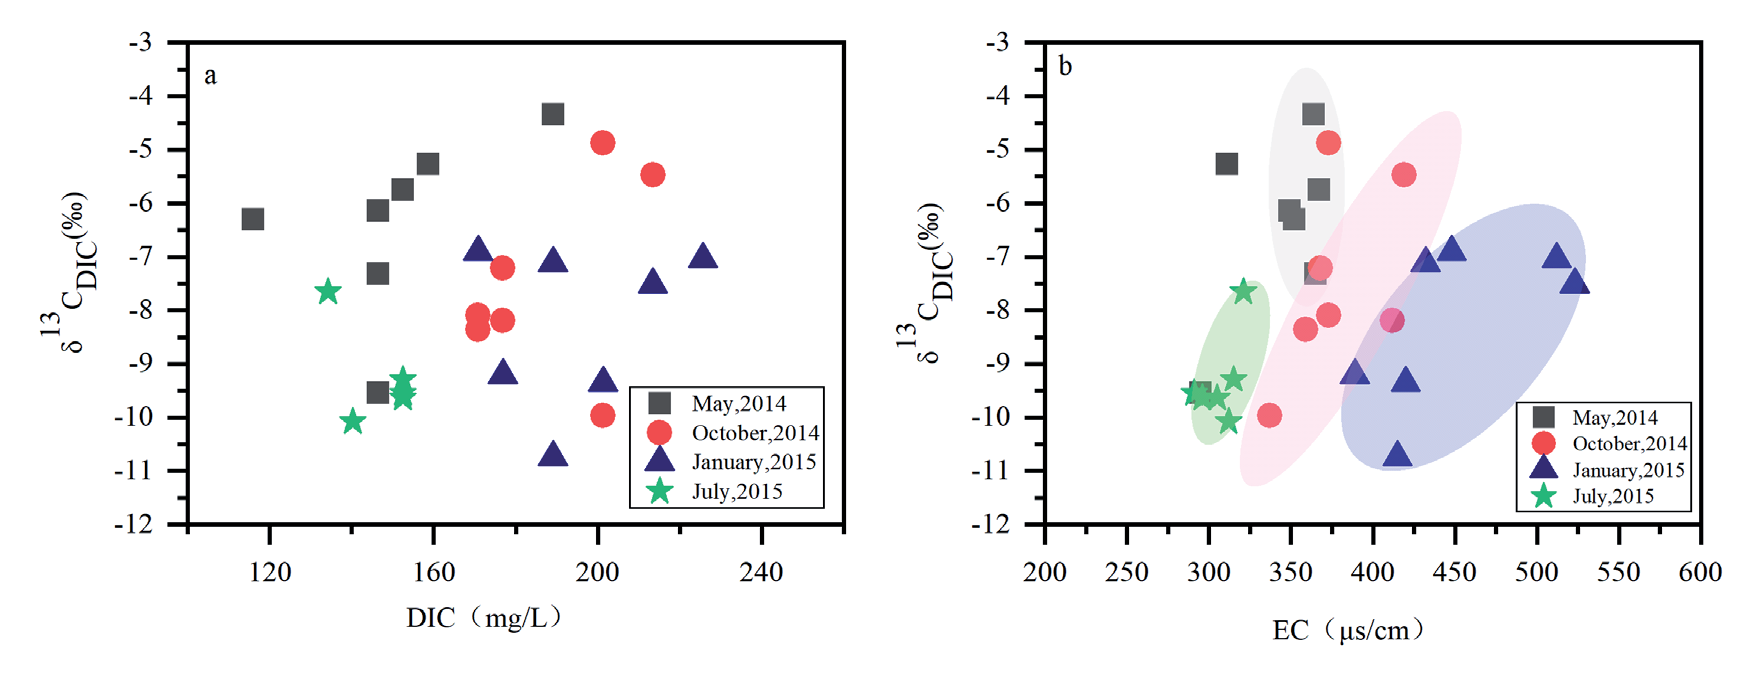
Seasonal Variation of Karstification
According to common pH values for the karstic water (≈7), it can be concluded that HCO3- is the main source of DIC. DIC values in the Lihu underground river system revealed significant amplitude (from 134.2~225.1 mg/L), which could be attributed to the openness or closeness of DIC evolution [23] found that lower δ13CDIC accompanied by a high water table suggested local recharge by direct infiltration through fields. High precipitation-induced discharge increased in the Lihu underground river system, and the dilution effect of high discharge sequenced to the concentration of DIC and δ13CDIC decrease in the rainy season, so the concentrations of DIC and δ13CDIC decreased in July 2015. However, the heavy δ13CDIC values in the study occurred in May 2014 (the beginning of the rainy season), which isn’t consistent with the former research [24], which pointed out that epikarst reservoir plays a key role during karst recharge. Due to the connection between the rain and deep flow in highly karstified carbonate areas, δ13CDIC values were lower in epikarst waters than in base flow [25]. Overall, δ13CDIC values of water samples collected in May 2014 were more positive than those in other seasons, whereas the concentration of DIC in water samples collected in May 2014 was much lower than the others (Fig. 9a)).
The subsurface may be affected by differential mixing between “old’’ water stored in matrix porosity and epikarst waters as well as soil water [3]. Due to the quick transportation process between rainwater, surface flow, and groundwater in the karst aquatic system, the groundwater resident time is relatively shorter in the rainy season than in the dry season. The long resident time in the dry season induced prolonged isotopic exchange between water and carbonate, and in turn, δ13CDIC values profoundly increased. In addition, points of localized groundwater seepage were characterized by low δ13CDIC value and high concentration of DIC. The Lihu groundwater river system is recharged by the points of localized groundwater, especially in the dry season (October 2014 and January 2015), which is another reason for the concentration of DIC and δ13CDIC variation.
Stable carbon isotope values change widely in different carbon origins, so it can help identify the origin and evolution of carbon in groundwater. The δ13C of DIC in the karstic water is affected mainly by soil CO2 that ranges from -26‰ to -10‰ and the dissolution of carbonate bedrock that ranges between 0‰ and 2‰ [26]. Compared to surface water and rainwater, karst groundwater exhibits higher electrical conductivity. Figures of the δ13CDIC vs. EC (Fig 9b)) indicate lower levels during the rainy seasons of May 2014 and July 2015, suggesting a reduced presence of “old water” in groundwater and shorter residence time after surface water infiltration into the aquifer, resulting in dilution effects. However, different trends are observed in δ13CDIC between May 2014 and July 2015, with the former showing positive deviations and the latter showing negative deviations, primarily due to variations in water-rock interaction processes. In May, during early spring, the pH of rainwater is lower, and intensified agricultural activities during the spring plowing season lead to the dissolution of carbonate rocks by other acidic substances, resulting in positive deviations in δ13CDIC. Conversely, in July, a large amount of rainwater directly infiltrates groundwater from the surface, resulting in the shortest residence time and negative deviations in δ13CDIC. In January 2015, groundwater showed lighter δ13CDIC values and higher EC values, indicating longer residence time during winter and primarily originating from carbonate dissolution, reflecting reduced agricultural activities during this season.
Conclusions
The cation exchange, evaporation, and karstification processes of the karst underground river in Southwest China were studied by hydrochemical and stable isotopes (δ18O, δ2H, δ13C). The results are as follows:
(1) Precipitation conditions significantly influence hydrochemical characteristics in underground rivers. Active cation exchange should more likely occur in the dry season because the long residence time between water and bedrock during the dry season supplies sufficient time for active cation exchange.
(2) Oxygen and deuterium isotopes in the Lihu groundwater river range from -51.47‰ to -38.46‰ for δ2H and from -7.69‰ to -6.48‰ for δ18O, respectively. Water samples collected below the LMWL and combined with d-excess suggest that Lihu groundwater river recharge is dominated by precipitation with evaporation processes and supplemented by localized surface water. Due to extremely low precipitation, the groundwater contains mostly old water in winter; the isotopic data of karst underground water showed a more pronounced evaporation process in winter, although d-excess indicates a combined influence of surface water and rainfall. In spring and summer, groundwater recharge from rainfall is most significant, with intense evaporation observed during the summer.
The δ13CDIC values range from -10.74‰ to -4.34‰, and the δ13CDIC values change widely in different seasons. Analysis involving δ13CDIC, DIC, and EC reveals that during the rainy season, karst underground rivers benefit from increased precipitation recharge, shorter residence times, and reduced presence of “old water”, resulting in less extensive karstification processes. Conversely, during the dry season, karst underground rivers are primarily recharged by localized groundwater sources, characterized by longer residence times and more pronounced karstification processes.
δ18O, δ2H, δ13CDIC, and hydrochemical properties are good indicators that can be used to study the characteristics and susceptibility of recharge processes in karst underground rivers, but it is still challenging to quantitatively express the recharge processes of the karst aquifer using the above methods.

