

Introduction
Urban development has certain characteristics and regionalism, and the types and amounts of HM produced and emitted by different regions, such as the central business district, suburban development area, and agricultural area, are not all the same [1]. HMs enter the river in different ways, which will affect the ecological environment of urban rivers to a certain extent [2, 3]. Generally, sediments reflect the history of ecological environment changes in urban rivers, play the role of “source” and “sink” in aquatic environments, and change with the change of environmental conditions [4, 5]. Therefore, as a representative pollutant of the modern industrial environment, HM is an important part of urban river ecological environment management.
Rivers are the lifeblood of high-quality, sustainable urban development. At present, many studies have explored the content, distribution, sources, and potential risks of HM in different urban rivers [6, 7]. The spatial distribution of HM in the suburban environment is closely related to its construction, river environment, and traffic [8]. Since the heavy metal content in urban river sediments will be affected by factors such as urban climate conditions, transportation, industrial production, urban construction, land use, and vegetation conditions, the types and quantities of nutrients and heavy metals in the river sediments of cities with different development levels will vary [9]. HM in urban rivers mainly comes from geological and anthropogenic activities [10, 11]. HM in the water enters the sediment through physicochemical processes (adsorption, sedimentation, and complexation, etc.). When the external conditions change, HM in the sediment will be released into the water body again, which will have a significant impact on the water quality and the growth and development of aquatic organisms [12]. According to the study, land use types and economic structures vary greatly in different regions and urban suburbs of different sizes, and HM distribution characteristics, sources, potential risks, and control standards in water and soil environments are also different [13]. Therefore, it is urgent to study the concentration, distribution, source, and potential risks of suburban HMs to provide beneficial support for the construction of a better and more livable urban human settlement environment.
With the rapid development of Baoji city’s urban scale, industry, and agriculture, the production and discharge of HMs into the river will inevitably have a significant impact on its water quality and sediment [14, 15]. Previous studies have shown that HM is easy to migrate and has a certain accumulation in rivers in Baoji City [16]. However, as a key area of innovation and development in Baoji City in the new era, there are few studies on HM distribution and accumulation, potential risks, and ecological environment protection in the water body and sediment of the confluence of the Wei River and Qian River. In view of this, the confluence of the Weihe River and Qian River intersection (WQ) in the eastern suburbs of Baoji City is investigated. In this study, the spatial distribution of HM in WQ water and sediment was analyzed through investigation. The spatial pattern and potential ecological risk of HM were evaluated, and the main sources of HM were discussed. The research results can provide useful information for urban river resource management and development, comprehensive prevention and control of HM pollution, and reducing harm to the ecological environment and public health.
Experimental Procedures
Study Area
Baoji City is in the west of Guanzhong Plain, a typical valley city. It is a continental monsoon climate with an average annual temperature of 7.8~13.5ºC and an average annual rainfall of 663.9 mm. The research area is the confluence section (WQ) of the Weihe River and its tributary, the Qian River, covering Shaanxi Qianweizhihui National Wetland Park [17, 18]. The geographical location is 109°31′43″~109°34′7″E, 34°29′28″~ 34°30′45″N. The river is a wide and shallow channel with a high degree of artificialization.
Sampling and Measurement
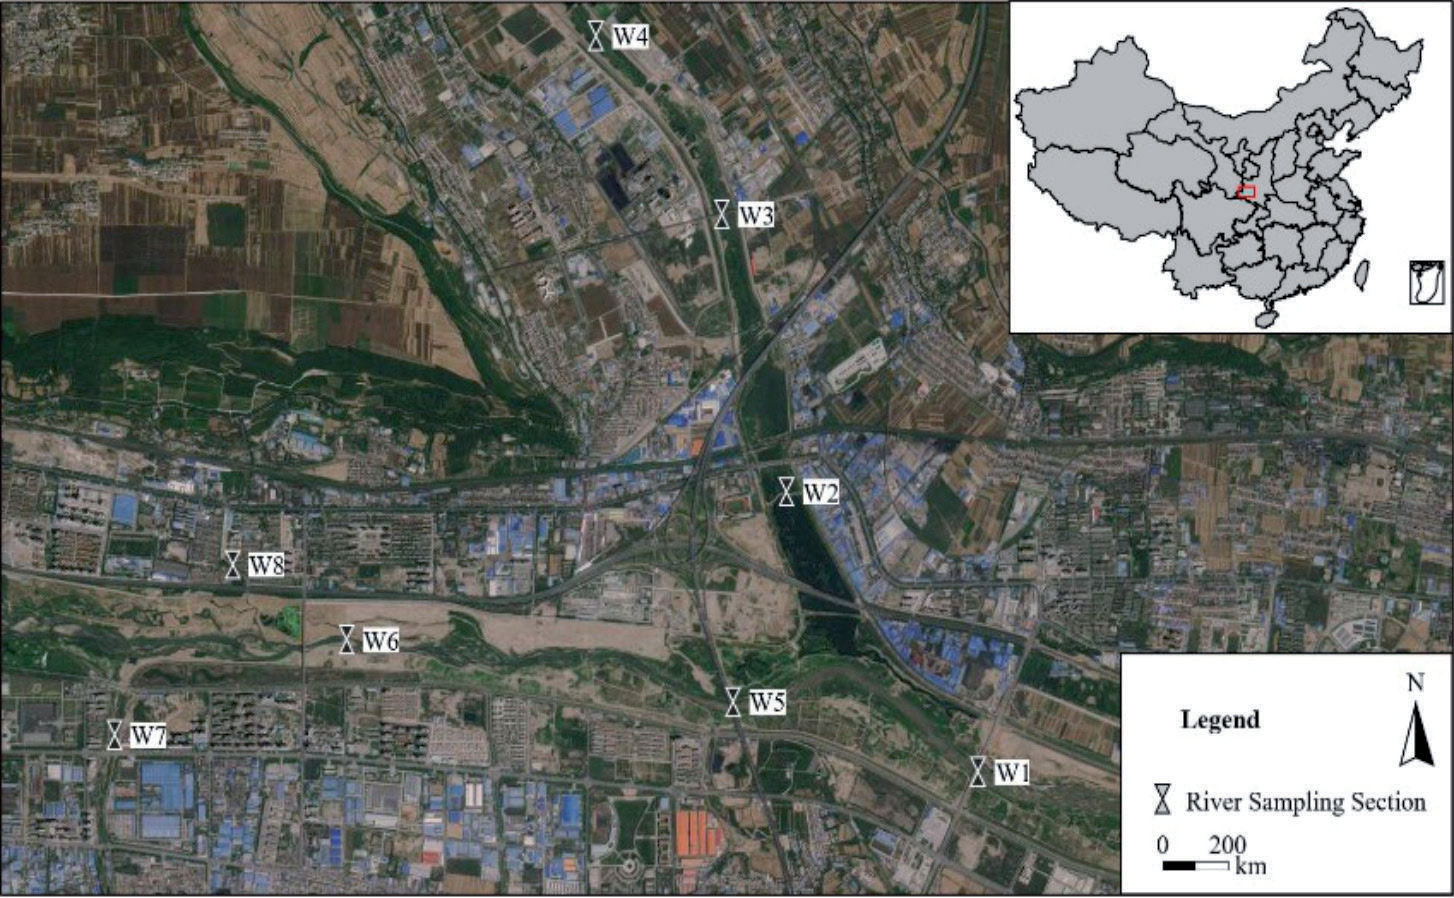
Based on human activities, river forms, and construction, the rivers in the study area were divided into three sections: the Qian River, the Wei River upper reaches, and the Wei River lower reaches. According to the requirements of HJ 91.2 and DB61/T 1322, eight sampling sections were set up in the upstream of the study reach, the inlet of tributaries, the location of important hydraulic buildings, and sewage discharge outlets (Fig. 1). In February 2021, polymethyl methacrylate (PMMA) was used to collect shallow-layer (0-30cm) water samples above 2000 ml. Each section was sampled on the left bank, midstream of the channel, and right bank of the river and mixed into one sample. Samples of sediment (0-10cm) above 1000 g were collected at the same section. All samples are kept sealed as required and brought back to the laboratory for testing.
The sediment samples were brought back to the laboratory and air-dried in a cool place. After removing the residue and waste, the samples were ground through a 100-mesh nylon screen [19]. The samples were digested using HNO3-HCl-HClO4 microwave and inductively coupled plasma mass spectrometry (ICP-MS, Agilent 7500a). The Hg content was measured using atomic fluorescence spectrometry (AFS). All the reagents are high-purity reagents, and the quality control is based on Chinese national standard water quality samples [20]. The recovery rate was 100±10% (mean±standard deviation), which met the required precision. All tools that were in contact with the samples during the sampling process were composed of non-metallic products such as polyethylene and wood to avoid anthropogenic interference or pollution.
Nemerow Synthesis Index (Pn)
The Nemerow comprehensive index method reflects the pollution degree of HM and judges the impact degree of HM with the largest pollution index on the environment [21]. The Pn was calculated according to the following:
Where, Pn is the comprehensive pollution index (mg/kg), Pi,ave is the average single pollution index, and Pi,max is the maximum single pollution index (mg/kg). Pi is a single factor index, Ci is the measured value (mg/kg). The standard value of Si was taken as the standard value, the water quality requirements of the water environment function zoning of the study area were taken as the standard value, and the Class II standard value of GB3838 was adopted. The classification of HM pollution degree is shown in Table 1.
Geoaccumulation Index (Igeo)
The Igeo proposed is a quantitative index used to evaluate the pollution degree of HMs in aquatic environment sediments, mainly quantifying metal pollution caused by human activities, natural geological and geographical processes [22]. Igeo is widely used for the assessment of sediment and soil HM pollution. Igeo is calculated according to the following formula:
Where, Cd is the measured value of the HMs in the examined samples, Cb is the measured value of the HMs in the examined samples. K is the coefficient of petrogenetic effect, has a value of 1.5. Due to the differences in geological conditions in different regions, the geochemical background values in sediment samples are not the same, so the soil HM background value of Shaanxi Province is used in this study. The background values of Cr, Ni, Cu, Zn, As, Cd, Pb, and Hg are 67.80, 29.60, 20.10, 66.10, 10.80, 0.09, 16.90, and 0.063 mg/kg, respectively [23]. Igeo can be classified into 7 levels (Table 2).
Ecological Hazard Index (RI)
The potential ecological risk index method (RI) [24] is a commonly used method to assess the risk of HMs in water and sediments. It comprehensively considers the toxicity of heavy metals, the sensitivity of the environment to heavy metals, and the synergy of various heavy metals, and sets the toxicity response coefficient to evaluate heavy metals. It is calculated using the following formula:
Where, RI is the multifactor comprehensive potential ecological risk index, reflecting the potential hazards of all the participating pollutants. Eri is the single-factor hazard index. Tri is the toxicity response coefficient, which reflects the toxicity level of HM and the sensitivity of organisms to pollutants (which can be replaced by the biological toxicity coefficient). It is determined according to various factors such as the HM concentration of surface sediments, sedimentation, affinity for solids, sensitivity of water to metal pollution, and central toxicity level. In this study, the toxicity response coefficients of Cr, Ni, Cu, Zn, As, Cd, Pb, and Hg are 2,5,5,1,10, 30, 5, and 40, respectively, in reference to the research achievements of Zhuang et al. (2016) [25]. The classification of the potential ecological risk coefficient of HMs and the ecological risk index RI are shown in Table 3.
Statistical Analysis
Analysis of Variances (ANOVA) (p<0.05) of heavy metal concentrations in different areas was performed using a one-way ANOVA test. One-way ANOVA can test whether there is a significant difference between the mean values of dependent variables in samples for multiple groups affected by a single factor. Zeng et al. (2020) [26] used one-way ANOVA to compare river water quality in different land-use areas.
In this manuscript, Pearson correlation analysis and CA are suitable for checking the influence factors and identifying the sources of heavy metals in water and sediments and are widely used in many reports [27, 28]. Origin Pro 2021 version (OriginLab Corp., Northampton, MA, USA) was applied for clustering analysis and cluster analysis, and SPSS 22.0 version (IBM SPSS Statistics, Version 22) and ArcGIS 10.5 were conducted to make the spatial distribution map of HMs.
Results and Discussion
Water Contamination Analyses
HMs Content in Rivers
The statistical analysis of HMs in water is shown in Table 4. Concentrations of HMs were 0.01~56.46 μg/L with an average content of 8.83 μg/L for Cr, 0.60~24.31 μg/L with an average content of 4.78 μg/L for Ni, 0.17~9.99 μg/L with an average content of 3.31 μg/L for Cu, 6.17~42.34 μg/L with an average content of 26.61 μg/L for Zn, 0.14~4.03 μg/L with an average content of 1.95 μg/L for As, ND (not detected) ~0.59 μg/L with an average content of 0.15 μg/L for Cd, 0.25~30.21 μg/L with an average content of 6.11 μg/L for Pb, 0.04~1.21 μg/L with an average content of 0.30 μg/L for Hg. Compared with GB3838, it was found that the highest concentrations of Cr, Ni, Pb, and Hg exceeded the GB3838 Class II standard limit. The concentration of other HM is below the GB3838 Class II standard limit.
The coefficient of variation (CV) reflects the degree of disturbance of water physicochemical characteristics by anthropogenic activities [29]. CV scores showed low variability (lower than 15%), medium variability (15%~36%) and high variability (higher than 36%) [30]. The order of coefficients of variation (CV) of the HMs in descending order was Cr>Ni, Pb>Cd>Hg>Cu>As>Zn. It was obvious that the coefficient of variation of HMs was greater than 36% except for Zn and As. On the whole, the HMs of river water bodies is greatly affected by human activities, especially the centralized discharge of unclean water and traffic.
The comparison of HMs concentrations in water bodies with those in other rivers is shown in Table 5 [31-35]. The concentration of HMs in QW was basically consistent with that in the middle section of Weihe Pass, the Baoji section, and the Yellow River Estuary. The Ni in the upper reaches of the Weihe River was higher than the lower reaches, and the concentration of Cd and Cu in the Yellow River estuary was higher than in the Weihe River tributary. In contrast, the concentrations of HMs were higher in the Liaohe River and Haihe River, followed by the Yangtze River estuary, and relatively lower in the Pearl River estuary.
Table 3.
Classification of potential ecological risk coefficient and ecological risk index (RI) of HMs.
| Eir | RI | Risk |
|---|---|---|
| <40 | <150 | Low |
| 40~80 | 150~300 | Moderate |
| 80~160 | 300~600 | Considerable |
| 160~320 | 600~1200 | High |
| >320 | >1200 | Significantly high |
Table 4.
Descriptive statistics on the content of HMs in river (unit: ug/L).
Table 5.
Comparison of HM concentration with other rivers in literature (unit: μg/L).
Contamination Levels of HMs in the Water
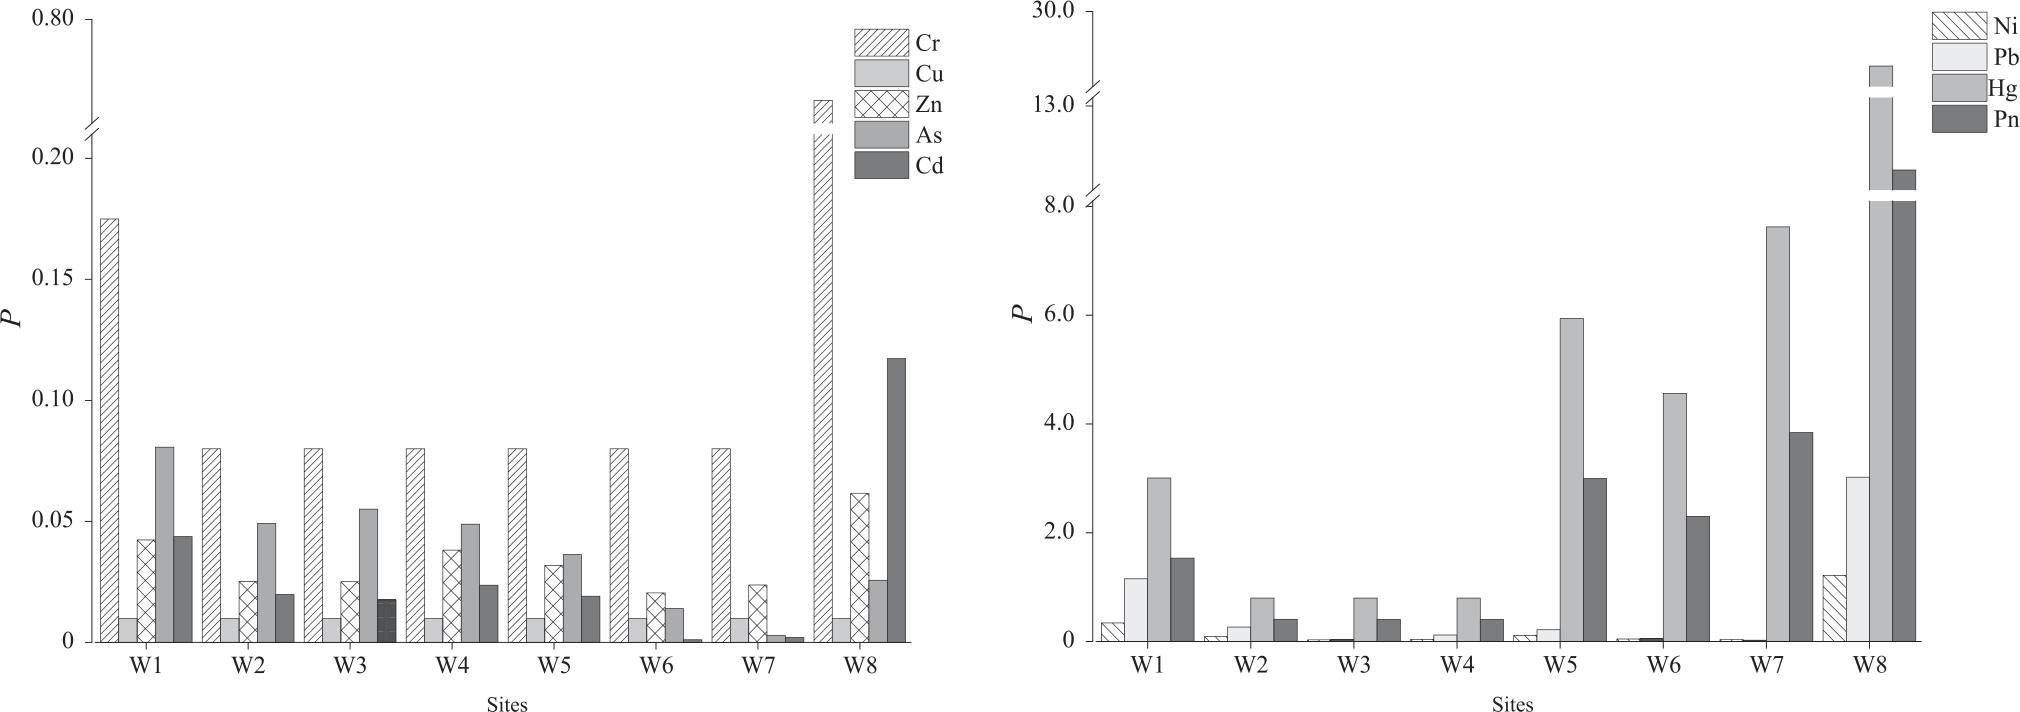
The spatial variation of HM in river water quality is shown in Fig. 2. Along the direction of flow, it could be found that the concentration of HMs in the trunk stream of the Weihe River was higher than that in the Qianhe River, while the concentration in the upstream area was lower than that in the downstream area. According to the Nemerow synthesis index (Pn) evaluation, the pollution degree of the trunk stream of the Weihe River gradually changed from heavy pollution to light pollution, while the tributary (Qianhe River) gradually changed from a clean state to slight pollution. Among them, the HM content of the Qianhe River increased significantly from the upstream to the downstream, and accumulated in the main stream of the Weihe River in the downstream [36]. The Cu content of the Weihe River in the main stream decreased first and then increased, and the minimum Cu content appeared at the Cross-River Bridge (W6) (0.74 μg/L), and the single factor pollution index evaluation result indicated no pollution. The content of the remaining seven elements followed a pattern of initially increasing, then decreasing, and then increasing [37]. In particular, the content of Pb and Hg in Section W8 exceeded the GB3838 Class II standard limit, and the Pmax was as high as 12.24. The pollution degree was heavy and gradually decreased in the downstream due to the dilution of water flow. The investigation found that there are important transportation hubs such as the railway station (Wolong Temple Station) and the Baoji Transit Highway (G2034) near W8, with large traffic flow. In addition, factors such as urban coal-fired heating, industrial enterprises, treated sewage discharge, urban renewal and construction, and agricultural production in irrigation areas in the north may lead to excessive HMs content in water. The Hg pollution index of W7 was 7.63 (heavy pollution). There were more than 30 metal material manufacturing, petroleum, and petrochemical enterprises on both sides of the upstream river, and the impact of urban main road and railway transportation cannot be ignored [38].
HM Potential Ecological Risk in Rivers
We used the potential ecological hazard index method to calculate the potential ecological risk of water HM, and the results are shown in Table 6. The HMs of the Thousand Rivers had only a slight potential ecological risk, and the variation of the hazard index (RI) was not significant (17.30~17.55). Because of the admission of centralized sewage discharge, the exceedance of HMs near W8 was relatively high, and the value of RI was as high as 976.55, which indicates a high potential ecological risk. The potential ecological risk level of the rivers in the study area from upstream to downstream was: high → considerable → moderate → considerable. While calculating the potential hazards of HM, this method has obvious shortcomings such as subjectivity and unclear weights of multiple HM, so a single HM pollution index and risk index often affect the calculation results [29].
Sediment Contamination Analyses
HMs Content in Sediments
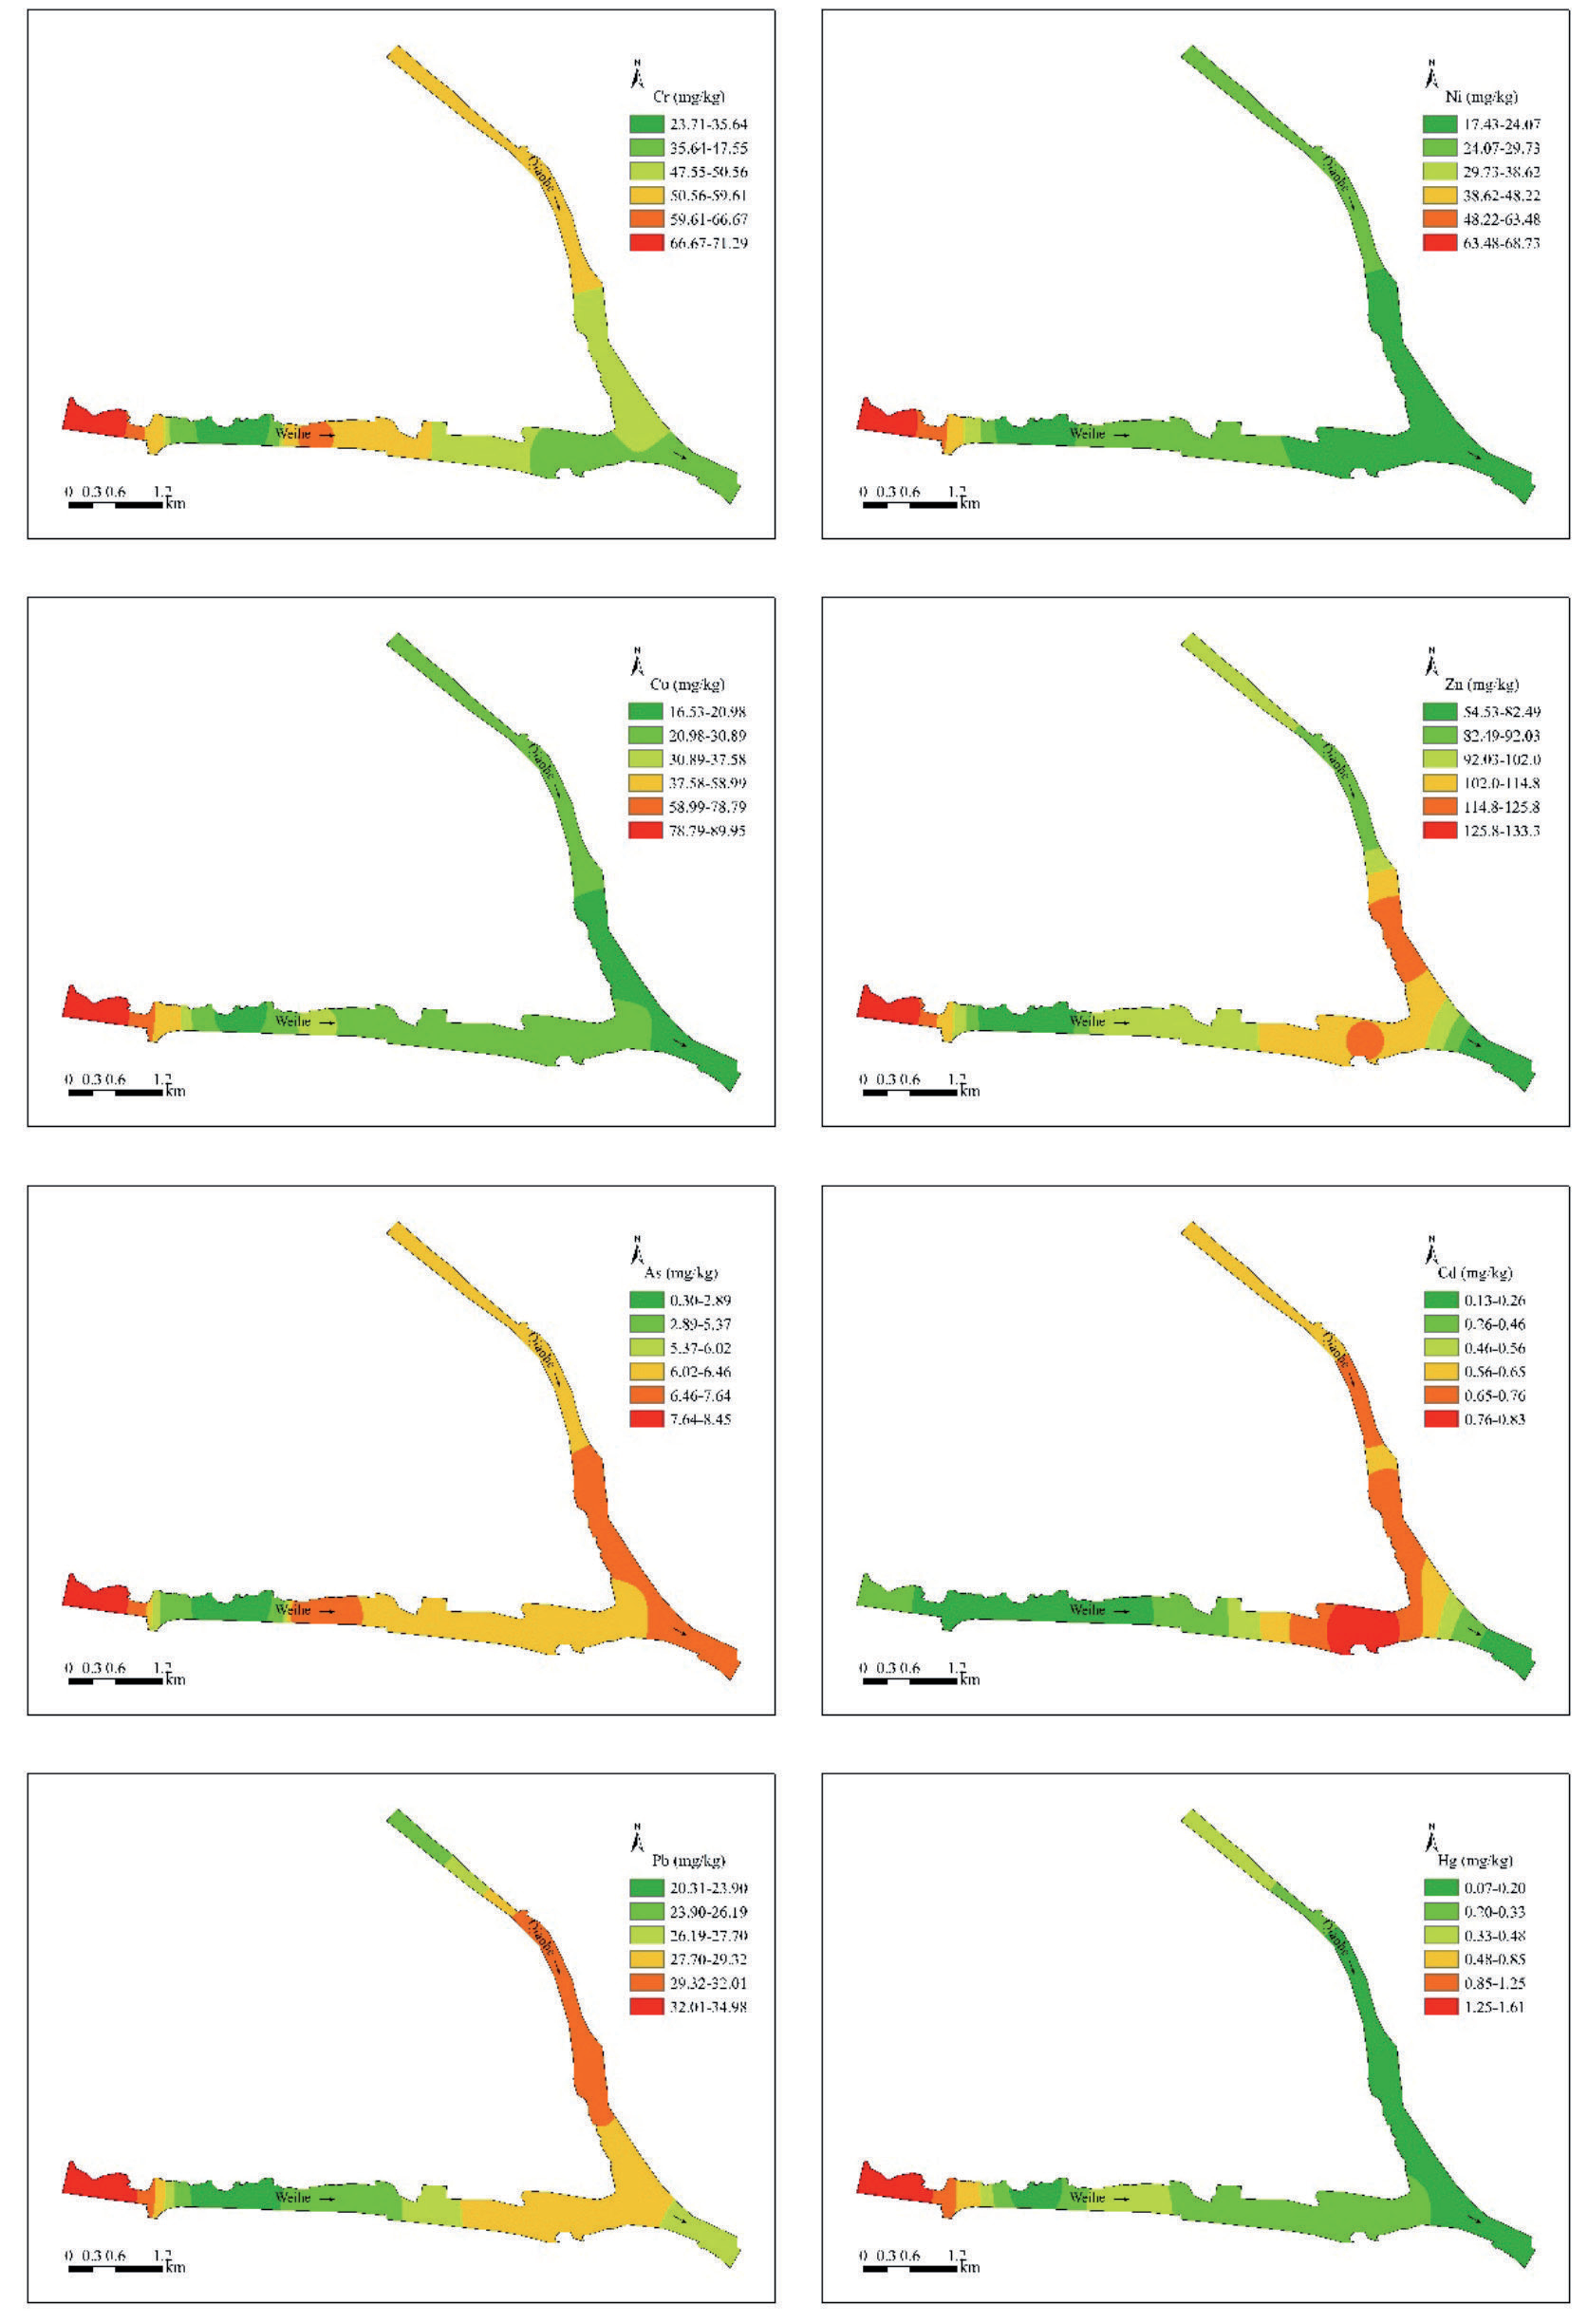
The concentration distribution of HMs in river sediments in the study area is shown in Fig. 3. The concentrations of Cr, Ni, Cu, Zn, As, Cd, Pb, and Hg ranged from 23.70 to 71.29 mg/kg, 17.43 to 68.73 mg/kg, 16.53 to 89.96 mg/kg, 54.53 to 133.28 mg/kg, and 0.35 to 8.45, respectively, mg/kg, 0.13~0.83 mg/kg, 20.31~34.98 mg/kg, and 0.07~1.61 mg/kg, the HM concentration from high to low was: Zn>Cr>Cu> Ni>Pb>As>Cd>Hg. Fig. 3 showed that the concentration of Zn was higher than that of other metal elements, with an average of 94.93 mg/kg. The lowest concentration of Cd was 0.45 mg/kg. The average concentrations of As and Hg were 6.08 mg/kg and 0.39 mg/kg, both of which were lower than the soil background concentrations in Shaanxi Province.
Table 6.
Potential ecological risks and comprehensive potential ecological risks of HM in the river.
Table 7.
Potential ecological risks and comprehensive potential ecological risks of HM in the river.
The comparison of HMs concentration in sediments with that of other rivers in the literature is shown in Table 7 [39-45]. Compared with the Weihe River basin, the HM concentration in the sediments of the Yellow River, Liaohe River, Pearl River, and Haihe River was slightly lower. As the largest tributary of the Yellow River basin, the HMs concentration in the sediments of the Wei River is generally higher than that of the main stream of the Yellow River. The concentrations of Cr, Ni, and Zn in the sediments were basically in the middle of the investigated rivers. The concentrations of Cu, Cd, and Pb in the Pearl River were obviously higher than those in other rivers. Hg and Cd concentrations were generally low in all river sediments.
The HMs Contamination in Sediments
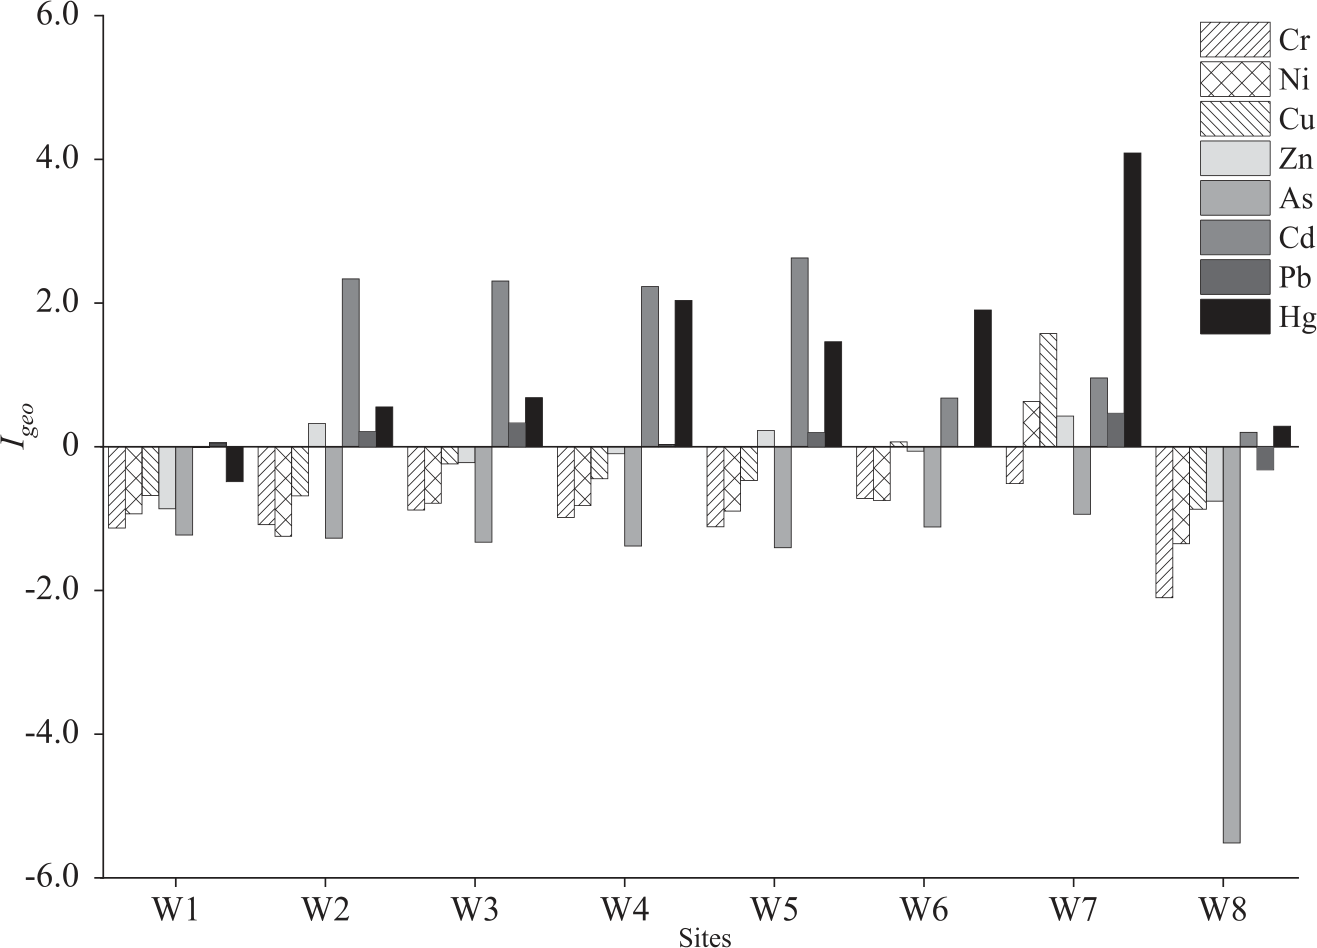
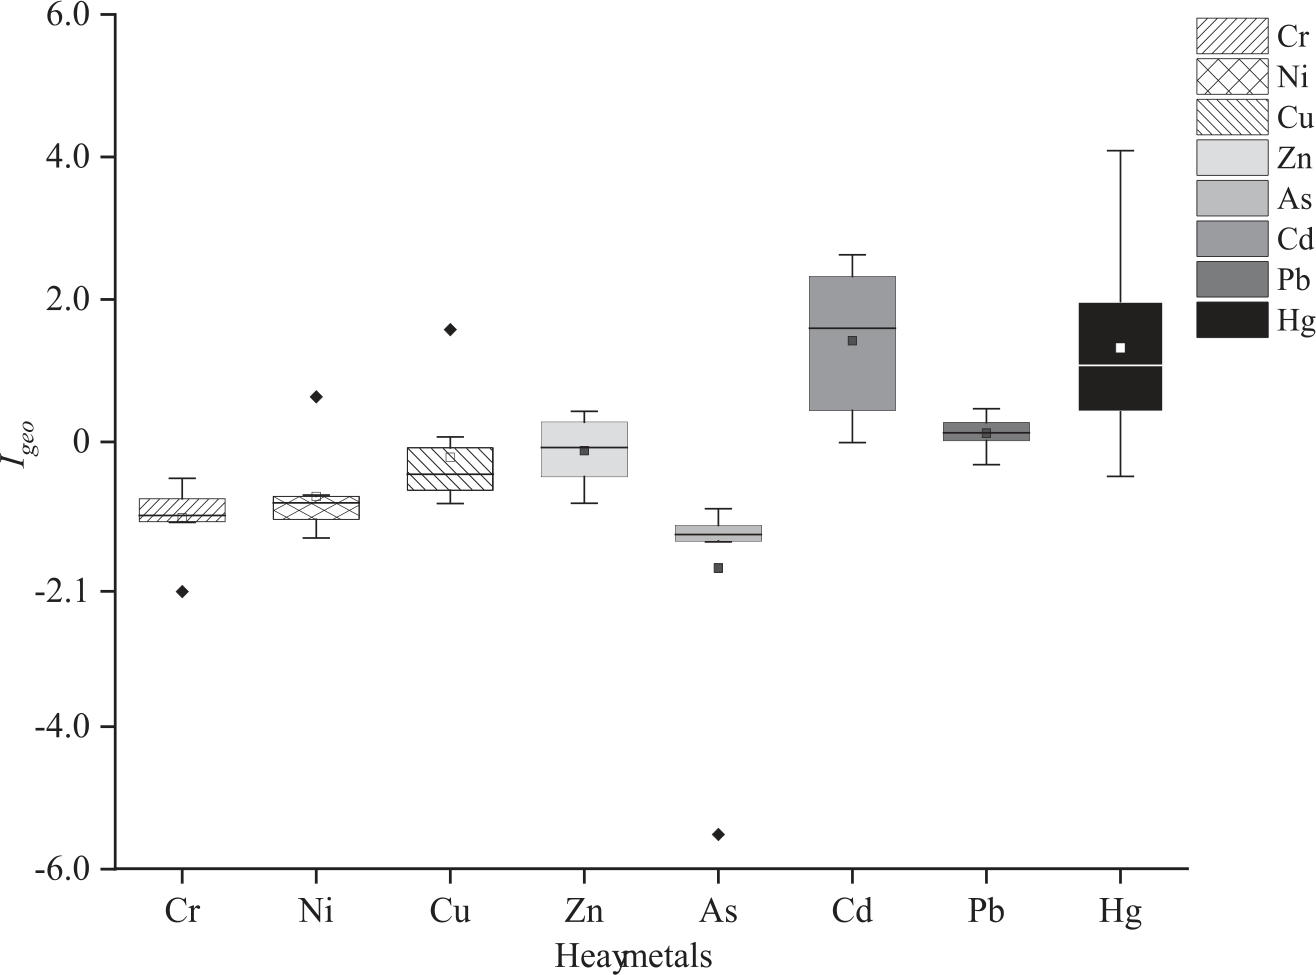
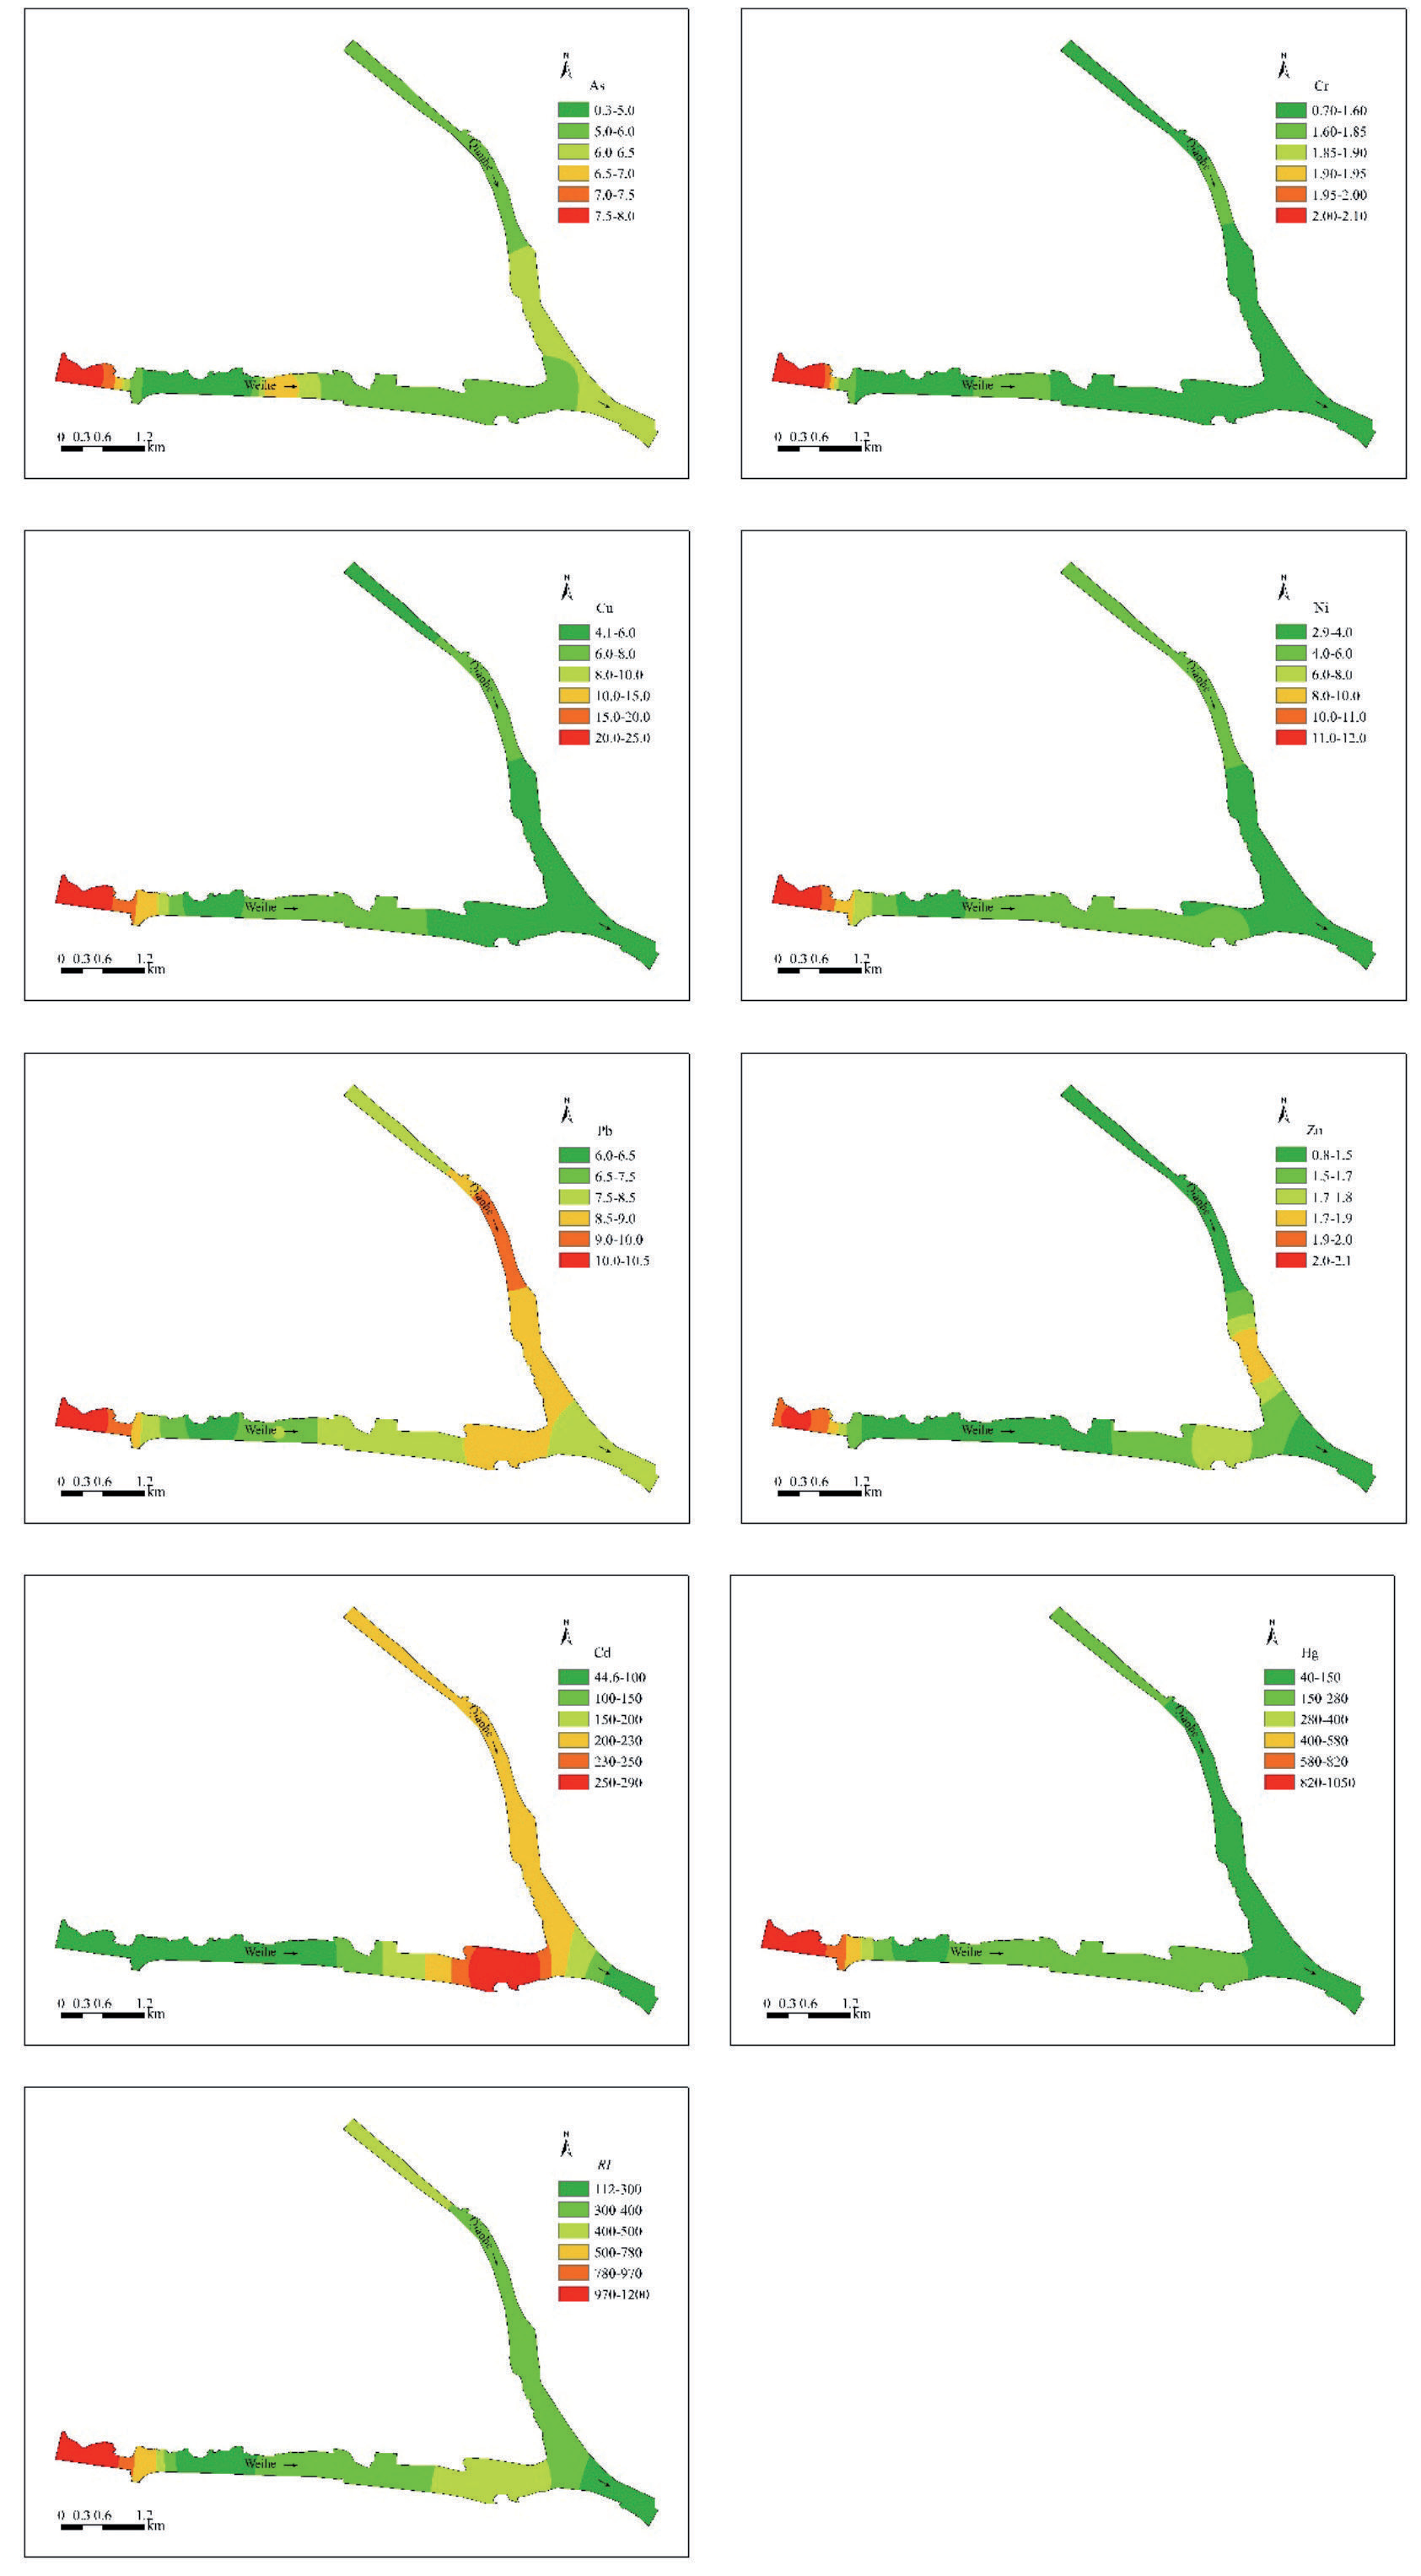
The Geoaccumulation index (Igeo) considers both the background value of natural geological processes and the influence of human activities on HMs pollution. using Igeo to evaluate HMs pollution in river sediments is shown in Fig. 4 and Fig. 5. In general, the average Igeo values of HMs were Hg>Cd>Pb>Zn>Cu>Ni>Cr>As. It was obvious that the sediment Cr and As (Igeo value was less than 0) were unpolluted. There was slight pollution of Pb in sediments (Igeo value was between 0 and 1), but the enrichment was not obvious in sediments. In addition, the high values of Ni, Cu, and Zn were at W7, and the pollution degree was unpolluted to moderate to moderate, and concentrated in metallurgy, metal material manufacturing, railway station (Baoji South Railway Station), and urban main road crossing area [46]. The important point was that the Igeo value of Cd ranged from -0.01 to 2.63, and the pollution degree ranged from no pollution to moderate pollution. The Igeo value of Hg ranged from -0.32 to 4.09, and the pollution degree varied from un-pollution to heavy to extreme. The investigation found that the riverbed at W8 was greatly affected by human activities. After concrete hardening, only a small amount (less than 10 cm in thickness) of sediment was deposited. The heavy metals and other pollutants in the water moved to the downstream river along with the water flow. Therefore, only Cd and Hg were slightly polluted in the sediments (Igeo value was between 0 and 1) [47]. On the contrary, W7 in the lower reaches of the Qingshui River, located in the concentrated areas of railway and road transportation (Riverside Road), metal material processing, and coal-fired heating. At the same time, due to the contribution of pollutants discharged by upstream agricultural production, mining development, and metallurgy activities, there were different repeated enrichments of 6 metallic elements in the sediment except Cr and As, and the pollution degree was unpolluted to moderate to heavy to extreme [48]. Naturally, HMs migrated to the downstream reaches under hydraulic action and accumulated in the sedimentary material at the channel interception.
HM Potential Ecological Risk of Sediments
To study the potential ecological risk of HMs in sediments. For a single HM element, the ecological hazard index of Cr, Ni, Cu, Zn, As, and Pb in sediments was lower than 40.0, indicating only a slight potential ecological risk. The spatial changes of Cd, Hg, and RI are shown in Fig. 6. The risk degree of Cd was from moderate to strong, and the highest ecological risk in W5 was 278.10. In general, it showed that the Qian River (W1→W4) was higher than the Wei River (W5→W8). The potential ecological risk of Hg in the sediments of the Qianhe River is lower than that of the Weihe River, with the lowest ecological risk (42.86) and the highest ecological risk (High) at W1, and the RI value is 1020 (W7). The ecological risk degree of individual metal elements is Hg>Cd>Pb>Cu>As>Ni>Cr>Zn. Compared with the above-mentioned cumulative pollution index evaluation results, the ecological risk assessment method not only considers the type and content of pollutants, but also the toxicity coefficient of heavy metals themselves [49]. The toxicity coefficients of Hg and Cd are 40 and 30, respectively, thus affecting the potential ecological risk evaluation results.
Discussion
The artificial development of urban rivers leads to the development of lakes, and the pollutants are quickly transferred and deposited in the sediment, while the release of pollutants makes it easy to produce secondary pollution. The risk level of sediment pollution reflects the degree of pollution affected by human activities and industrial enterprises. The Nemerow index and potential ecological risk index are consistent overall, but some points show a high Nemerow index, which is speculated to be due to the overemphasis of the Nemerow index method on the impact of the largest pollutants on the environment [50]. Zhang et al. (2021) [51], combined with the research of many scholars, found that there is heavy metal enrichment in most rivers in China, especially in areas with frequent industrial activities, which is consistent with this study [52].
Fig. 7.
The Pearson correlation analysis heat map of HMs. The red and blue indicate positive and negative correlations, respectively. Each circle with a larger area and a darker color indicates a higher correlation.
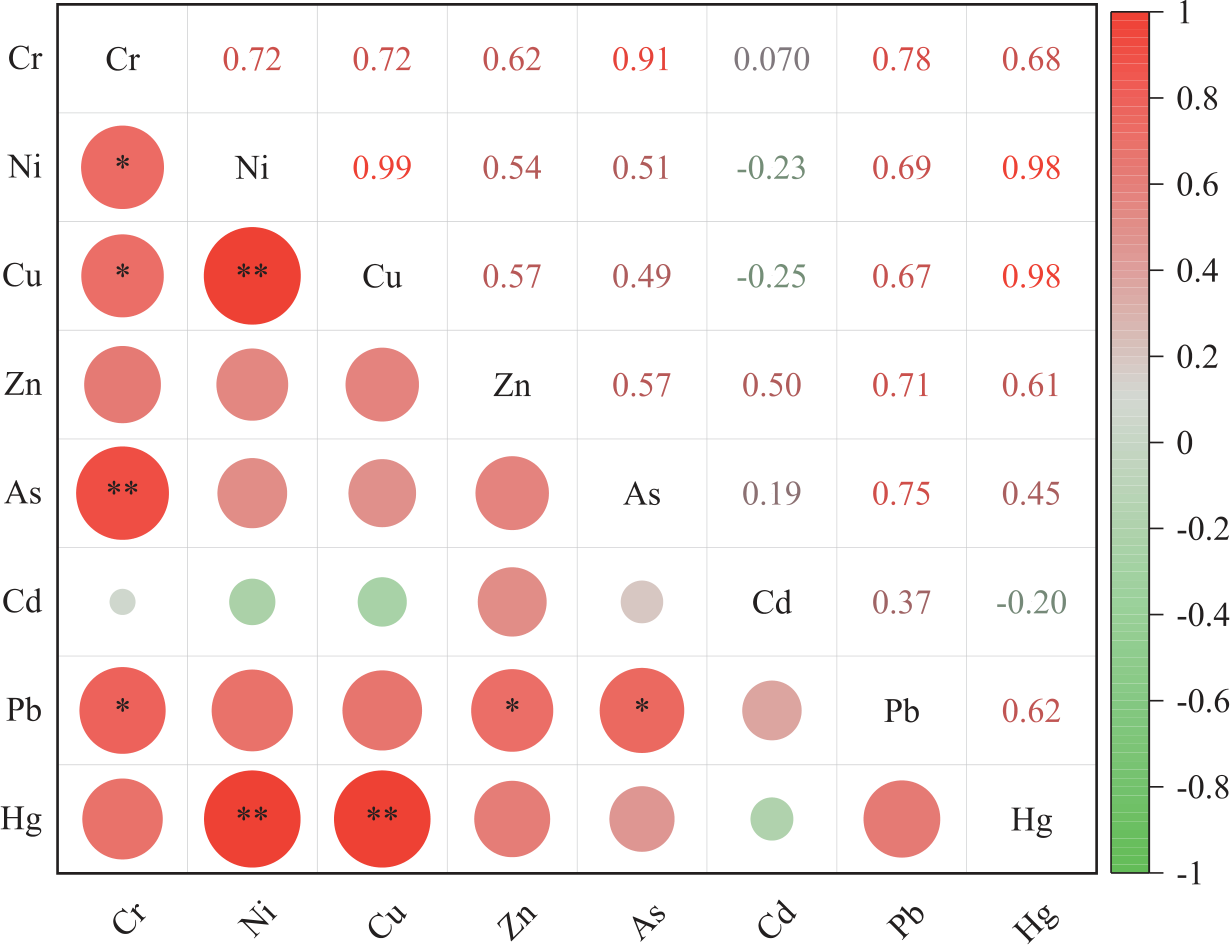
The HMs correlation analysis results are shown in Fig. 7. Cu was extremely significantly correlated with Ni (P less than 0.01), As was extremely significantly correlated with Cr, and Hg was extremely significantly correlated with Ni and Cu, indicating that these elements would have the same source. Pb was significantly correlated with Cr, Zn, As, and Ni, and Pb and As had similar characteristics, indicating that the pollution of HMs in this river section was complex and there would be similar source migration paths. According to the investigation and the previous analysis, HMs would come from the introduction of upstream rivers, urban renewal and construction on both sides of the river, centralized discharge of sewage (sewage treatment plant), metallurgy, metal material manufacturing, and transportation. This result was consistent with the relevant research conclusions of Yi et al. (2018) [53], Geng et al. (2021) [37], Wang et al. (2020) [15] and others in the same region.
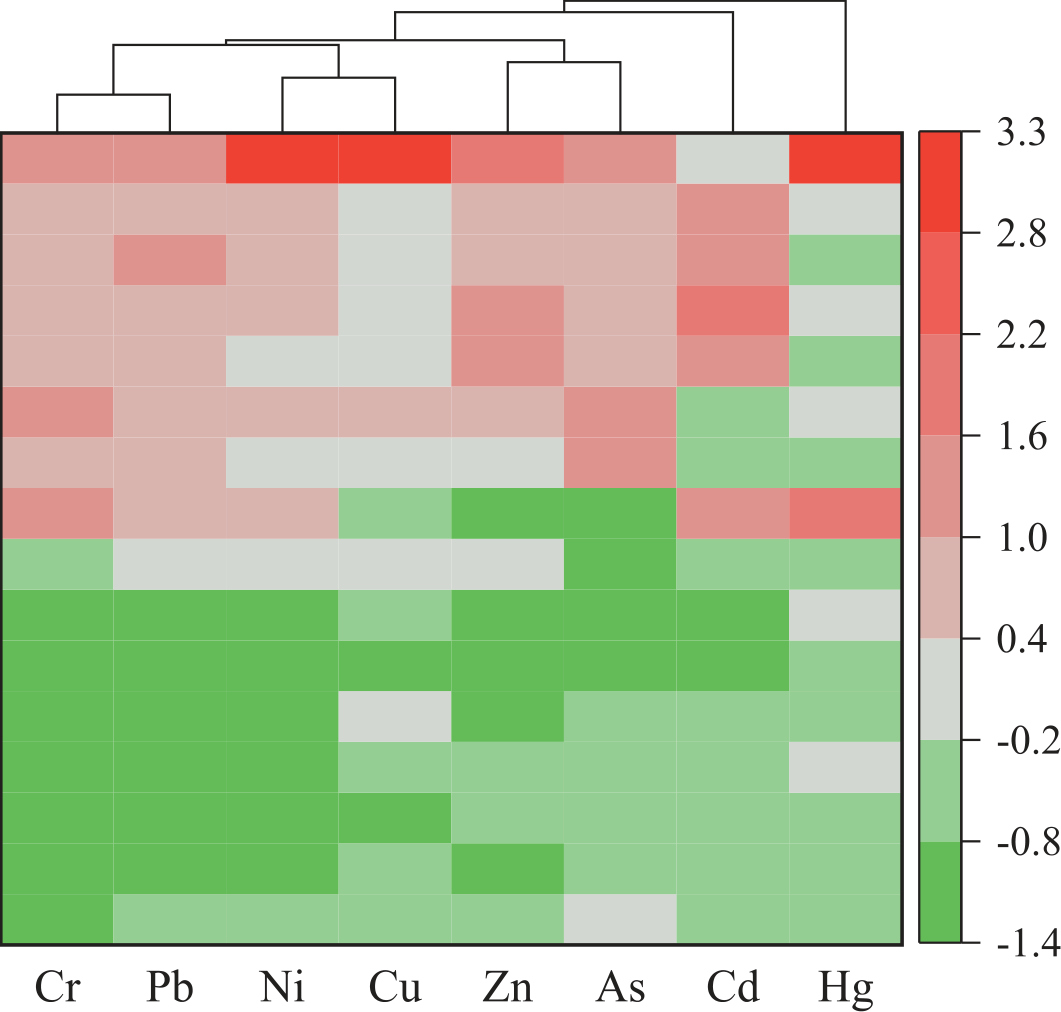
CA was used to classify the sampling sites or heavy metals as a function, and identify the source of heavy metals in combination with the contamination level of sediments. As shown in Fig. 8, the cluster diagram could vividly reveal the relationship between various heavy metals and more intuitively determine the pollution source of heavy metals. Combined with the actual environmental factors, HMs could be divided into Hg, Cd, and Cr-Pb-Ni-Cu-Zn-As components, indicating that each component would come from different pollution sources. Considering the Nemero pollution index, Igeo and RI evaluation results, cluster 1 with the most severe Hg pollution was mainly located in W7 and W8, which were also the concentrated distribution areas of industrial enterprises (metallurgy and metal material manufacturing), railways, and road transportation. Cluster 2 mainly included the lower reaches of the Qianhe River and Weihe River in the study area. The pollutants in cluster 3 were mainly Pb, mainly from W7. The rest of the HMs content was low and was generally in an uncontaminated state.
From the correlation and cluster analysis results of the eight heavy metal contents, it could be seen that industry, transportation, and agricultural production were the main sources of HMs in the study area, followed by the natural sources. This was related to the positioning of the study area as an industrial city for many years. Baoji is an important industrial city, and also a hub city of railway and highway transportation. Baoji Railway and Longhai Railway are interconnected, and a number of highways and provincial roads run through the territory. In addition, river closure and water storage, as well as wetland construction and protection, activities were frequent, resulting in relatively serious river HMs pollution [54]. The results of this study showed that HM concentration in urban rivers was not only related to point source pollution, but also related to urban industrial activities, commercial activities, and life activities, which was consistent with the research results of other scholars in the same field. Cheng et al. (2019) [55] leaded pollutions mainly come from natural background and man-made sources, with contribution rates of 45% and 55%, respectively. Industrial sources affect the accumulation of Hg in urban river sediments. Saiful et al. (2022) [56] found that severe man-made pressure and urbanization had significant impacts on the soil environment in the capital of ancient Pundranagar, Bangladesh. The Ga-Selati River sediments in South Africa had the highest accumulation of chromium and nickel, and pollution levels in the middle reaches were much higher than at upstream and downstream sites, mainly from mining, wastewater/sewage, and agricultural discharges [57]. In addition to natural factors, human activities such as agricultural production and fossil fuel utilization also significantly affected the spatial distribution of HMs in river sediments in the Beijing-Tianjin area [58]. However, Setia et al. (2020) [59] emphasize that non-point sources of HM concentrations, such as agricultural surface runoff and soil erosion in urban areas, should not be ignored due to their complexity and difficulty in analysis.
The research analysis showed that river ecological environment protection and pollution control in Baoji should be carried out from the perspectives of source control, path control, and terminal treatment [60]. Firstly, strengthen the production level of key industrial enterprises (such as BAOTI Group Co., Ltd., and other metal smelting and processing enterprises) and strictly control the discharge of pollutants. Pollutants generated by industrial production and transportation are discharged into sewage treatment plants for treatment in accordance with the requirements and then discharged after meeting the specified standards (W8) so as to reduce the concentrated discharge of pollutants from the source. Strengthen the detection of river water quality and pay attention to the upstream water situation in Baoji so as to prevent the import of foreign pollutants. Secondly, focus on strengthening the control of river HMs pollution, combined with the construction and protection of Qianweizhihui National Wetland Park, optimizing waterways through the reasonable layout of water conservancy projects, and reducing the accumulation of HMs in sediments. In addition, it was necessary to reasonably plan traffic routes, strengthen urban vehicle management, and ensure transportation on the basis of reducing pollution discharge as much as possible. Moreover, in the construction of intensive, high-standard farmland, it was important to strictly control the use of pesticides and fertilizers containing HMs, scientific irrigation, and the non-point source pollution of farmland into urban rivers [61]. In particular, in the study area, the use of biological agents and the planting of hyper enrichment plants require human intervention to control the polluted water and sediment. This study can improve public awareness of soil heavy metal pollution and provide important information for further control and reduction of soil heavy metal pollution.
Conclusions
On the basis of the HMs investigation of water and sediment in the confluence of the Qianhe River and the Weihe River in Baoji City, according to the current analysis results, we can draw the following conclusions:
(1) The results of the Nemerov comprehensive pollution index and ground accumulation index showed that the HM concentration showed a pattern of main stream>tributary, upstream<downstream. The highest concentrations of Cr, Ni, Pb, and Hg in river water exceeded GB3838 Class II standard limits, while the HM concentration in sediments was Zn>Cr>Cu>Ni> Pb>As>Cd>Hg from high to low.
(2) Because of the contribution of pollutants from urban point sources and tributaries, the ecological risk levels of HMs in each river reach were different. The degree of potential ecological risk from the upper reaches to the lower reaches of the river was: high → considerable → moderate → considerable. However, the ecological risk degree of individual metal elements is Hg>Cd>Pb>Cu>As>Ni>Cr>Zn. Due to the different toxicity coefficients of different elements, the ecological risk assessment method will affect the potential ecological risk assessment results while considering the types and contents of pollutants.
(3) The river HMs mainly come from centralized wastewater discharge, transportation (railway and highway hubs), metallurgy, industrial enterprises (metal material manufacturing), and agricultural production. For this, the monitoring analysis strictly requires centralized wastewater discharge to meet the standards before discharge. The application of pesticides and fertilizers in intensive, high-standard farmland construction is controlled to minimize the discharge of agricultural non-point source pollution into rivers. The enhancement of riverside transportation vehicles, station waste disposal, and river wetland pollution restoration and treatment are the key directions of urban river HMs treatment in the future.
Limitations and Future Research Directions
There are still the following shortcomings in this paper: This paper only studies part of the Weihe River in Baoji City. Further studies on the distribution and risk of HMs on a larger scale or even within a basin are needed in the future. To investigate the migration and accumulation mechanism of HMs to aquatic organisms and even in ecosystems.

